Market Overview
| Study Period | 2021 - 2031 |
|---|---|
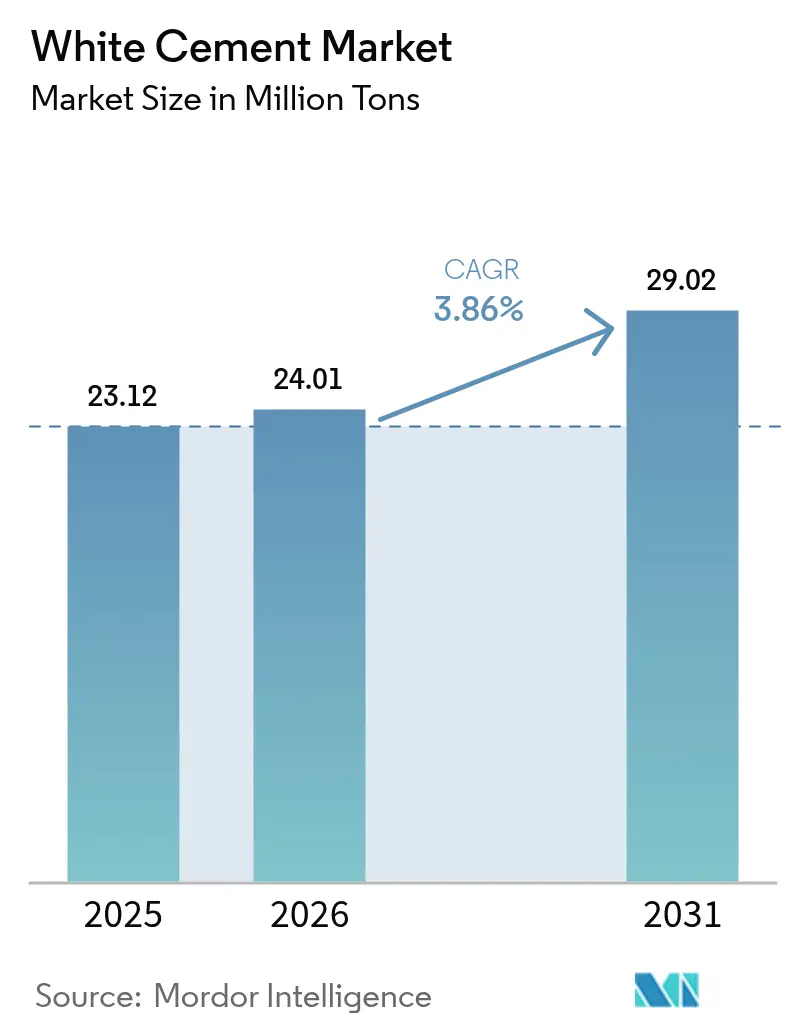
| Market Volume (2026) | 24.01 Million tons |
| Market Volume (2031) | 29.02 Million tons |
| Growth Rate (2026 - 2031) | 3.86% CAGR |
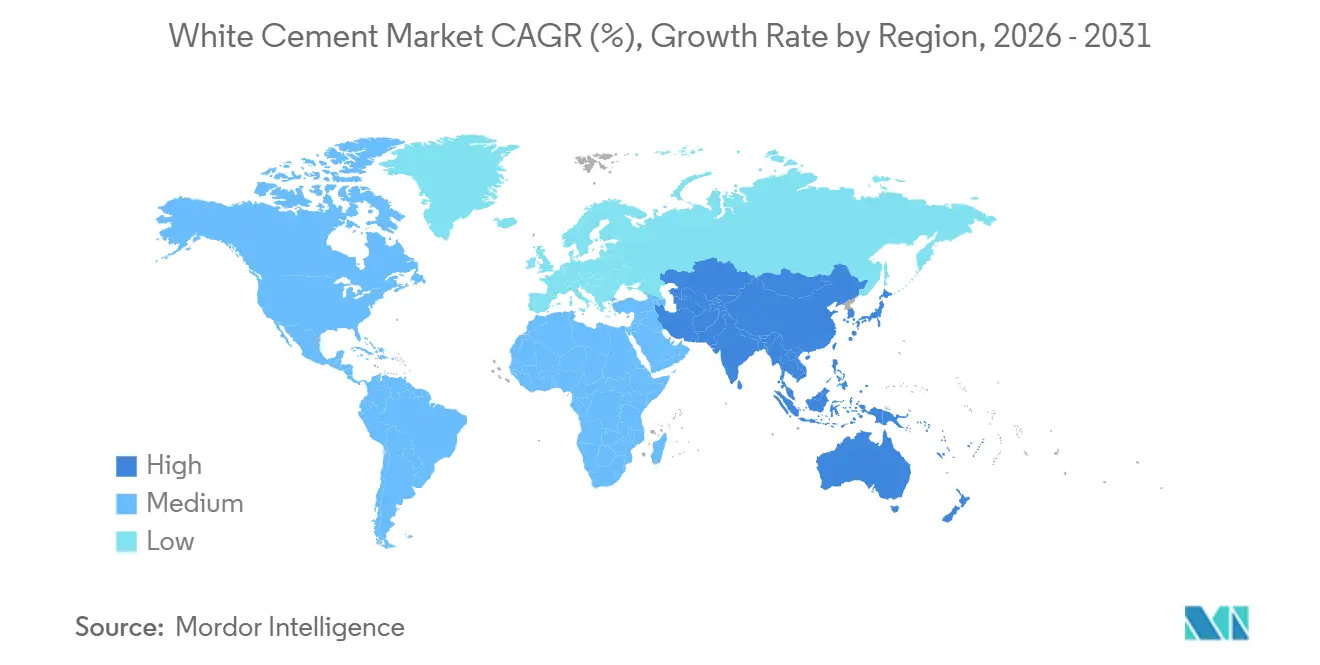
| Fastest Growing Market | Asia Pacific |
| Largest Market | Asia Pacific |
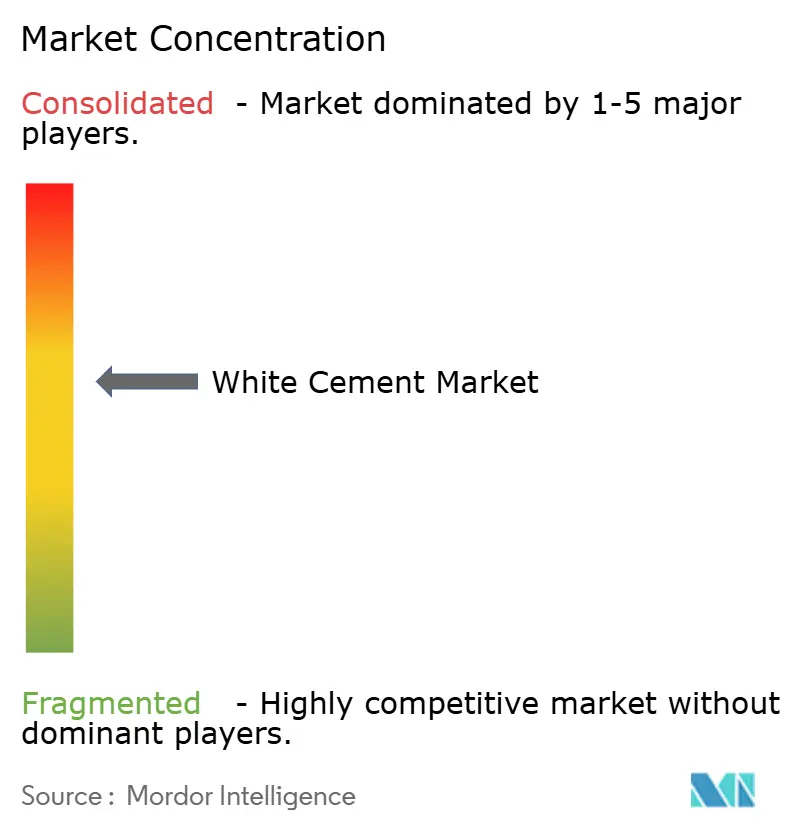
| Market Concentration | Medium |
Major Players *Disclaimer: Major Players sorted in no particular order Image © Mordor Intelligence. Reuse requires attribution under CC BY 4.0. | |
White Cement Market Analysis by Mordor Intelligence
The White Cement Market size is expected to grow from 23.12 Million tons in 2025 to 24.01 Million tons in 2026 and is forecast to reach 29.02 Million tons by 2031 at 3.86% CAGR over 2026-2031. Robust residential upgrades in Asia-Pacific, the adoption of cool-roof systems in hot climates, and a wave of premium façade projects in the Middle-East are reinforcing demand even as limited ultra-low-iron limestone supplies restrict capacity expansion. Producers are differentiating through low-carbon formulations and tight color-control protocols, while architects push for consistent L* values above 90 to satisfy modern aesthetic and sustainability criteria =. Vertical integration into high-purity quarries gives incumbents cost leverage, whereas new entrants without captive raw materials face margin pressure from freight and feedstock volatility. Overall, the white cement market continues to migrate from a niche decorative binder toward a mainstream solution that combines visual appeal with functional heat-reflective and photocatalytic properties.
Key Report Takeaways
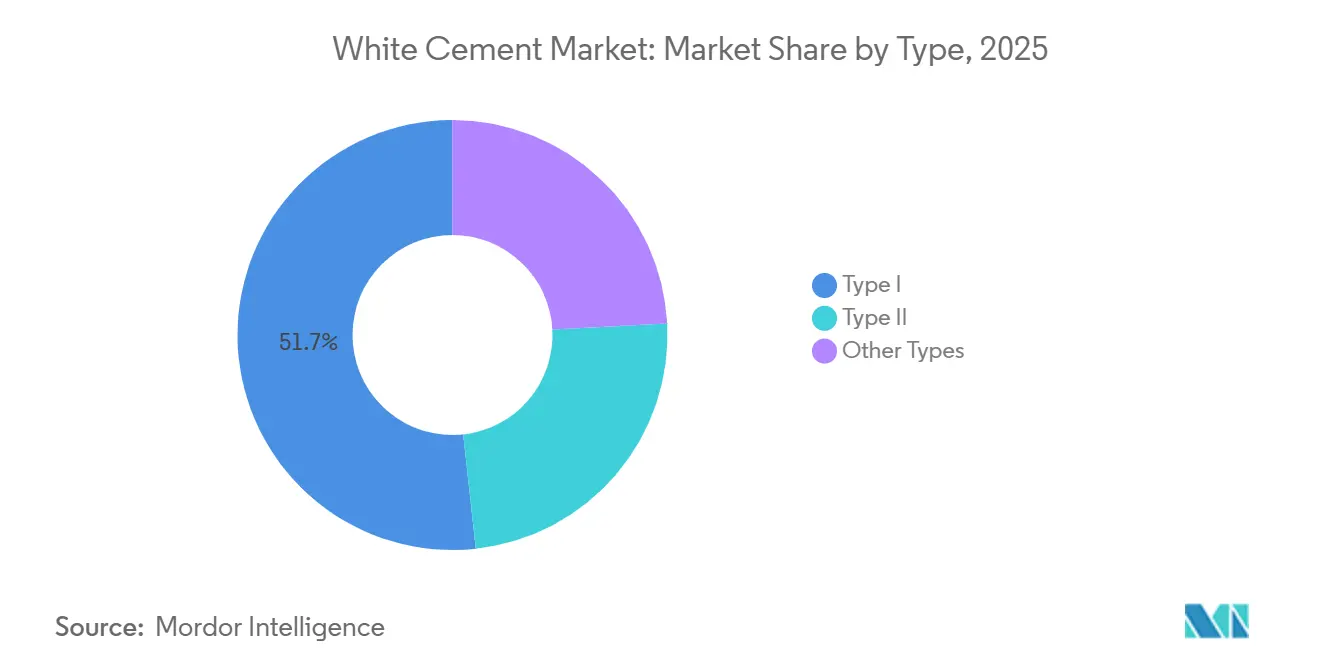
- By type, Type I captured 51.72% of the white cement market share in 2025 and is projected to advance at a 4.11% CAGR through 2031.
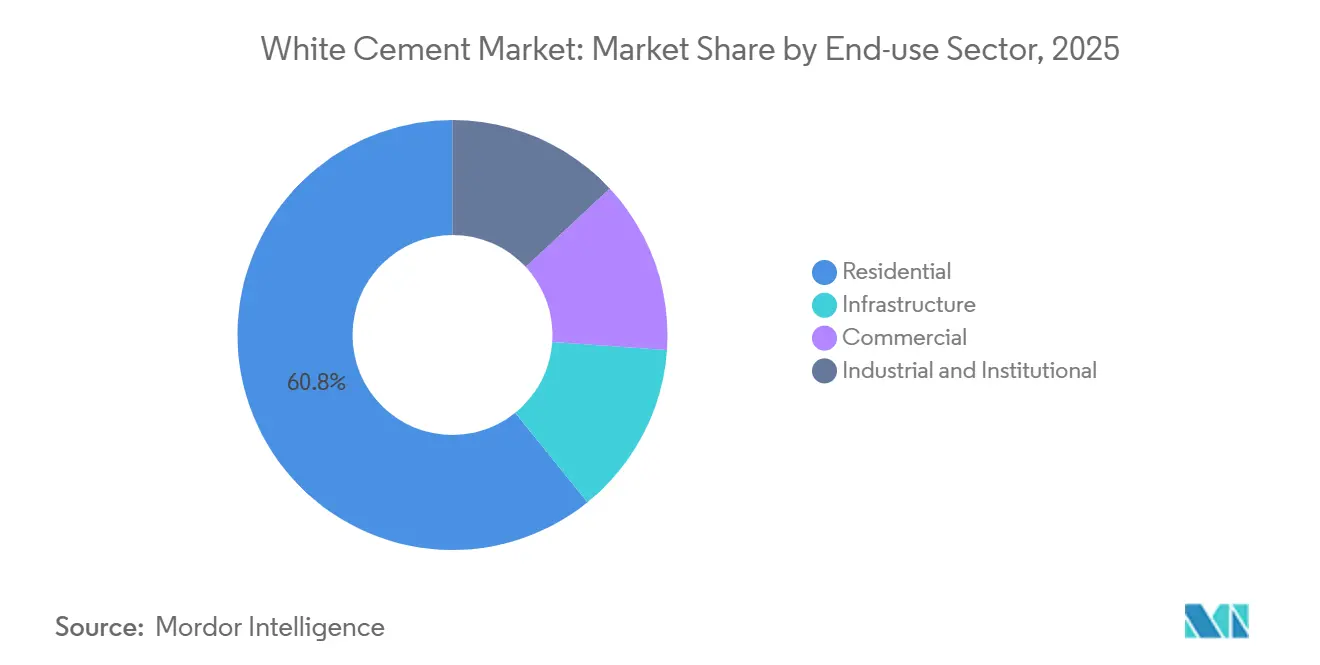
- By end-use sector, residential accounted for 60.81% of the white cement market share in 2025 and is expanding at a 4.22% CAGR through 2031.
- By geography, Asia-Pacific accounted for 47.56% of the white cement market share in 2025 and is expanding at a 4.36% CAGR through 2031.
Note: Market size and forecast figures in this report are generated using Mordor Intelligence’s proprietary estimation framework, updated with the latest available data and insights as of 2026.
Global White Cement Market Trends and Insights
Drivers Impact Analysis*
| Driver | (~) % Impact on CAGR Forecast | Geographic Relevance | Impact Timeline |
|---|---|---|---|
| Decorative and architectural construction surge | +1.2% | Global, with concentration in Asia-Pacific (India, Vietnam, Thailand) and Middle-East (UAE, Saudi Arabia) | Medium term (2-4 years) |
| Infrastructure mega-projects in Asia-Pacific and Middle-East and Africa | +1.0% | Asia-Pacific core (India, Vietnam, Indonesia), spill-over to Middle-East (Saudi Arabia, UAE, Qatar) | Long term (≥ 4 years) |
| Heat-reflective roofing demand in hot climates | +0.7% | Middle-East, South Asia, Southeast Asia, Southern Europe | Short term (≤ 2 years) |
| Heritage restoration premiumization | +0.4% | Europe (Italy, France, Spain), North America (United States historic districts), select Asia-Pacific sites | Long term (≥ 4 years) |
| Low-carbon white PLC and CSA cement adoption | +0.6% | Europe (EN 197-1 compliance), North America (LEED-driven), early gains in India and Thailand | Medium term (2-4 years) |
| Source: Mordor Intelligence | |||


Decorative and Architectural Construction Surge
Developers now embed Type I white binders into precast façades, GFRC panels, and terrazzo floors to create daylight-rich interiors that cut artificial lighting loads. High-profile examples such as the Kennedy Center expansion in Washington D.C. and Fondazione Prada in Milan demonstrate how white concrete elevates building branding while supporting well-being goals. Photocatalytic formulations that decompose nitrogen oxides further position the material as a functional urban-air remedy. Asia-Pacific high-rise apartments in Mumbai and Ho Chi Minh City increasingly use white-cement tile adhesives and grouts that withstand humidity, signaling the product’s shift from luxury to mainstream. Robotic extrusion in 3D-printing labs also demands ultra-white, low-viscosity pastes, embedding the white cement market deeper into emerging construction technologies.
Infrastructure Mega-Projects in Asia-Pacific and Middle-East and Africa
Public spending pipelines such as India’s National Infrastructure Pipeline and Saudi Arabia’s Vision 2030 integrate white cement into bridges, metros, and cultural centers that must satisfy both aesthetics and high-albedo mandates. SCG Cement’s 3 million tons Vietnamese complex taps this demand by exporting to the United States, Australia, and Saudi Arabia, while planning an 8,000-tpd low-carbon kiln to secure future supply. Mega-projects like NEOM and the Museum of the Future highlight regional preference for heat-reflective skins, extending the white cement market footprint into heavy civil works formerly dominated by gray cement.
Heat-Reflective Roofing Demand in Hot Climates
Energy codes such as California’s Title 24 and GCC green-building mandates reward roofing systems with Solar Reflectance Index scores above 90[1]U.S. Department of Energy, “Building Energy Codes Program,” energy.gov . White-cement tiles reflect 70-80% of solar radiation, lowering roof temperatures by up to 30 °C and trimming cooling loads by 10-30% according to the International Energy Agency. JK Cement’s JK White+ roof-tile program targets tier-2 Indian cities where consumers upgrade from asbestos and clay options, cementing the white cement market as an energy-saving material for mass housing. Developers accept a 15-20% price premium because lifecycle savings offset initial outlays within five to seven years.
Heritage Restoration Premiumization
Conservation architects specify low-alkali white blends to match historic lime mortars in UNESCO sites across Italy, France, and Spain. Similar projects in Boston and Charleston require color fidelity and breathability, leading to 30-50% mark-ups over standard grades. Government grants in India and Thailand finance temple restorations that rely on white cement’s fine particle size to replicate ornate stucco details. Although volumes remain modest, margin contribution is outsized, encouraging producers to maintain small-batch lines dedicated to restoration grades.
Restraints Impact Analysis*
| Restraint | (~) % Impact on CAGR Forecast | Geographic Relevance | Impact Timeline |
|---|---|---|---|
| Scarcity of ultra-low-iron raw materials | -0.8% | Global, acute in regions lacking high-purity limestone deposits (Sub-Saharan Africa, parts of South America) | Long term (≥ 4 years) |
| Colour-integrity risk from alternative fuels and SCMs | -0.5% | Europe (high alternative-fuel mandates), Asia-Pacific (SCG Cement 45-50% target), North America (PLC adoption) | Medium term (2-4 years) |
| Clinker-replacement quotas lowering white-cement specs | -0.3% | Europe (EN 197-1 compliance), North America (ASTM C595 adoption), early impact in India and China | Medium term (2-4 years) |
| Source: Mordor Intelligence | |||
Scarcity of Ultra-Low-Iron Raw Materials
White cement requires limestone with Fe₂O₃ below 0.5%, and such geology is rare outside Rajasthan, northern Vietnam, and a few Mediterranean basins. Exploration and permitting for new quarries can exceed seven years, so capacity growth lags demand, sustaining price premiums over gray cement. Asian Paints’ Fujairah plant imports raw feed, exposing margins to freight swings, while Sub-Saharan producers struggle to locate economically viable deposits. Resulting supply tightness favors incumbents with captive mines and deters fast capacity additions, moderating the white cement market growth trajectory.
Colour-Integrity Risk from Alternative Fuels and SCMs
Biomass ash can introduce iron and manganese that darken clinker, while fly ash and GGBFS contain elevated Fe₂O₃, jeopardizing L* targets required for premium façades. European mandates driving 30-40% clinker replacement intensify this tension, forcing producers to balance CO₂ goals with color performance. Additional filtration, fuel-preprocessing, and feeder-calibration systems raise operating costs by 5-10%, narrowing spreads above gray cement. Specifiers in Southeast Asia and the Middle-East remain cautious, preferring traditional formulations for landmark projects until robust whiteness guarantees emerge.
*Our forecasts treat driver/restraint impacts as directional, not additive. The impact forecasts reflect baseline growth, mix effects, and variable interactions.
Segment Analysis
By Type: Type I Specification Consistency Drives Dominance
Type I accounted for 51.72% of the 2025 volume, cementing its role as the backbone of the white cement market share. The white cement market size for Type I is forecast to expand at 4.11% CAGR through 2031, outperforming Type II because sulfate-resistant applications remain niche. Producers therefore channel R&D budgets toward brightness enhancement and low-carbon variants within Type I grades, leaving other categories relatively static.
Type II maintains relevance in coastal infrastructure that confronts sulfate attack. Other specialized formulations, rapid-hardening and low-heat, serve winter construction and heritage repair, but volumes remain small. As end-users increasingly demand verified color and performance data, Type I’s standardized ASTM C150 profile strengthens its competitive moat against alternatives.


By End-use Sector: Residential Sector Leads Adoption
Residential represented 60.81% of the 2025 white cement market size and continue to grow at a sector-leading 4.22% CAGR through 2031. Middle-income consumers in India and Indonesia upgrade kitchens and exteriors with white-cement grouts and renders that resist mold. Dealer networks exceeding 15,000 outlets in India ensure retail availability and brand familiarity.
Commercial complexes and hospitality resorts choose white concrete for landmark façades, but financing cycles and interest-rate sensitivity temper volume growth. Industrial and institutional facilities prioritize cost efficiency, limiting white cement usage to lobbies and atriums. Infrastructure benefits from aesthetic mandates in metros and airports, gradually integrating decorative white elements that raise civic pride and tourism appeal.
Geography Analysis
Asia-Pacific held 47.56% of the 2025 volume and is set to post a 4.36% CAGR through 2031, the fastest among all regions. India recorded 444.2 million tons total cement consumption in 2024, with white cement riding infrastructure and housing cycles backed by JK Cement’s 950,000 tpy Gotan plant. Vietnam’s demand rose substantially in 2024-2025, and SCG exports excess output to Australia and Saudi Arabia, magnifying the regional white cement market footprint.
North America and Europe display steady but slower gains. U.S. imports under tariff code 2523.29 feed precast façade and terrazzo producers, while ASTM C595-compliant limestone blends aim to cut embodied carbon[2]U.S. Geological Survey, “Mineral Commodity Summary: Cement 2026,” usgs.gov . Europe anchors premium heritage restorations and low-carbon trials, led by Cementir’s Aalborg White D-Carb launch that posts a 40% CO₂ drop without major color sacrifice.
The Middle-East and Africa leverage Vision 2030 and similar programs to embed white cement into mosques and cultural venues. Saudi Arabia’s construction sector operates at moderate utilization, with NEOM and Qiddiya specifying ultra-white façades that cope with solar gain. Asian Paints’ 265,000 tpy Fujairah plant supplies GCC decorators but remains vulnerable to raw-material imports, underlining logistic risks in the regional white cement market. South America, led by Brazil, registers marginal growth tied to urban housing renovations yet faces economic headwinds that delay capacity investments.

Competitive Landscape
The white cement market is moderately concentrated around vertically integrated incumbents that command scarce high-purity quarries. JK Cement controls the majority of India’s volume through its Gotan complex, leveraging mine-to-market integration to defend margins. Cementir’s Aalborg White brand positions itself at the premium sustainability end, pricing D-Carb 20-25% above conventional grades while securing LEED Platinum projects in Europe and North America.
SCG’s 3 million tons Vietnamese base pumps exports to the United States and GCC while investing in an 8,000-tpd kiln that will raise alternative fuel use to 50%, an ambitious target that demands strict ash-chemistry controls to avoid color drift. Holcim and CEMEX retrench by divesting marginal plants and bundling white products with digital services, focusing on higher-margin Solutions & Products divisions. New entrants such as Asian Paints test vertical integration but lack captive quarries, exposing them to volatile shipping costs and quality-control risks.
Emerging disruptors pursue calcium sulfoaluminate binders, yet the absent whiteness clauses in ASTM and EN standards restrain adoption. Geographic white spaces in Sub-Saharan Africa remain untapped due to exploration hurdles and political risk, maintaining incumbent advantage. As low-carbon requirements tighten, competitive edge will hinge on balancing CO₂ cuts with L* stability, pushing the white cement industry toward advanced process analytics and selective quarrying strategies.
White Cement Industry Leaders
Cementir Holding N.V.
JK Cement Ltd.
CEMEX S.A.B. de C.V.
HOLCIM
Çimsa Çimento Sanayi ve Ticaret A.Ş.
- *Disclaimer: Major Players sorted in no particular order

Recent Industry Developments
- October 2025: Asian Paints Ltd. announced that its subsidiary, Asian White Inc. FZE, had commenced commercial production at its new white cement manufacturing facility in Fujairah. The plant has an initial production capacity of 265,000 tons per year and represented Asian Paints' entry into the white cement market as part of its diversification and international growth strategy.
- April 2025: UltraTech Cement Ltd. acquired Wonder Cement's white cement business for INR 235 crore. The acquisition enhanced putty production capacity and utilized Wonder Cement's strategically located plant in Rajasthan.


Global White Cement Market Report Scope
White cement is a high-quality Portland cement, free from iron and manganese, specifically designed for decorative and structural applications that require a pure white color. Common uses include mosaics, terrazzo flooring, and tile grouting. It offers high durability, water resistance, quick setting, and effective blending with pigments.
The white cement market is segmented by type, end-use sector, and geography. By type, the market is segmented into type I, type II, and other types. By end-use sector, the market is segmented into residential, commercial, industrial and institutional, and infrastructure. The report also covers the market size and forecasts for white cement in 21 countries across major regions. For each segment, the market sizing and forecasts have been done on the basis of volume (tons).
By Type
| Type I |
| Type II |
| Other Types |
By End-use Sector
| Residential |
| Commercial |
| Industrial and Institutional |
| Infrastructure |
By Geography
| Asia-Pacific | China |
| India | |
| Japan | |
| South Korea | |
| Australia | |
| Indonesia | |
| Thailand | |
| Vietnam | |
| Rest of Asia-Pacific | |
| North America | United States |
| Canada | |
| Mexico | |
| Europe | Germany |
| United Kingdom | |
| France | |
| Italy | |
| Spain | |
| Russia | |
| Rest of Europe | |
| South America | Brazil |
| Argentina | |
| Rest of South America | |
| Middle-East and Africa | Saudi Arabia |
| United Arab Emirates | |
| Rest of Middle-East and Africa |
| By Type | Type I | |
| Type II | ||
| Other Types | ||
| By End-use Sector | Residential | |
| Commercial | ||
| Industrial and Institutional | ||
| Infrastructure | ||
| By Geography | Asia-Pacific | China |
| India | ||
| Japan | ||
| South Korea | ||
| Australia | ||
| Indonesia | ||
| Thailand | ||
| Vietnam | ||
| Rest of Asia-Pacific | ||
| North America | United States | |
| Canada | ||
| Mexico | ||
| Europe | Germany | |
| United Kingdom | ||
| France | ||
| Italy | ||
| Spain | ||
| Russia | ||
| Rest of Europe | ||
| South America | Brazil | |
| Argentina | ||
| Rest of South America | ||
| Middle-East and Africa | Saudi Arabia | |
| United Arab Emirates | ||
| Rest of Middle-East and Africa | ||


Market Definition
- END-USE SECTOR - White cement consumed in the construction sectors such as commercial, residential, industrial, institutional, and infrastructure are considered under the scope of the study.
- PRODUCT/APPLICATION - Under the scope of the study, the consumption of white cement including type I and type II, among others is considered.
| Keyword | Definition |
|---|---|
| Accelerator | Accelerators are admixtures used to fasten the setting time of concrete by increasing the initial rate and speeding up the chemical reaction between cement and the mixing water. These are used to harden and increase the strength of concrete quickly. |
| Acrylic | This synthetic resin is a derivative of acrylic acid. It forms a smooth surface and is mainly used for various indoor applications. The material can also be used for outdoor applications with a special formulation. |
| Adhesives | Adhesives are bonding agents used to join materials by gluing. Adhesives can be used in construction for many applications, such as carpet laying, ceramic tiles, countertop lamination, etc. |
| Air Entraining Admixture | Air-entraining admixtures are used to improve the performance and durability of concrete. Once added, they create uniformly distributed small air bubbles to impart enhanced properties to the fresh and hardened concrete. |
| Alkyd | Alkyds are used in solvent-based paints such as construction and automotive paints, traffic paints, flooring resins, protective coatings for concrete, etc. Alkyd resins are formed by the reaction of an oil (fatty acid), a polyunsaturated alcohol (Polyol), and a polyunsaturated acid or anhydride. |
| Anchors and Grouts | Anchors and grouts are construction chemicals that stabilize and improve the strength and durability of foundations and structures like buildings, bridges, dams, etc. |
| Cementitious Fixing | Cementitious fixing is a process in which a cement-based grout is pumped under pressure to fill forms, voids, and cracks. It can be used in several settings, including bridges, marine applications, dams, and rock anchors. |
| Commercial Construction | Commercial construction comprises new construction of warehouses, malls, shops, offices, hotels, restaurants, cinemas, theatres, etc. |
| Concrete Admixtures | Concrete admixtures comprise water reducers, air entrainers, retarders, accelerators, superplasticizers, etc., added to concrete before or during mixing to modify its properties. |
| Concrete Protective Coatings | To provide specific protection, such as anti-carbonation or chemical resistance, a film-forming protective coat can be applied on the surface. Depending on the applications, different resins like epoxy, polyurethane, and acrylic can be used for concrete protective coatings. |
| Curing Compounds | Curing compounds are used to cure the surface of concrete structures, including columns, beams, slabs, and others. These curing compounds keep the moisture inside the concrete to give maximum strength and durability. |
| Epoxy | Epoxy is known for its strong adhesive qualities, making it a versatile product in many industries. It resists heat and chemical applications, making it an ideal product for anyone needing a stronghold under pressure. It is widely used in adhesives, electrical and electronics, paints, etc. |
| Fiber Wrapping Systems | Fiber Wrapping Systems are a part of construction repair and rehabilitation chemicals. It involves the strengthening of existing structures by wrapping structural members like beams and columns with glass or carbon fiber sheets. |
| Flooring Resins | Flooring resins are synthetic materials applied to floors to enhance their appearance, increase their resistance to wear and tear or provide protection from chemicals, moisture, and stains. Depending on the desired properties and the specific application, flooring resins are available in distinct types, such as epoxy, polyurethane, and acrylic. |
| High-Range Water Reducer (Super Plasticizer) | High-range water reducers are a type of concrete admixture that provides enhanced and improved properties when added to concrete. These are also called superplasticizers and are used to decrease the water-to-cement ratio in concrete. |
| Hot Melt Adhesives | Hot-melt adhesives are thermoplastic bonding materials applied as melts that achieve a solid state and resultant strength on cooling. They are commonly used for packaging, coatings, sanitary products, and tapes. |
| Industrial and Institutional Construction | Industrial and institutional construction includes new construction of hospitals, schools, manufacturing units, energy and power plants, etc. |
| Infrastructure Construction | Infrastructure construction includes new construction of railways, roads, seaways, airports, bridges, highways, etc. |
| Injection Grouting | The process of injecting grout into open joints, cracks, voids, or honeycombs in concrete or masonry structural members is known as injection grouting. It offers several benefits, such as strengthening a structure and preventing water infiltration. |
| Liquid-Applied Waterproofing Membranes | Liquid-Applied membrane is a monolithic, fully bonded, liquid-based coating suitable for many waterproofing applications. The coating cures to form a rubber-like elastomeric waterproof membrane and may be applied over many substrates, including asphalt, bitumen, and concrete. |
| Micro-concrete Mortars | Micro-concrete mortar is made up of cement, water-based resin, additives, mineral pigments, and polymers and can be applied on both horizontal and vertical surfaces. It can be used to refurbish residential complexes, commercial spaces, etc. |
| Modified Mortars | Modified Mortars include Portland cement and sand along with latex/polymer additives. The additives increase adhesion, strength, and shock resistance while also reducing water absorption. |
| Mold Release Agents | Mold release agents are sprayed or coated on the surface of molds to prevent a substrate from bonding to a molding surface. Several types of mold release agents, including silicone, lubricant, wax, fluorocarbons, and others, are used based on the type of substrates, including metals, steel, wood, rubber, plastic, and others. |
| Polyaspartic | Polyaspartic is a subset of polyurea. Polyaspartic floor coatings are typically two-part systems that consist of a resin and a catalyst to ease the curing process. It offers high durability and can withstand harsh environments. |
| Polyurethane | Polyurethane is a plastic material that exists in various forms. It can be tailored to be either rigid or flexible and is the material of choice for a broad range of end-user applications, such as adhesives, coatings, building insulation, etc. |
| Reactive Adhesives | A reactive adhesive is made of monomers that react in the adhesive curing process and do not evaporate from the film during use. Instead, these volatile components become chemically incorporated into the adhesive. |
| Rebar Protectors | In concrete structures, rebar is one of the important components, and its deterioration due to corrosion is a major issue that affects the safety, durability, and life span of buildings and structures. For this reason, rebar protectors are used to protect against degrading effects, especially in infrastructure and industrial construction. |
| Repair and Rehabilitation Chemicals | Repair and Rehabilitation Chemicals include repair mortars, injection grouting materials, fiber wrapping systems, micro-concrete mortars, etc., used to repair and restore existing buildings and structures. |
| Residential Construction | Residential construction involves constructing new houses or spaces like condominiums, villas, and landed homes. |
| Resin Fixing | The process of using resins like epoxy and polyurethane for grouting applications is called resin fixing. Resin fixing offers several advantages, such as high compressive and tensile strength, negligible shrinkage, and greater chemical resistance compared to cementitious fixing. |
| Retarder | Retarders are admixtures used to slow down the setting time of concrete. These are usually added with a dosage rate of around 0.2% -0.6% by weight of cement. These admixtures slow down hydration or lower the rate at which water penetrates the cement particles by making concrete workable for a long time. |
| Sealants | A sealant is a viscous material that has little or no flow qualities, which causes it to remain on surfaces where they are applied. Sealants can also be thinner, enabling penetration to a certain substance through capillary action. |
| Sheet Waterproofing Membranes | Sheet membrane systems are reliable and durable thermoplastic waterproofing solutions that are used for waterproofing applications even in the most demanding below-ground structures, including those exposed to highly aggressive ground conditions and stress. |
| Shrinkage Reducing Admixture | Shrinkage-reducing admixtures are used to reduce concrete shrinkage, whether from drying or self-desiccation. |
| Silicone | Silicone is a polymer that contains silicon combined with carbon, hydrogen, oxygen, and, in some cases, other elements. It is an inert synthetic compound that comes in various forms, such as oil, rubber, and resin. Due to its heat-resistant properties, it finds applications in sealants, adhesives, lubricants, etc. |
| Solvent-borne Adhesives | Solvent-borne adhesives are mixtures of solvents and thermoplastic or slightly cross-linked polymers such as polychloroprene, polyurethane, acrylic, silicone, and natural and synthetic rubbers. |
| Surface Treatment Chemicals | Surface treatment chemicals are chemicals used to treat concrete surfaces, including roofs, vertical surfaces, and others. They act as curing compounds, demolding agents, rust removers, and others. They are cost-effective and can be used on roadways, pavements, parking lots, and others. |
| Viscosity Modifier | Viscosity Modifiers are concrete admixtures used to change various properties of admixtures, including viscosity, workability, cohesiveness, and others. These are usually added with a dosage of around 0.01% to 0.1% by weight of cement. |
| Water Reducer | Water reducers, also called plasticizers, are a type of admixture used to decrease the water-to-cement ratio in the concrete, thereby increasing the durability and strength of concrete. Various water reducers include refined lignosulfonates, gluconates, hydroxycarboxylic acids, sugar acids, and others. |
| Water-borne Adhesives | Water-borne adhesives use water as a carrier or diluting medium to disperse resin. They are set by allowing the water to evaporate or be absorbed by the substrate. These adhesives are compounded with water as a dilutant rather than a volatile organic solvent. |
| Waterproofing Chemicals | Waterproofing chemicals are designed to protect a surface from the perils of leakage. A waterproofing chemical is a protective coating or primer applied to a structure's roof, retaining walls, or basement. |
| Waterproofing Membranes | Waterproofing membranes are liquid-applied or self-adhering layers of water-tight materials that prevent water from penetrating or damaging a structure when applied to roofs, walls, foundations, basements, bathrooms, and other areas exposed to moisture or water. |


Research Methodology
Mordor Intelligence follows a four-step methodology in all our reports.
- Step-1: Identify Key Variables: The quantifiable key variables (industry and extraneous) pertaining to the specific product segment and country are selected from a group of relevant variables & factors based on desk research & literature review; along with primary expert inputs. These variables are further confirmed through regression modeling (wherever required).
- Step-2: Build a Market Model: In order to build a robust forecasting methodology, the variables and factors identified in Step-1 are tested against available historical market numbers. Through an iterative process, the variables required for market forecast are set and the model is built on the basis of these variables.
- Step-3: Validate and Finalize: In this important step, all market numbers, variables and analyst calls are validated through an extensive network of primary research experts from the market studied. The respondents are selected across levels and functions to generate a holistic picture of the market studied.
- Step-4: Research Outputs: Syndicated Reports, Custom Consulting Assignments, Databases & Subscription Platforms


