
Military Helmet And Helmet Mounted Display Systems Market Size and Share
Market Overview
| Study Period | 2019 - 2031 |
|---|---|
| Market Size (2026) | USD 6.44 Billion |
| Market Size (2031) | USD 8.29 Billion |
| Growth Rate (2026 - 2031) | 5.18 % |
| Fastest Growing Market | Asia Pacific |
| Largest Market | Asia Pacific |
| Market Concentration | Medium |
Major Players *Disclaimer: Major Players sorted in no particular order Image © Mordor Intelligence. Reuse requires attribution under CC BY 4.0. | |
Military Helmet And Helmet Mounted Display Systems Market Analysis by Mordor Intelligence
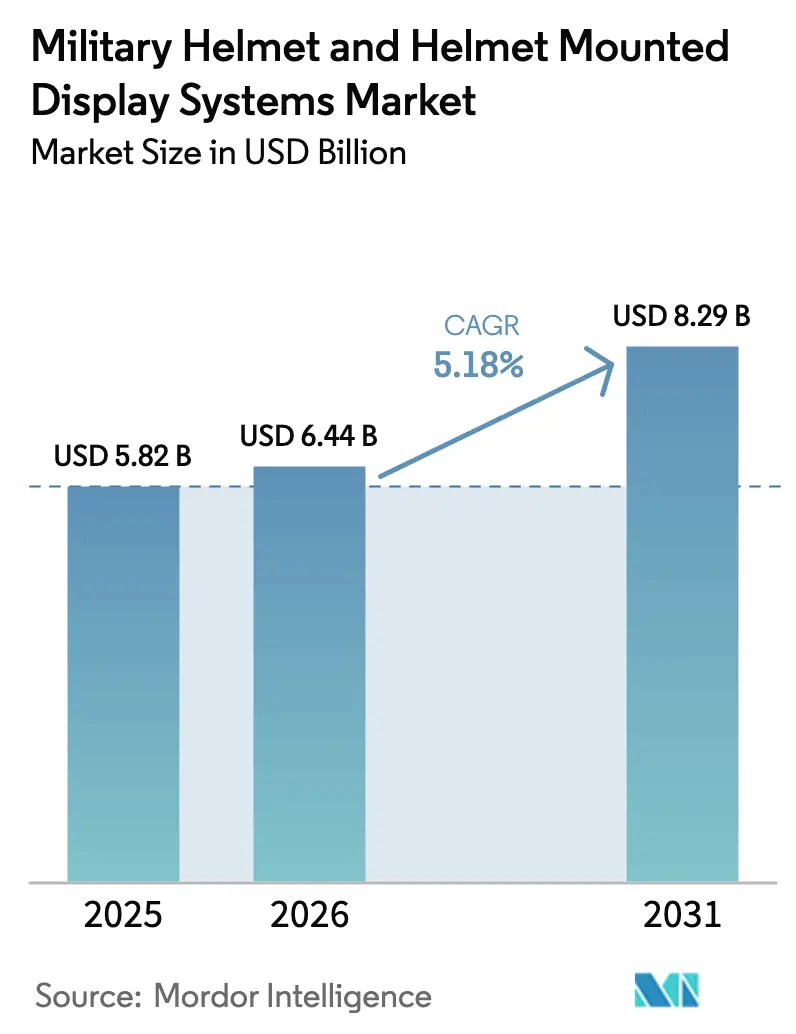
The military helmet and helmet mounted display systems market size is expected to grow from USD 6.18 billion in 2025 to USD 6.44 billion in 2026 and is forecasted to reach USD 7.94 billion by 2031 at a 4.28% CAGR over 2026-2031. Procurement cycles remain multi-year, yet steady funding for soldier-modernization programs, rising adoption of helmet-mounted C4ISR sensors, and incremental advances in lightweight composite shells sustain demand momentum. The United States, India, and China anchor volumes, while special operations users in the Middle East and Asia drive specification upgrades. Vendor strategy is shifting from stand-alone ballistic protection to open-architecture headborne platforms that host displays, communications, and AI-enabled threat detection. Competition is intensifying as electronics specialists partner with prime contractors to offer integrated solutions, thereby shortening the time-to-field for new features and generating recurring revenue streams from software and accessory refreshes.
Key Report Takeaways
- By product type, helmet-mounted displays captured 54.21% of the military helmet and helmet-mounted display systems market share in 2025, and this segment is forecasted to grow at a 4.48% CAGR through 2031.
- By application, combat operations led with 70.05% revenue share in 2025, while surveillance is advancing at a 5.42% CAGR to 2031 as border-security agencies adopt sensor-rich headgear.
- By end user, army units accounted for 57.23% of the 2025 demand; special forces exhibit the fastest expansion at a 5.78% CAGR, owing to the high-value, low-volume procurement of ultra-lightweight solutions.
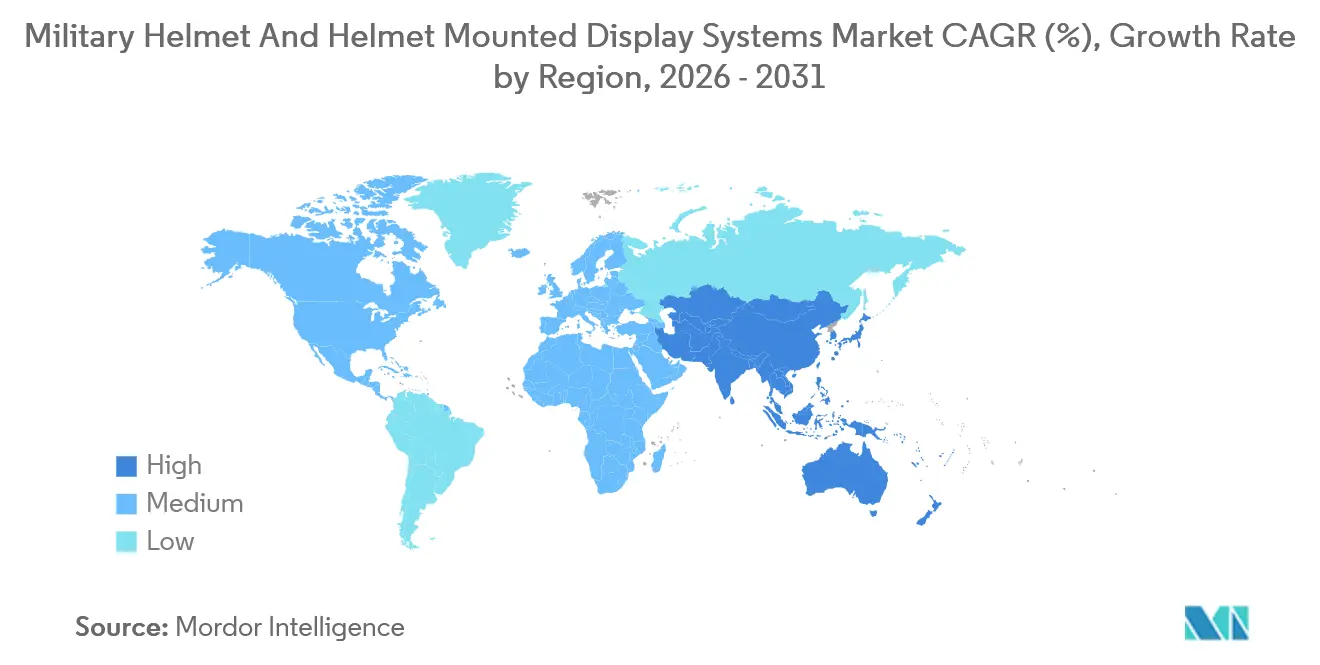
- By geography, Asia-Pacific commanded 41.15% of 2025 revenue and is forecast to post a 4.83% CAGR through 2031 on the back of India’s F-INSAS and sustained Chinese modernization programs.
Note: Market size and forecast figures in this report are generated using Mordor Intelligence’s proprietary estimation framework, updated with the latest available data and insights as of January 2026.
Market Trends and Insights
Drivers Impact Analysis of Military Helmet And Helmet Mounted Display Systems Market*
| Driver | (~) % Impact on CAGR Forecast | Geographic Relevance | Impact Timeline |
|---|---|---|---|
| Expanding soldier modernization programs are driving demand for advanced helmet systems | +1.2% | North America, Europe, Asia-Pacific | Long term (≥ 4 years) |
| Rising cross-border tensions and asymmetric warfare are increasing adoption of enhanced soldier protection | +0.9% | Asia-Pacific, Middle East, Eastern Europe | Medium term (2-4 years) |
| Mandated head injury protection standards are reinforcing procurement of certified military helmets | +0.6% | North America, Europe (NATO) | Short term (≤ 2 years) |
| Integration of C4ISR sensors into soldier systems is accelerating helmet-mounted display adoption | +1.1% | North America, Europe, Asia-Pacific | Medium term (2-4 years) |
| Advancements in AI-enabled threat detection are improving situational awareness through helmet-mounted displays | +0.8% | North America, Japan, South Korea, Australia | Long term (≥ 4 years) |
| Growing demand for lightweight, multi-hit capable composite materials is enhancing helmet performance | +0.7% | Global | Medium term (2-4 years) |
| Source: Mordor Intelligence | |||


Expanding Soldier Modernization Programs Drive Advanced Helmet Procurement
Soldier-modernization programs are channeling unprecedented capital into modular headborne platforms that combine ballistic shells, sensor rails, and AI-ready power architecture. The US Army’s Next Generation Integrated Head Protection System (NG-IHPS) extension signaled multi-year demand visibility. France’s FELIN refresh and India’s F-INSAS mandate compatibility with domestic radios, underscoring the premium placed on open architectures. Vendors able to demonstrate software-defined upgrade paths now rank higher in source selection evaluations, a shift that favors firms investing in digital road maps over purely ballistic innovations.
Cross-Border Tensions and Asymmetric Threats Accelerate Protection Upgrades
Russia’s campaign in Ukraine and simmering disputes in the South China Sea have compressed replacement cycles for infantry helmets. Poland’s 2024 order for 50,000 UHMWPE helmets rated for multi-hit STANAG 2920 performance exemplified urgent regional demand. Urban conflict further pushes militaries to adopt displays that overlay 360-degree camera feeds, as demonstrated by Israel’s Iron Vision deployment in 2024. The operational lesson is clear: survivability now requires both blunt-force protection and real-time situational awareness.
C4ISR Integration Transforms Helmets into Intelligence Nodes
Helmet-mounted displays are transitioning from passive heads-up devices to networked endpoints that ingest feeds from unmanned aircraft, ground sensors, and satellites. Microsoft-built IVAS prototypes streamed 3D terrain and blue-force tracking overlays during US Army field evaluations, illustrating how software capabilities now shape platform value. Turkey’s ASELSAN introduced a 7.5-kilogram pilot helmet that fuses digital night vision with onboard mission computers, proving that weight penalties can be mitigated through integrated electronics design.
AI-Enabled Threat Detection Enhances Situational Awareness
Artificial intelligence is migrating to edge devices mounted on soldier helmets. Anduril’s EagleEye classifies hostile drones and vehicles locally, limiting RF emissions and latency. Kopin’s NeuralDisplay dynamically adjusts brightness and color saturation in real-time to minimize eye strain during prolonged surveillance. While power draw remains a hurdle, OLEDoS technology lowers consumption by 30%, helping reconcile battery life with mission duration.
Restraints Impact Analysis of Military Helmet And Helmet Mounted Display Systems Market*
| Restraint | (~) % Impact on CAGR Forecast | Geographic Relevance | Impact Timeline |
|---|---|---|---|
| Defense budget reallocations toward cyber and unmanned systems are constraining helmet procurement | -0.8% | North America, Europe | Medium term (2-4 years) |
| Lengthy testing and qualification cycles are delaying field deployment timelines | -0.6% | Global (notably North America) | Short term (≤ 2 years) |
| Power supply and energy management limitations are restricting on-helmet electronics capability | -0.5% | Global | Long term (≥ 4 years) |
| Electromagnetic emission and signature exposure risks are raising operational survivability concerns | -0.4% | Eastern Europe, Asia-Pacific hotspots | Medium term (2-4 years) |
| Source: Mordor Intelligence | |||
Defense Budget Reallocations Compress Soldier-Equipment Spending
Competing priorities in cyber defense, space, and autonomy trim near-term headgear allocations. The US FY 2025 budget allocated 18% of the total to cyber and space RDT&E, potentially crowding out incremental equipment upgrades.[1]Bloomberg Government, “U.S. FY 2025 Defense Budget Analysis,” Bloomberg Government, bgov.comEuropean planners rechanneled fresh funds into missile defense and ammunition, delaying several infantry programs. Vendors now frame proposals around network-centric effects or lifecycle cost savings to retain funding.
Testing and Qualification Cycles Delay Deployment and Revenue Recognition
Stringent ballistic, environmental, and human-factors testing extends certification timelines. NIJ 0106.01 and NATO STANAG 2920 protocols typically run 18-24 months, during which vendors carry inventory and sustain engineering resources without revenue. IVAS schedule slippage into 2026 highlighted exposure to delayed cash flows. Capital-constrained newcomers struggle to bridge these gaps, amplifying market entry barriers.
*Our forecasts treat driver/restraint impacts as directional, not additive. The impact forecasts reflect baseline growth, mix effects, and variable interactions.
Military Helmet And Helmet Mounted Display Systems Market Segment Analysis
By Product Type:
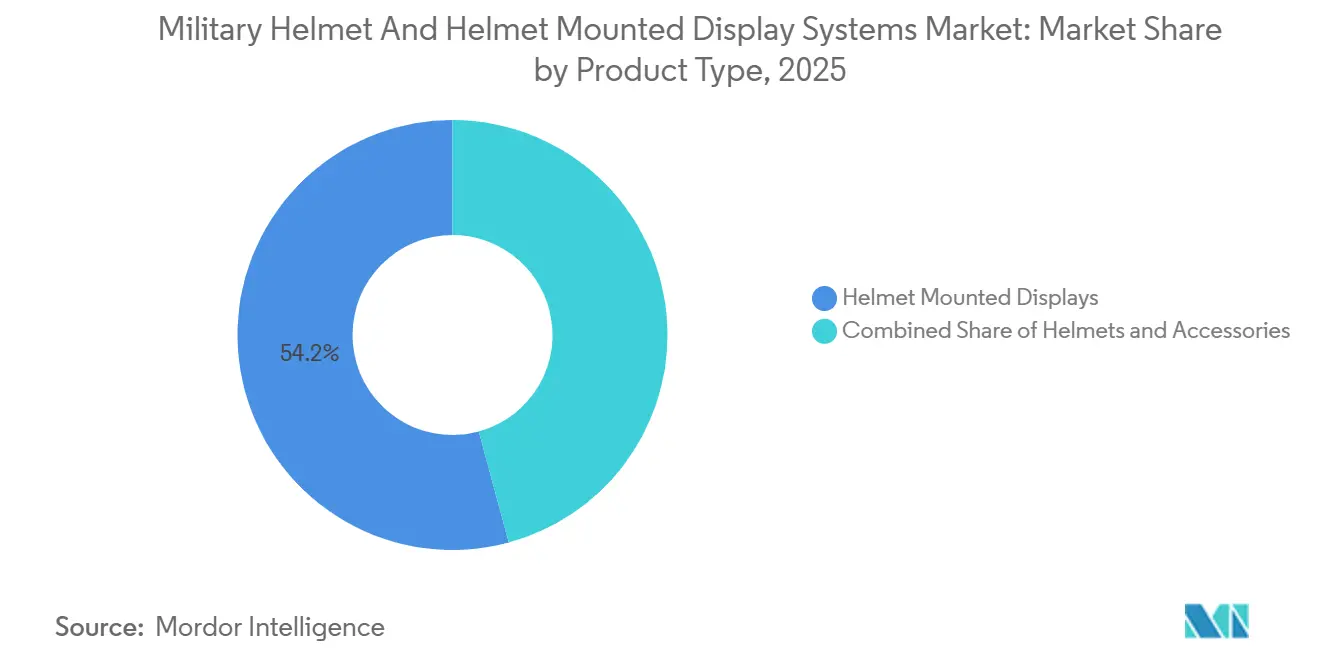
Displays Gain PrimacyHelmet-mounted displays accounted for 54.21% of the military helmet and helmet-mounted display systems market in 2025 and are expected to expand at a faster rate, with a 4.48% CAGR, through 2031. The military helmet and helmet-mounted display systems market size for displays is forecast to grow further as F-35 Lot 17 production and IVAS infantry rollouts overlap.[2]Collins Aerospace, “F-35 Gen III Helmet Lot 17 Award,” Collins Aerospace, collinsaerospace.com Ground forces deploy waveguide optics that deliver AR overlays previously limited to pilots. In parallel, shells evolve slowly, driven mainly by improvements in composite materials rather than new designs, resulting in longer replacement cycles.
The accessory segment generates recurring revenue from retrofit kits but remains smaller in absolute terms. The integration of OLEDoS microdisplays reduces display power draw by 30%, thereby shrinking battery packs and mitigating neck-load trade-offs. Vendors offering vertically integrated solutions across shell, display, and power domains position themselves for multi-year platform contracts.


By Application:
Surveillance Rises on Border Security DemandCombat operations dominated revenue, accounting for a 70.05% share in 2025, while surveillance was the fastest-growing application, growing at a 5.42% CAGR. Surveillance incorporates helmet-mounted displays that stream thermal imagery and AI-assisted facial recognition to border patrols and counter-narcotics teams. The military helmet and helmet-mounted display systems market size for surveillance missions is expected to expand as procurement shifts from ad-hoc pilots to program-of-record funding lines.
Training and search-and-rescue remain niche but valuable, leveraging the same sensor suites for simulation feedback and wildfire response. Suppliers able to certify dual-use configurations under standards such as NFPA 1977 can unlock civilian volumes, thereby smoothing the variability in defense budgets.
By End User:
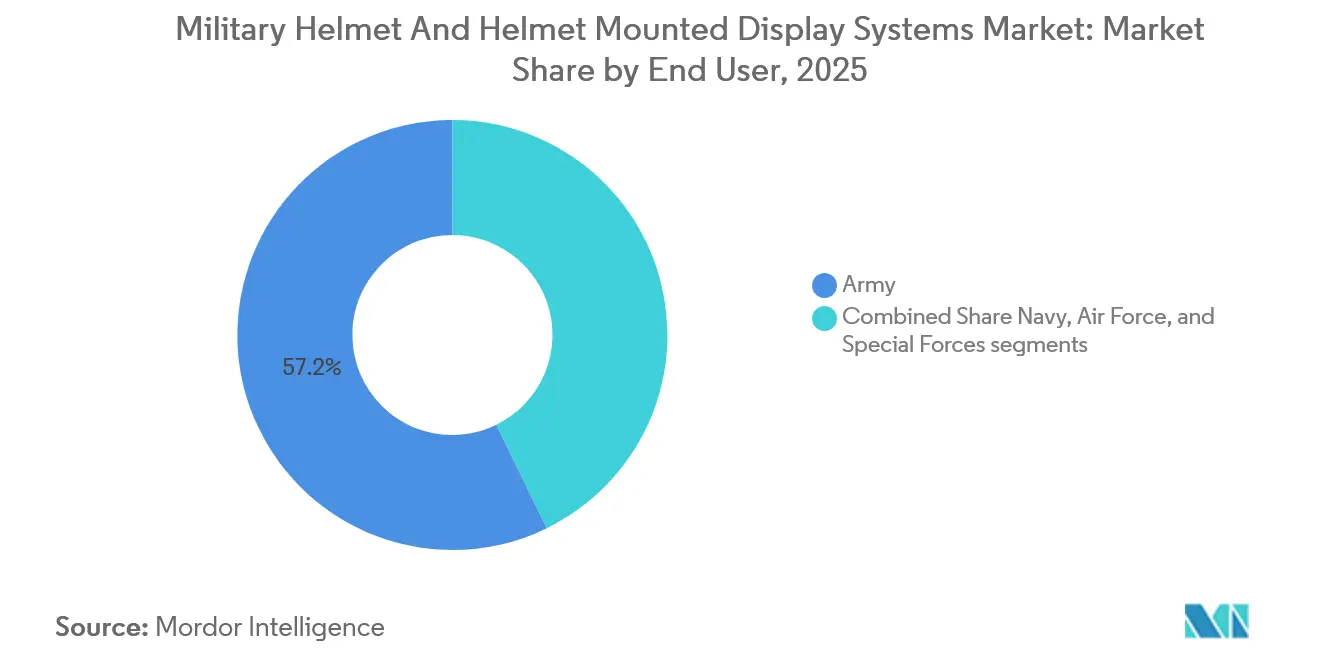
Special Forces Propel Premium FeaturesArmy organizations held a 57.23% share in 2025, reflecting large installed bases, whereas special-operations units grew at a 5.78% CAGR through 2031. The military helmet and helmet-mounted display systems market share for special operations units is underpinned by shorter replacement intervals and willingness to pay for carbon-fiber shells or 3D-printed padding. Navy and Air Force usage patterns are closely tied to aviation procurement, particularly with the F/A-18 and F-35 helmet systems.
Early adoption by special forces helps amortize the cost of R&D on AI processors and advanced optics, which later migrate into larger army contracts. Vendors without access to these elite channels face more extended payback periods for innovation spending.
Geography Analysis
APAC Military Helmet and Helmet Mounted Display Systems Market
Asia-Pacific generated 41.15% of 2025 revenue and is forecast to lead growth at a 4.83% CAGR. India’s Atmanirbhar Bharat policy funnels volume to domestic supplier MKU, while China funds indigenous programs shielded from Western export controls.[3]MKU Limited, “Global Helmet Contracts,” MKU Limited, mku.com Japan and South Korea integrate helmet displays into next-generation fighter and infantry systems to maintain interoperability with US forces.
North America Military Helmet and Helmet Mounted Display Systems Market
North America remains the second-largest market as the US Army, Marine Corps, and Air Force field NG-IHPS, Integrated Head System, and F-35 HMDS upgrades. Canada’s DICE program selected Galvion for headborne protection, resulting in extended regional production runs.
EMEA and South America Military Helmet and Helmet Mounted Display Systems Market
Europe’s outlook is mixed: higher collective defense spending following the Ukraine crisis favors programs in Poland, Germany, and the UK, yet fragmented national budgets slow the continent-wide scale. The Middle East accelerates purchases of modular helmets and displays tailored for desert and urban operations; Galvion’s 35,000-unit order from an undisclosed customer illustrates the region’s appetite for rapid deliveries. Africa and South America remain in the early stages but could unlock long-term upside as local assembly projects mature.

Regulatory Landscape
Military helmets and helmet-mounted display systems are governed by overlapping ballistic, non-ballistic, and environmental qualification regimes that shape procurements and time-to-field. In the United States, solicitations and qualification commonly reference MIL-STD-662F for V50 ballistic-limit methodologies and MIL-STD-810H for environmental stress testing, alongside Army-specific requirements such as AR/PD 14-01C for Advanced Combat Helmet (ACH) performance and reporting.
For NATO-aligned procurements, qualification typically combines fragmentation and ballistic verification with non-ballistic criteria. NATO STANAG 2920 is used widely for fragmentation protection benchmarks, while STANAG 2902/AEP-2902 is applied for non-ballistic test methods and evaluation criteria. NATO Support and Procurement Agency (NSPA) tenders also embed quality and assurance requirements, including ISO 9001 and AQAP 2110/2105, which pushes suppliers to maintain auditable manufacturing controls alongside test-lab certification artifacts.
Value Chain Analysis
The value chain starts with upstream materials and electronics inputs, including aramid/UHMWPE composites and emerging metallic solutions for shells, plus microdisplays, waveguides/optics, sensors, and power-management components for helmet-mounted displays. Midstream, specialist component suppliers feed prime integrators that assemble and qualify complete headborne systems, including suspension and impact-attenuation hardware, communications interfaces, and mounting assemblies that connect helmets to night-vision and augmented-reality devices.
Downstream, government demand is executed largely through framework and IDIQ mechanisms and platform-program contracts. Integrators are responsible for qualification, configuration control, and lifecycle support. Recent awards illustrate the chain dynamics across air and ground segments: the U.S. Navy awarded Collins Elbit Vision Systems a USD 585 million contract for F-35 Lot 18 and 19 helmet-mounted display systems, while U.S. Army and Defense Logistics Agency delivery orders under NG-IHPS supported volume combat-helmet runs through Team Wendy Ceradyne. Contract structures in rotary-wing aviation, for example Gentex HGU-56/P awards, and production ramp announcements by shell suppliers such as ArmorSource show how capacity, certification lead times, and long-term support packages influence which firms capture repeat orders.
Competitive Landscape
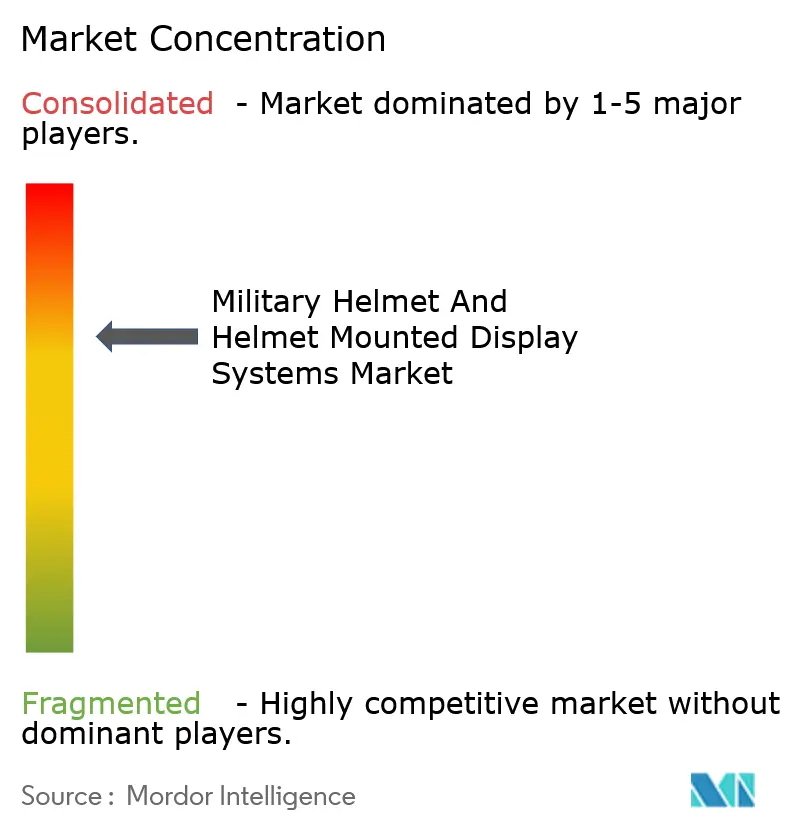
The top five vendors control a prominent share of global revenue, signaling moderate concentration. Avon Technologies plc, BAE Systems plc, and Thales Group leverage decades of customer intimacy and proven certification pathways. Yet challengers such as Galvion Ltd and Anduril gain share by delivering open-architecture designs and AI-rich features that incumbents integrate more slowly.[4]Defense News, “Galvion Wins $131 Million USMC Contract,” Defense News, defensenews.com
Joint ventures also shape the field: Collins Aerospace and Elbit Systems, through CEVS, secured F-35 helmet supply through 2030, bundling display optics with aircraft systems to lock customers into long-term sustainment. Regional specialists, such as MKU and ASELSAN, capture sovereign contracts through localized manufacturing, often trading margin for scale and a strategic footprint.
The technology race lines focus on three vectors: power-efficient microdisplays, AI-enabled threat detection, and ultra-lightweight composite shells. Firms that command intellectual property in two or more domains tend to outcompete component-only suppliers, making mergers and vertical integration likely over the next five years.
Military Helmet And Helmet Mounted Display Systems Industry Leaders
RTX Corporation
BAE Systems plc
Honeywell International Inc.
Avon Technologies plc
Thales Group
- *Disclaimer: Major Players sorted in no particular order
Military Helmet And Helmet Mounted Display Systems Market Companies Covered in this Report
- Avon Technologies plc
- BAE Systems plc
- Gentex Corporation
- L3Harris Technologies, Inc.
- Thales Group
- Safran SA
- Rheinmetall AG
- Honeywell International Inc.
- Elbit Systems Ltd.
- MKU Limited
- Galvion Ltd
- NP Aerospace Limited
- ULBRICHTS GmbH
- ArmorSource LLC
- ASELSAN A.Ş.

Market Opportunities and Future Outlook
An opportunity is the shift toward modular, open-architecture headborne platforms that separate ballistic protection from rapidly refreshed electronics. This approach allows upgrades to displays, sensors, and mounts without replacing the full helmet. The U.S. Army decision in July 2026 to place around 10,000 IVAS v1.0 and v1.1 units into storage highlights demand for improved reliability, weight, and low-light performance, and it creates space for integrators to field lighter, more power-efficient helmet-mounted systems and accessories aligned to revised fielding approaches.
A second opportunity is in aviation HMD modernization and retrofit cycles, where program milestones and production contracts create a direct pull for next-generation optics and microdisplays. Collins Elbit Vision Systems completing the Zero-G HMDS+ Critical Design Review for the U.S. Navy, alongside its USD 585 million F-35 helmet award, points to continued demand for certified, high-definition cueing and display hardware across combat-air fleets. On the component side, Kopin receiving production and microdisplay orders for rotary-wing HMD programs indicates demand for custom display engines that can reduce power draw and improve brightness and eye-box performance, which also feeds into ground-force HMD requirements where battery mass and neck load remain procurement constraints.
Recent Industry Developments in Military Helmet And Helmet Mounted Display Systems Market
- June 2026: Avon Technologies subsidiary Team Wendy Ceradyne received delivery orders totaling over USD 40 million from the U.S. Army and Defense Logistics Agency under the Next Generation Integrated Head Protection System (NG-IHPS) contract. The orders reinforce NG-IHPS as a volume driver for certified combat-helmet procurement and sustainment, supporting suppliers with qualified production capacity and integration-ready helmet architectures.
- December 2025: Collins Elbit Vision Systems (a Collins Aerospace and Elbit Systems of America joint venture) completed the Critical Design Review for the Zero-G Helmet Mounted Display System+ for the U.S. Navy. Advancing beyond a major design gate reduces technical and schedule risk for follow-on production and strengthens the supplier position in next-generation cueing and display upgrades.
- December 2024: BAE Systems secured a GBP 133 million contract from the Eurofighter consortium to advance development of the Striker II Helmet Mounted Display, including a flight-testing program. The award funds the transition from development into extensive verification, anchoring near-term demand for advanced optics, symbology, and integration work across the Eurofighter user base.


Military Helmet And Helmet Mounted Display Systems Market Report Scope and Research Methodology
Market Definition and Coverage
This market covers the revenue generated from military helmets and helmet mounted display systems that are procured for defense users, including integrated and add-on helmet accessories that support protection, communications, and situational awareness.
Scope exclusions: We exclude non-military end users, general industrial head protection, and consumer AR/VR headsets that are not procured for defense missions.
Segments Covered in This Report
- By Product Type
- Helmets
- Helmet Mounted Displays
- Accessories
- By Application
- Combat Operations
- Training Exercises
- Search and Rescue
- Surveillance
- By End User
- Army
- Navy
- Air Force
- Special Forces
- By Geography
- North America
- United States
- Canada
- Mexico
- South America
- Brazil
- Rest of South America
- Europe
- United Kingdom
- France
- Germany
- Spain
- Russia
- Rest of Europe
- Asia-Pacific
- China
- India
- Japan
- South Korea
- Rest of Asia-Pacific
- Middle East and Africa
- Middle East
- United Arab Emirates
- Saudi Arabia
- Israel
- Rest of Middle East
- Africa
- South Africa
- Rest of Africa
- Middle East
- North America
Data Sources, Market Sizing, and Validation
Desk Research
For desk research, we first built a clean map of demand drivers and procurement cycles so the model reflects defense buying behavior rather than short retail-like swings. We used public sources, including SIPRI military expenditure data, NATO defense spending releases, World Bank macro indicators, UN Comtrade trade statistics for relevant protective gear categories, and US DoD budget documents and justification books, to ground country priorities and spending capacity.
Next, we used supplier-side disclosures such as annual reports, investor presentations, press releases, and contract award notices to understand program timing and typical delivery quantities. Where needed, paid subscriptions focused on company financials and intelligence, patent databases, and defense contracts and tenders were used to cross-check product positioning and procurement signals. These examples are not exhaustive, and additional public and paid sources were reviewed for data collection, validation, and clarification.
Primary Interviews and Surveys
Primary interviews and surveys were used to convert broad procurement signals into workable assumptions, especially for helmet replacement frequency, how many display-capable helmets are fielded per unit, and how pricing changes when sensors, visors, and connectivity modules are added. We spoke with a balanced mix of program-level stakeholders, engineering and integration roles, and channel-facing contacts across major defense buying regions so gaps from public data could be closed and key assumptions could be rechecked before finalizing totals.
Distribution of primary research fieldwork respondents
| Company type | Respondent position | Region |
|---|---|---|
| Top tier: 32% | CXOs: 15% | APAC: 46% |
| Mid tier: 50% | Functional/Unit leaders: 39% | EMEA: 31% |
| Smaller Players: 18% | Managers: 46% | Americas: 23% |
Market-Sizing & Forecasting
Sizing started with a top-down build where defense budget signals and soldier modernization allocations were translated into an addressable spend pool for headborne protection and display capability by region. To keep the totals realistic, we checked the results against selective bottom-up approximations, such as sampled unit pricing multiplied by likely delivery volumes from major programs, followed by channel checks on what portion of fleets are upgraded versus newly issued.
Key inputs that shaped the model included active procurement and replacement cycles for helmets, penetration of helmet mounted display systems in aircrew and dismounted roles, average selling price ranges by configuration (basic helmet versus integrated display and accessory kits), modernization program cadence, and import and production patterns where local manufacturing is common. Forecasts were built using scenario analysis supported by expert views on budget continuity, platform upgrades, and integration readiness, and assumptions were adjusted when programs showed delays, re-scopes, or shifting priorities. When country-level data was thin, proxy indicators like defense manpower, deployment intensity, and recent contract announcements were used, and then normalized through regional validation.
Data Validation & Update Cycle
Outputs were validated through multiple cross-checks so one data series could not over-influence the final number. We compared results against independent signals, such as defense spending direction, modernization line items, and procurement award patterns, and then reviewed variances that looked too high or too low for the country context.
Before sign-off, the model and assumptions go through step-by-step analyst reviews, and follow-up outreach is triggered when interview feedback conflicts with what public sources imply. The report is refreshed annually, and interim updates are made when major events occur, such as large multi-country awards or changes in procurement rules. Right before publication, a final sweep is completed so clients receive the most current view possible.
Mordor Intelligence's Military Helmet and Helmet Mounted Display Systems Market Size Versus Other Published Estimates
Published market sizes for this space often do not match because each publisher draws the line differently on what counts as a helmet system, and because defense procurement data is not always disclosed in a consistent way. Differences also show up when one estimate is built from program-level demand signals and another leans more on supplier-side reporting or a narrower product definition.
The biggest gap drivers usually come from scope and counting logic, such as whether accessories like visors, sights, EO-IR add-ons, and connectivity modules are included, and whether training and search-and-rescue use cases are counted alongside combat demand. Variations also occur when pricing is held flat versus stepped up for integrated configurations, when currency conversion timing differs, and when forecasts assume conservative budget rollovers versus faster modernization ramps.
Benchmark comparison
| Source | Market Size | Gaps in Research Methodology |
|---|---|---|
| Mordor Intelligence | USD 6.44 B (2026) | |
| Industry Research Firm A | USD 5.94 B (2025) | Uses a different base year and may apply a tighter definition around core helmet and display systems, with less explicit treatment of attachable accessories and program timing effects that shift revenue between years. |
| Industry Research Firm B | USD 4.58 B (2025) | Focuses on helmet-mounted displays rather than the combined helmet plus HMDS ecosystem, which can exclude protective helmet value and accessory kits, thereby lowering the stated total. |
The spread mostly comes from what is counted and when it is counted, especially around accessory revenue and whether the scope is HMDS-only or the full helmet ecosystem. By separating stand-alone display revenue from helmets and add-on modules and then aligning totals to modernization procurement cadence, the estimate stays traceable to clear variables, a modeling choice applied by Mordor Intelligence.


Key Questions Answered in the Report
What is the current value of the military helmet and helmet mounted display systems market?
The market stands at USD 6.44 billion in 2026 and is forecast to reach USD 8.29 billion by 2031.
Which product segment is growing fastest?
Helmet mounted displays lead growth with a 4.48% CAGR through 2031.
Why are Asia-Pacific armies investing heavily in new helmets?
Regional tensions and programs such as India’s F-INSAS are pushing Asia-Pacific spending, giving the region 41.15% of 2025 revenue.
How do power constraints impact helmet mounted displays?
New OLEDoS microdisplays cut power draw by 30%, easing battery weight and extending mission duration.
Which companies dominate US military orders?
Gentex Corporation, RTX Corporation, Avon Technologies plc, Honeywell International Inc. and L3Harris Technologies, Inc. secure most large US contracts, including NG-IHPS, F-35 HMDS, and Integrated Head System awards.
Page last updated on:


 Your data is secure and never sold or shared.


