Wearable Devices In Sports Market Size and Share
Market Overview
| Study Period | 2020 - 2031 |
|---|---|
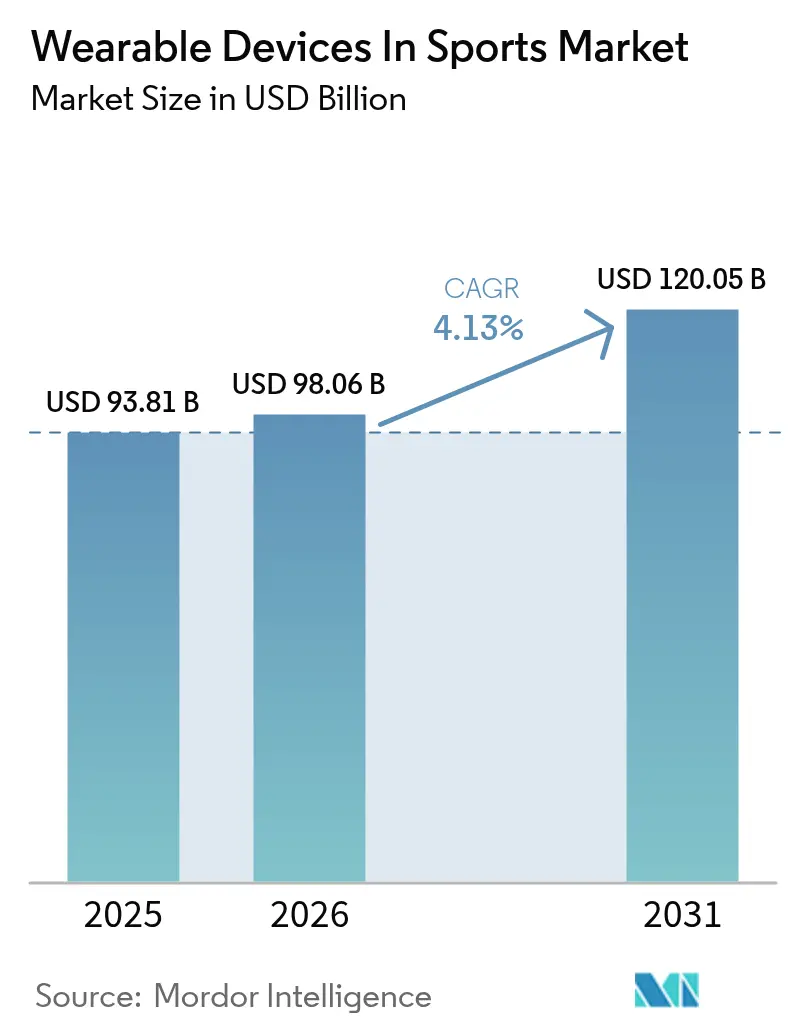
| Market Size (2026) | USD 98.06 Billion |
| Market Size (2031) | USD 120.05 Billion |
| Growth Rate (2026 - 2031) | 4.13% CAGR |
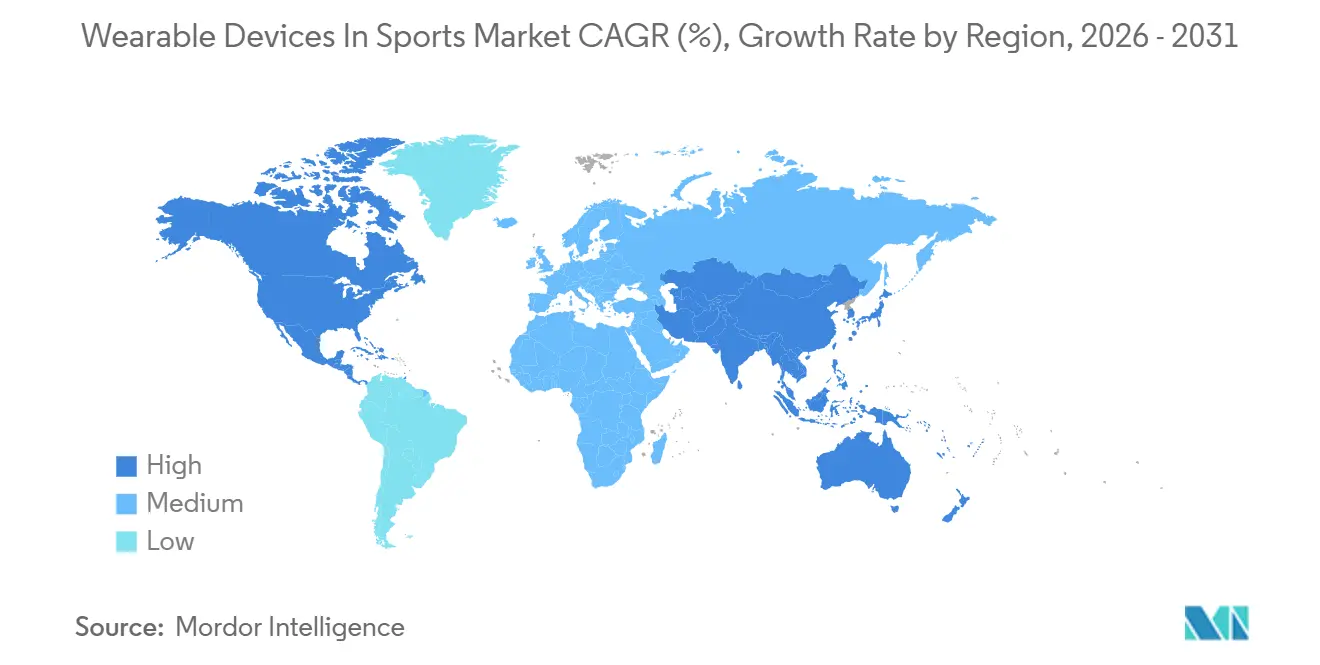
| Fastest Growing Market | Asia Pacific |
| Largest Market | North America |
| Market Concentration | Medium |
Major Players*Disclaimer: Major Players sorted in no particular order Image © Mordor Intelligence. Reuse requires attribution under CC BY 4.0. | |
Wearable Devices In Sports Market Analysis by Mordor Intelligence
The wearable devices in sports market size is expected to increase from USD 93.81 billion in 2025 to USD 98.06 billion in 2026 and reach USD 120.05 billion by 2031, growing at a CAGR of 4.13% over 2026-2031. Professional leagues now embed biometric tracking in collective-bargaining agreements, while recreational users adopt AI-driven coaching that assigns real-time injury-risk scores. Sony’s 2025 purchase of STATSports exemplifies a shift toward platform consolidation that marries sensor hardware with cloud analytics. Textile-integrated sensors that capture kinetic, thermal, and electrophysiological signals without restricting movement move the category beyond wristbands, supporting demand for garments that feel like ordinary sportswear.[1]National Basketball Association, “NBA Launches League-Wide Biomechanics Program,” NBA Official Website, nba.com North American dominance rests on National Football League and Major League Baseball mandates for head-impact and pitch-biomechanics monitoring, yet Asia-Pacific posts faster growth as Indian cricket and Chinese academy programs institutionalize GPS tracking. Headline risks center on new data-privacy clauses in collective-bargaining agreements that restrict third-party sales of biometric data and slow product rollouts.
Key Report Takeaways
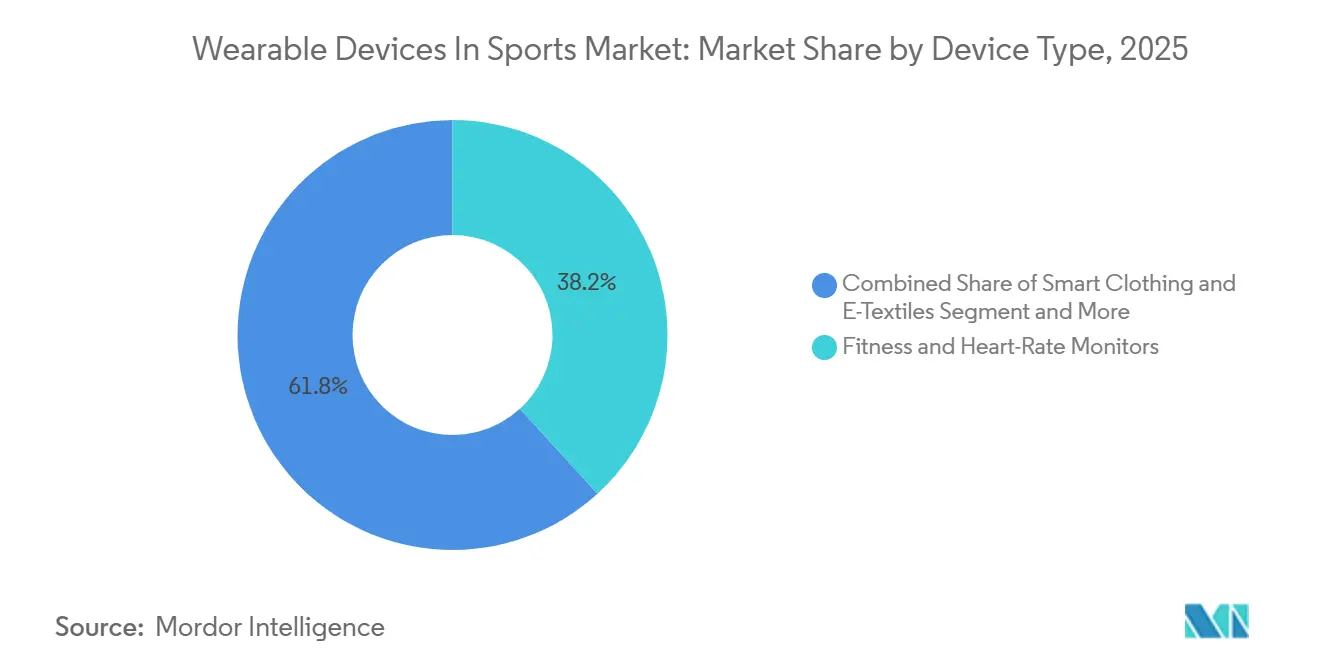
- By device type, fitness and heart-rate monitors held 38.21% of wearable devices in sports market share in 2025, while smart clothing and e-textiles are advancing at a 6.93% CAGR through 2031.
- By sport, soccer and football captured 26.43% of 2025 revenue, whereas swimming and aquatics are forecast to expand at a 7.01% CAGR to 2031.
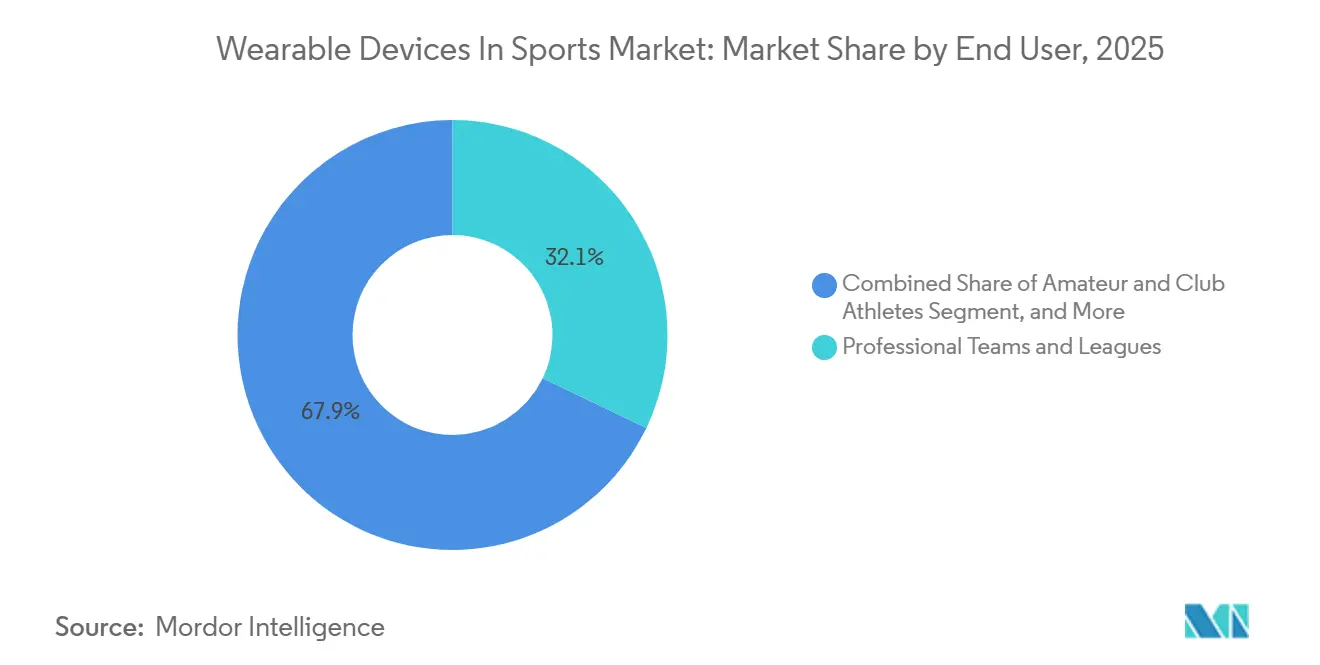
- By end user, professional teams and leagues accounted for 32.11% of spending in 2025, and medical and rehabilitation facilities lead growth at a 5.23% CAGR.
- By distribution channel, online sales controlled 46.87% of 2025 value and are projected to grow at a 5.62% CAGR during 2026-2031.
- By geography, North America controlled 41.72% of 2025 value and are projected to grow at a 4.98% CAGR during 2026-2031.
Note: Market size and forecast figures in this report are generated using Mordor Intelligence’s proprietary estimation framework, updated with the latest available data and insights as of 2026.
Global Wearable Devices In Sports Market Trends and Insights
Drivers Impact Analysis*
| Driver | (~) % Impact on CAGR Forecast | Geographic Relevance | Impact Timeline |
|---|---|---|---|
| Growing demand for data-driven performance analytics | +1.2% | Global, strong in North America and Europe | Medium term (2-4 years) |
| Rising integration of AI-powered multi-sensor wearables | +1.4% | Global, led by North America, Asia-Pacific emerging | Medium term (2-4 years) |
| Expansion of global sports events and fan-engagement platforms | +0.7% | Europe, Middle East, Asia-Pacific | Long term (≥ 4 years) |
| Portable and convenient form factors boosting daily adoption | +0.9% | North America and Asia-Pacific | Short term (≤ 2 years) |
| League-sanctioned biometric-data monetization frameworks | +0.6% | North America, Europe | Medium term (2-4 years) |
| Textile-integrated multimodal sensors for injury prevention | +1.0% | Europe and North America | Long term (≥ 4 years) |
| Source: Mordor Intelligence | |||
Growing Demand for Data-Driven Performance Analytics
Teams now treat biometric metrics as contractual deliverables, embedding recovery scores in player-availability clauses. The Association of Tennis Professionals approved in-competition wearables in 2024, allowing real-time coaching adjustments that rely on exertion thresholds and court-coverage heat maps.[2]Association of Tennis Professionals, “ATP Approves In-Competition Wearables,” atptour.com Collegiate recruiters request multi-year datasets from prospects, creating a secondary market for longitudinal performance archives. The National Football League Players Association opened a centralized repository in 2024 so athletes can license anonymized data to researchers while retaining veto rights over commercial use. Insurers also price injury risk off historical wearable trends, further embedding analytics in contract negotiations. This institutionalization transforms wearables from optional gadgets into required infrastructure.
Rising Integration of AI-Powered Multi-Sensor Wearables
Modern devices fuse inertial measurement units, photoplethysmography, bioimpedance, and multi-band GNSS into single form factors. Samsung’s Galaxy Watch7, released in February 2026, houses on-device neural networks that classify workout intensity without cloud latency, mitigating data-leakage fears during live competition.[3]Samsung Electronics, “Galaxy Watch7 and Watch Ultra Launch,” samsung.com Garmin’s HRM-600 chest strap pairs ECG-grade heart monitoring with running-dynamics pods that track ground-contact time for endurance athletes demanding clinical-level precision. Kinexon’s EuroLeague deployment uses ultra-wideband anchors to triangulate player positions within 10 cm, feeding fatigue indices directly to bench coaches.[4]Kinexon, “Partnership With EuroLeague Basketball,” kinexon.com Edge processing lowers dependence on post-session analysis, enabling in-game tactical pivots once confined to halftime.
Expansion of Global Sports Events and Fan-Engagement Platforms
Broadcasters overlay sprint speeds and heart rates onto live feeds, selling premium second-screen subscriptions that gamify athlete data. FIFA’s 2024 approval of PlayerMaker in-shoe sensors lets fans compare their kick velocity with professionals through mobile apps . The British and Irish Lions streamed player workload data during the 2025 tour, generating new sponsorship revenue from analytics overlays. Middle Eastern stadium projects integrate wearable telemetry with augmented-reality displays, positioning the region as a test bed for immersive fan experiences. Monetization now extends beyond athlete performance into data-driven storytelling that fuels betting odds and fantasy-sports engagement.
Portable and Convenient Form Factors Boosting Daily Adoption
Miniaturized power circuits and flexible boards enable adhesive patches, compression garments, and smart insoles that remove the friction of strapping on extra devices. Apple previewed Watch Series 12 features that promise multi-day battery life and swim-proof casings, erasing charging anxiety for triathletes. FORM’s Smart Swim 2 goggles project lap splits onto the lens, solving swimming’s feedback problem without disrupting stroke rhythm. Nix Biosensors’ single-use sweat patch reports electrolyte levels, ending blood-lactate finger pricks during ultramarathons. These always-on designs reduce the cognitive load of manual tracking, accelerating adoption in recreational cohorts.
Restraints Impact Analysis*
| Restraint | (~) % Impact on CAGR Forecast | Geographic Relevance | Impact Timeline |
|---|---|---|---|
| High initial device cost and tight athletics budgets | -0.8% | Global, acute in collegiate programs and emerging markets | Short term (≤ 2 years) |
| Escalating consumer data-privacy and security concerns | -1.1% | North America, Europe, Asia-Pacific emerging | Medium term (2-4 years) |
| Interoperability gaps across vendor data ecosystems | -0.6% | Global, fragmented in North America | Medium term (2-4 years) |
| Collective-bargaining limits on biometric data use | -0.5% | North America, Europe | Long term (≥ 4 years) |
| Source: Mordor Intelligence | |||
High Initial Device Cost and Tight Athletics Budgets
Enterprise-grade kits from Catapult or STATSports cost more than USD 50,000 per team, with annual software fees of USD 10,000–30,000, squeezing Division II and III college programs. Recreational athletes balk at USD 300-500 devices bundled with ongoing subscriptions when free smartphone apps deliver basic tracking. This bifurcation creates premium professional tiers and commoditized consumer segments, limiting cross-subsidization that could fund feature innovation.
Escalating Consumer Data-Privacy and Security Concerns
Athletes fear menstrual-cycle or glucose data could influence contract terms. GDPR demands purpose-specific consent, yet some European clubs still rely on blanket waivers signed under duress. NBA, NFL, MLB, NHL, and MLS agreements now establish joint governance committees that vet third-party data requests, delaying integrations and deterring startups. WHOOP’s 2025 study with Monash University sparked debate on whether aggregated menstrual data might reinforce gender bias. Compliance complexity diverts R&D budgets toward legal processes.
*Our forecasts treat driver/restraint impacts as directional, not additive. The impact forecasts reflect baseline growth, mix effects, and variable interactions.
Segment Analysis
By Device Type: E-Textiles Challenge Monitor Incumbency
In 2025, fitness and heart-rate monitors commanded 38.21% of wearable devices in sports market share, reflecting entrenched adoption among recreational runners and cyclists. Smart clothing and e-textiles are projected to grow at a 6.93% CAGR, outpacing the overall wearable devices in sports market size growth as athletes shift toward garments that eliminate the need to remember separate gadgets. Garmin’s Forerunner 970, launched in May 2025, uses multi-band GNSS to retain accuracy in dense urban terrain. FORM’s Smart Swim 2 goggles, released in August 2024, overlay live metrics onto transparent displays, removing the cognitive disruption of mid-stroke wrist checks.
Footwear sensors gained traction after PlayerMaker’s Bundesliga partnership, measuring ball-contact quality that was once laboratory-bound. Head-mounted augmented-reality displays, such as Garmin’s Xero L60i introduced in January 2026, project golf yardage onto eyewear lenses, hinting at wider acceptance of heads-up interfaces. Ingestible sensors like the FDA-cleared e-Celsius capsule track core temperature for NFL teams but face cost and athlete-acceptance barriers. Graphene-infused fabrics promise machine-washable conductivity, potentially rendering rigid sensor housings obsolete during the forecast horizon


By Sport: Aquatics Outpace Traditional Team Sports
Soccer and football held 26.43% of 2025 revenue as European clubs normalized GPS tracking for positional play optimization. Swimming and aquatics, however, will surpass overall wearable devices in sports market size growth, posting a 7.01% CAGR through 2031. Prevent Biometrics’ mouthguard logs American-football head impacts to document concussion exposure for liability mitigation. Baseball leverages Motus Global’s mThrow 2.0 elbow sleeve to monitor ulnar-collateral-ligament stress in pitchers.
Cricket adoption accelerated after ICC approvals, with India’s national team deploying Catapult units for bowler workload management. Cycling and triathlon athletes demand devices that transition through swim, bike, and run modes, a gap Garmin filled with the Forerunner 570. Extreme-sports participants value ruggedness and multi-day battery life, met by Apple’s Watch Ultra 3 rated for 36-hour runtime and 40-m depth. The aquatics surge underscores a wider pivot toward discipline-specific solutions over generic trackers.
By End User: Medical Facilities Pursue Clinical Integration
Professional teams and leagues represented 32.11% of 2025 spend after NBA’s league-wide biomechanics rollout. Medical and rehabilitation facilities, though smaller today, are growing fastest at 5.23% CAGR, pursuing regulatory clearances that integrate objective mobility metrics into post-surgical protocols. Collegiate programs split budgets, equipping football and basketball with enterprise kits while Olympic sports rely on consumer devices. Recreational enthusiasts gravitate toward smartwatch aesthetics, a priority Samsung met with Galaxy Watch Ultra’s fashion-forward build.
Sports academies use wearable data as a premium coaching differentiator, bundling analytics into tuition. Device makers target Food and Drug Administration 510(k) approvals to unlock insurance-reimbursable hospital budgets, steering design toward HIPAA-grade encryption. These trajectories suggest long-term convergence between wellness and clinical categories, reshaping end-user hierarchies inside the wearable devices in sports market.
By Distribution Channel: Direct Relationships Displace Retail
Online platforms held 46.87% share in 2025 and will post a 5.62% CAGR, capitalizing on the subscription economics of bundling hardware with cloud analytics. WHOOP’s model eliminates upfront costs, aligning vendor incentives with long-term engagement. Specialty sports stores still matter for footwear sensors and custom garments but shift toward experiential events as e-commerce erodes volume. Mass-retail chains focus on entry-level devices yet lack staff expertise to justify premiums, keeping them a commodity channel.
Enterprise contracts bypass retail entirely; Catapult signs multi-year deals that exceed USD 100,000 and include consulting and white-glove integration. As vendors harvest first-party data to refine upsells, smaller brands without direct channels struggle to sustain visibility. This distribution realignment concentrates power among firms that control end-user relationships across the wearable devices in sports market.
Geography Analysis
North America retained 41.72% revenue in 2025, powered by league mandates for head-impact and pitch-biomechanics monitoring. Division I universities dedicate seven-figure budgets to satisfy NCAA health guidelines, providing a captive enterprise clientele. High consumer purchasing power sustains premium average selling prices and supports a profitable ecosystem for vendors.
Asia-Pacific will grow at 4.98% CAGR as China’s government-backed academies use wearable benchmarks for talent identification and India’s cricket federation normalizes GPS tracking. Japan’s aging population adopts devices to track fall risk, while South Korean carriers subsidize Galaxy Watch models through connectivity bundles. These factors simultaneously expand the addressable base beyond competitive athletes.
Europe balances stringent GDPR requirements with strong sports-science investments by professional football leagues. The British and Irish Lions’ 2025 workload-streaming initiative illustrates monetization paths that offset compliance costs. Middle Eastern governments invest in stadiums wired for augmented-reality analytics to diversify economies. South America endures tariff-driven price inflation, though Brazilian clubs adopt GPS to keep pace with European standards. African uptake is nascent, anchored in South African rugby and Kenyan distance-running programs but constrained by device costs and connectivity gaps.

Competitive Landscape
The sports market for wearable devices is seeing a moderate level of fragmentation. While consumer-electronics giants like Apple, Samsung, and Garmin capitalize on operating-system lock-in, specialists such as Catapult, STATSports, and Kinexon secure multi-year contracts, offering sport-specific analytics. A testament to this trend, Sony's acquisition of STATSports in October 2025 underscores a push towards integrating hardware, software, and content monetization. Meanwhile, Catapult's strategic moves, including the Perch acquisition and a capital raise of A$130 million, signal an ambition to expand their data focus from field tracking to weight-room biomechanics.
Emerging startups are making waves with innovative sensor technologies, such as Nix Biosensors' hydration-focused sweat patch and PlayerMaker's ankle-mounted motion tracker tailored for soccer. Companies are increasingly differentiating themselves through on-device machine learning capabilities, which provide insights without the delays of cloud processing, giving an edge to those with semiconductor collaborations. While the race for patents in textile sensors and ingestible technologies is fierce, regulatory challenges are slowing down the pace of commercialization. Adhering to ISO accuracy benchmarks and FDA wellness recommendations not only bolsters vendor credibility but also creates a divide: solutions that are clinically validated versus those designed for consumer convenience.
The market is also witnessing a growing emphasis on partnerships and collaborations to drive innovation and expand market reach. Established players and startups alike are forming alliances with academic institutions, sports organizations, and technology providers to enhance product development and validate their solutions. These partnerships are expected to play a crucial role in addressing regulatory challenges and accelerating the adoption of wearable devices in sports.
Wearable Devices In Sports Industry Leaders
Garmin Ltd.
Kinexon GmbH
Sensoria Inc
Zepp Health Corporation
Catapult Group International Ltd.
- *Disclaimer: Major Players sorted in no particular order

Recent Industry Developments
- February 2026: Samsung launched Galaxy Watch7 and Galaxy Watch Ultra with on-device neural networks for real-time workout classification.
- January 2026: Garmin introduced Xero L60i heads-up rangefinder glasses, broadening its portfolio beyond wrist devices.
- October 2025: Sony acquired STATSports, integrating elite GPS analytics into its technology ecosystem.
- October 2025: Catapult raised A$130 million to fund new products after buying Perch strength-analytics platform.


Global Wearable Devices In Sports Market Report Scope
Wearable technology (also called wearable gadgets) that athletes and sports teams use is considered in the market scope. Wearables used for sports, like consumer wearables, often incorporate tracking information associated with health and fitness. Sports wearables work with other analytical applications that provide actionable insights to increase productivity and future planning. These wearable devices have minute motion sensors to capture data and synchronize with mobile devices.
The Wearable Devices In Sports Market Report is Segmented by Device Type (Fitness and Heart-Rate Monitors, Smart Clothing and E-Textiles, and More), Sport (Soccer / Football, Basketball, and More), End User(Professional Teams and Leagues, and More), Distribution Channel (Online, Specialty Sports Stores, Mass-Retail and Electronics Chains, and More), and Geography. The Market Forecasts are Provided in Terms of Value (USD).
| Fitness and Heart-Rate Monitors |
| Smart Clothing and E-Textiles |
| GPS / GNSS Trackers |
| Camera-Based and Vision Wearables |
| Footwear and In-Shoe Sensors |
| Head-Mounted and AR Displays |
| Ingestible and Other Emerging Sensors |
| Soccer / Football |
| Basketball |
| American Football and Rugby |
| Baseball / Softball |
| Cricket |
| Golf and Tennis |
| Cycling and Triathlon |
| Swimming and Aquatics |
| Extreme and Adventure Sports |
| Professional Teams and Leagues |
| Collegiate / University Programs |
| Amateur and Club Athletes |
| Recreational Fitness Enthusiasts |
| Sports Academies and Training Centers |
| Medical and Rehab Facilities |
| Online (Direct and Marketplaces) |
| Specialty Sports Stores |
| Mass-Retail and Electronics Chains |
| Team / Enterprise Contracts |
| North America | United States |
| Canada | |
| Mexico | |
| South America | Brazil |
| Argentina | |
| Rest of South America | |
| Europe | Germany |
| United Kingdom | |
| France | |
| Italy | |
| Spain | |
| Rest of Europe | |
| Asia-Pacific | China |
| India | |
| Japan | |
| South Korea | |
| Australia and New Zealand | |
| Rest of Asia-Pacific | |
| Middle East | Saudi Arabia |
| United Arab Emirates | |
| Turkey | |
| Rest of Middle East | |
| Africa | South Africa |
| Nigeria | |
| Egypt | |
| Rest of Africa |
| By Device Type | Fitness and Heart-Rate Monitors | |
| Smart Clothing and E-Textiles | ||
| GPS / GNSS Trackers | ||
| Camera-Based and Vision Wearables | ||
| Footwear and In-Shoe Sensors | ||
| Head-Mounted and AR Displays | ||
| Ingestible and Other Emerging Sensors | ||
| By Sport | Soccer / Football | |
| Basketball | ||
| American Football and Rugby | ||
| Baseball / Softball | ||
| Cricket | ||
| Golf and Tennis | ||
| Cycling and Triathlon | ||
| Swimming and Aquatics | ||
| Extreme and Adventure Sports | ||
| By End User | Professional Teams and Leagues | |
| Collegiate / University Programs | ||
| Amateur and Club Athletes | ||
| Recreational Fitness Enthusiasts | ||
| Sports Academies and Training Centers | ||
| Medical and Rehab Facilities | ||
| By Distribution Channel | Online (Direct and Marketplaces) | |
| Specialty Sports Stores | ||
| Mass-Retail and Electronics Chains | ||
| Team / Enterprise Contracts | ||
| By Geography | North America | United States |
| Canada | ||
| Mexico | ||
| South America | Brazil | |
| Argentina | ||
| Rest of South America | ||
| Europe | Germany | |
| United Kingdom | ||
| France | ||
| Italy | ||
| Spain | ||
| Rest of Europe | ||
| Asia-Pacific | China | |
| India | ||
| Japan | ||
| South Korea | ||
| Australia and New Zealand | ||
| Rest of Asia-Pacific | ||
| Middle East | Saudi Arabia | |
| United Arab Emirates | ||
| Turkey | ||
| Rest of Middle East | ||
| Africa | South Africa | |
| Nigeria | ||
| Egypt | ||
| Rest of Africa | ||


Key Questions Answered in the Report
What was the wearable devices in sports market size in 2026?
The market was valued at USD 98.06 billion in 2026.
Which device type leads revenue today?
Fitness and heart-rate monitors held 38.21% of 2025 revenue.
Which sport segment is growing fastest toward 2031?
Swimming and aquatics are forecast to expand at a 7.01% CAGR through 2031.
Why are medical facilities adopting sports wearables?
Orthopedic and rehab centers use gait and mobility sensors to track post-surgical recovery, driving a 5.23% CAGR in the segment.
What is the primary distribution channel for new devices?
Online direct-to-consumer sales captured 46.87% of 2025 value and continue to expand at 5.62% CAGR.
How do data-privacy rules affect adoption?
GDPR and U.S. state laws now require explicit athlete consent and joint oversight committees, increasing compliance costs and slowing rollouts.
Page last updated on:


