
Visible Light Communication Market Size and Share
Market Overview
| Study Period | 2020 - 2031 |
|---|---|
| Market Size (2026) | USD 6.86 Billion |
| Market Size (2031) | USD 38.57 Billion |
| Growth Rate (2026 - 2031) | 41.25 % |
| Fastest Growing Market | Asia-Pacific |
| Largest Market | North America |
| Market Concentration | Medium |
Major Players *Disclaimer: Major Players sorted in no particular order Image © Mordor Intelligence. Reuse requires attribution under CC BY 4.0. | |
Visible Light Communication Market Analysis by Mordor Intelligence
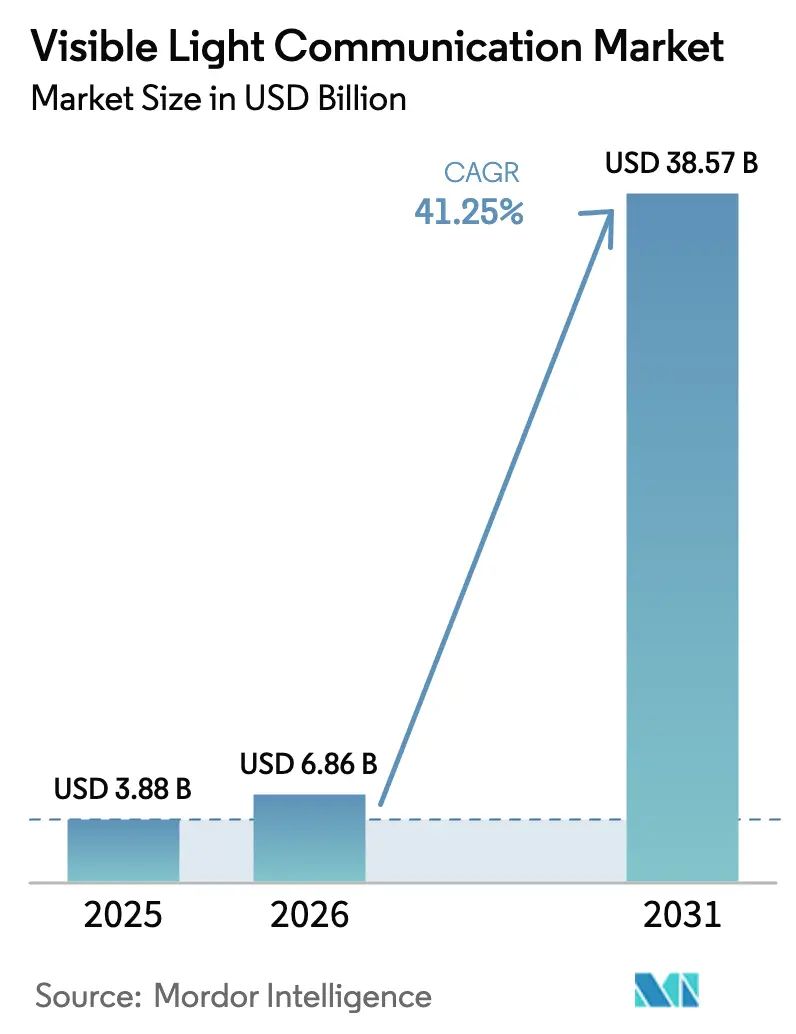
The visible light communication market size is projected to be USD 3.88 billion in 2025, USD 6.86 billion in 2026, and reach USD 38.57 billion by 2031, growing at a CAGR of 41.25% from 2026 to 2031. Early adoption across hospitals, retail chains, and smart-city infrastructure demonstrates how the technology turns everyday LED fixtures into dual-purpose assets that illuminate and transmit multi-gigabit data. Ratification of IEEE 802.11bb in November 2023 removed a key standards bottleneck, allowing vendors to shorten product development cycles and reduce certification costs. Rising demand for radio-frequency-free connectivity in medical and aviation environments, municipal funding for LED street-light retrofits, and breakthroughs in quantum-dot micro-LEDs that push data rates beyond 10 Gbps form a reinforcing growth loop. Cost declines for photodetectors and Li-Fi-optimized microcontrollers further lower entry barriers, while governments in China, Japan, and the United States earmark optical-wireless research funds to expand the addressable base for pilot projects.
Key Report Takeaways
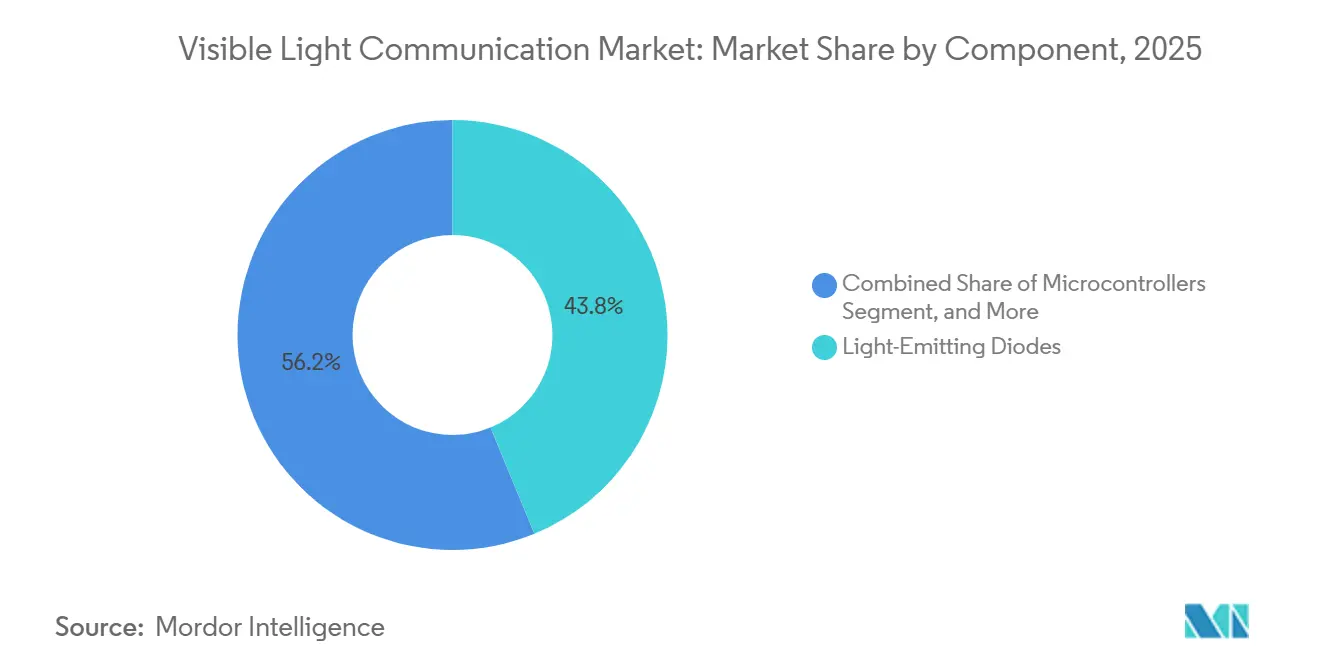
- By component, light-emitting diodes held 43.78% of the visible light communication market share in 2025, whereas microcontrollers are forecast to expand at a 42.11% CAGR through 2031.
- By transmission type, unidirectional systems captured a 66.83% share in 2025, while bidirectional links are growing at a 41.47% CAGR to 2031.
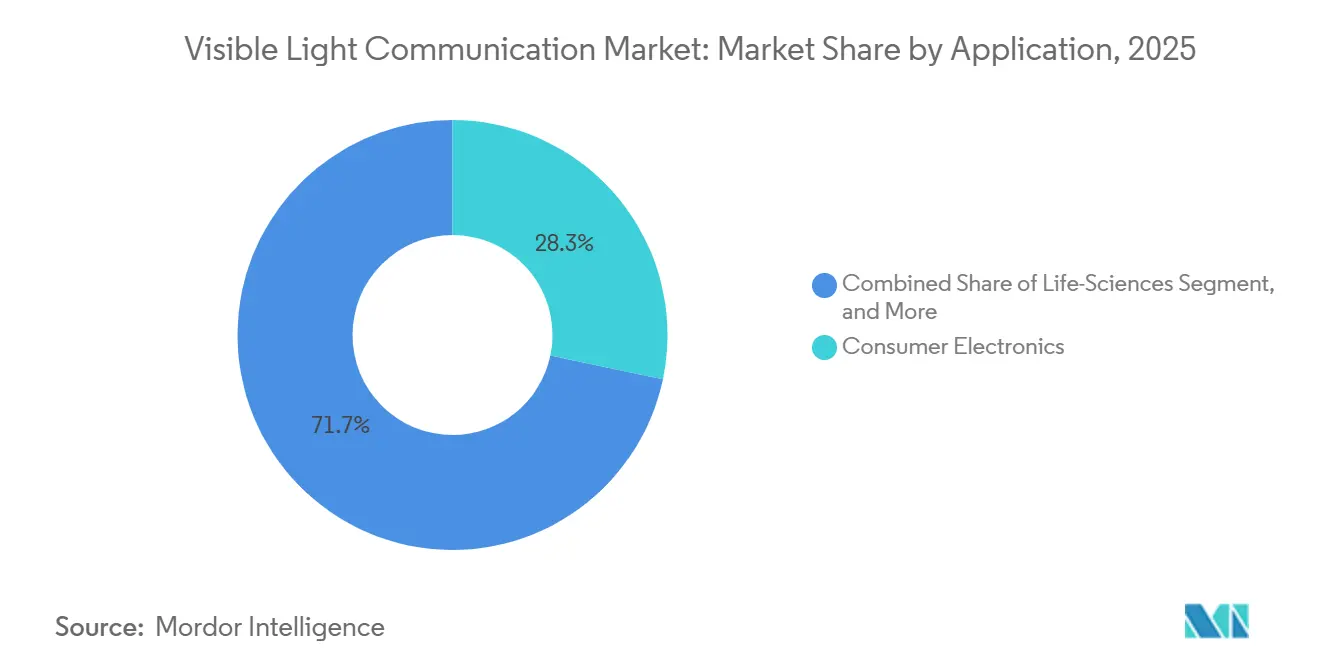
- By application, consumer electronics commanded a 28.29% share in 2025; life-sciences deployments are advancing at a 42.49% CAGR through 2031.
- By end-user vertical, healthcare accounted for 27.17% of the visible light communication market size in 2025, while retail is projected to grow at a 42.21% CAGR to 2031.
- By geography, North America led with a 37.49% share in 2025; Asia Pacific is forecast to post a 42.27% CAGR between 2026 and 2031.
Note: Market size and forecast figures in this report are generated using Mordor Intelligence’s proprietary estimation framework, updated with the latest available data and insights as of January 2026.
Global Visible Light Communication Market Trends and Insights
Drivers Impact Analysis*
| Driver | (~) % Impact on CAGR Forecast | Geographic Relevance | Impact Timeline |
|---|---|---|---|
| Rapid LED replacement in indoor lighting infrastructure | +8.5% | Global, led by North America, Europe, urban Asia Pacific | Medium term (2-4 years) |
| Surging demand for RF-free connectivity in hospitals and aircraft cabins | +7.2% | North America, Europe, Asia Pacific | Short term (≤ 2 years) |
| Government-funded smart-city street-light retrofits | +6.8% | North America, Europe, China, India, Middle East | Medium term (2-4 years) |
| Retail indoor-positioning roll-outs by big-box chains | +5.9% | North America, Europe, Middle East, Asia Pacific | Short term (≤ 2 years) |
| Adoption of Li-Fi as a 6G backhaul candidate | +4.7% | Asia Pacific core, pilots in North America and Europe | Long term (≥ 4 years) |
| Quantum-dot micro-LED breakthroughs enabling 10 Gbps+ links | +3.9% | Global, research hubs in North America, Europe, Japan, South Korea | Long term (≥ 4 years) |
| Source: Mordor Intelligence | |||
Rapid LED Replacement in Indoor Lighting Infrastructure
Building owners accelerated LED conversions to meet energy-efficiency mandates, creating an installed base of fixtures that can be upgraded with Li-Fi transceivers at marginal cost. Los Angeles, for example, upgraded 98% of its 220,000 streetlights to LED, with 37,000 nodes already networked for remote diagnostics, paving the way for optical wireless overlays.[1]City of Los Angeles Bureau of Street Lighting, “LED Street Light Conversion Program Update,” bsl.lacity.org Factory-integrated Li-Fi chipsets are now appearing in commercial luminaires, reducing per-unit costs by leveraging economies of scale. Retrofit kits equipped with photodetectors and microcontrollers allow hospitals and schools to avoid disruptive cabling work, and shorter LED replacement cycles guarantee a steady pipeline of Li-Fi-ready projects. Collectively, these shifts add 8.5 percentage points to the long-term CAGR impact.
Surging Demand for RF-Free Connectivity in Hospitals and Aircraft Cabins
Electromagnetic interference limits in critical-care zones and aircraft cabins favor optical wireless links over Wi-Fi and Bluetooth. NHS England’s 2024 ambulance-bay trial used pureLiFi units to upload patient records without disturbing life-support equipment. The EU Aircraft Light Communication project proved 1 Gbps cabin throughput, showing viable grounds for airline deployment.[2]European Commission, “Horizon 2020 Aircraft Light Communication Project,” ec.europa.eu Because Li-Fi signals stay within illuminated zones, healthcare providers gain deterministic, secure bandwidth for electronic health records, while airlines avoid the weight of coaxial backbones. This dynamic contributes a 7.2% positive swing to CAGR.
Government-Funded Smart-City Streetlight Retrofits
Municipal grants bind LED retrofits with IoT ambitions. Washington, D.C., illuminated 75,000 LED streetlights that double as sensing nodes, leaving only photodetectors to add Li-Fi backhaul for traffic monitoring or public Wi-Fi.[3]D.C. Government, “Smart Street Lighting Initiative,” dc.gov The United Kingdom’s GBP 4 million (USD 5 million) pilot fund aims to fit connected-vehicle Li-Fi units inside upgraded poles. China's 14th Five-Year Plan prioritizes optical wireless research, accelerating prototype trials at Fudan and Tsinghua universities. Such public financing lowers adoption barriers, boosting CAGR by 6.8%.
Retail Indoor-Positioning Roll-Outs by Big-Box Chains
Big-box chains deploy Li-Fi for centimeter-level indoor positioning to guide shoppers and automate inventory tracking. Signify’s Interact platform has gone live in Carrefour Lille, Aswaaq Dubai, and Albert Heijn supermarkets, integrating promotions with store apps. Target plans to equip 100 stores by 2025 and reports shorter customer search times. Walmart’s pilots with Acuity Brands tied shelf-edge sensors to Li-Fi backhaul, cutting stockouts by 18%. Superior accuracy over Bluetooth beacons fuels new analytics revenue streams, boosting overall CAGR by 5.9%.
Restraints Impact Analysis*
| Restraint | (~) % Impact on CAGR Forecast | Geographic Relevance | Impact Timeline |
|---|---|---|---|
| Absence of global interoperability standards | -2.8% | Global, fragmentation acute in Asia Pacific and Middle East | Short term (≤ 2 years) |
| High up-front fixture retrofit costs | -3.4% | Global, cost sensitivity in South America, Africa, parts of Asia Pacific | Medium term (2-4 years) |
| Ambient-light noise in tropical and outdoor deployments | -2.1% | South America, Africa, Southeast Asia, outdoor globally | Medium term (2-4 years) |
| Supply-chain dependency on high-speed driver ICs | -1.9% | Global, supply concentrated in Asia Pacific | Short term (≤ 2 years) |
| Source: Mordor Intelligence | |||
Absence of Global Interoperability Standards
IEEE 802.11bb resolves only physical-layer parameters, leaving media-access rules open to proprietary tweaks that trap buyers into single-vendor contracts. Certification regimes equivalent to those of the Wi-Fi Alliance are still missing, so enterprises rely on vendor self-declarations, which raises perceived risk. Regional electromagnetic-compatibility rules diverge, forcing manufacturers to re-test products across continents, which delays time to market and subtracts 2.8% from CAGR momentum.
High Up-Front Fixture Retrofit Costs
Full Li-Fi retrofits run USD 200-500 per luminaire once photodetectors, microcontrollers, and power-over-Ethernet adapters are installed, stretching payback periods in cost-sensitive schools and small retailers. Consulting, spectrum planning, and staff training inflate project outlays by another 15-25%. Financing models such as lighting-as-a-service exist but remain geographically limited, restraining CAGR growth by 3.4%.
*Our forecasts treat driver/restraint impacts as directional, not additive. The impact forecasts reflect baseline growth, mix effects, and variable interactions.
Segment Analysis
By Component: Microcontrollers Drive Bidirectional Intelligence
Microcontrollers are set to outpace the broader visible light communication market at a 42.11% CAGR between 2026 and 2031. Because bidirectional Li-Fi links require real-time channel estimation, adaptive equalization, and forward-error correction, designers are shifting from discrete FPGAs to high-speed system-on-chip controllers that integrate digital signal processors. Renesas, STMicroelectronics, and Texas Instruments now ship 200 MHz devices with Li-Fi-specific instruction sets, shrinking board space and power draw. Qualcomm patents point to handset-grade chipsets that merge optical and radio transceivers, hinting at mass-market consumer potential.
Light-emitting diodes retained 43.78% of the visible light communication market share in 2025, thanks to their dual illumination-and-transmission role, yet growth moderates as the LED replacement cycle matures. Photodetectors benefit from advances in avalanche diodes that improve immunity to ambient light, and software-defined Li-Fi stacks extend hardware life by pushing modulation upgrades over the air. Service layers spanning network management, predictive maintenance, and analytics grow steadily as operators shift to outcome-based contracting.



By Transmission Type: Bidirectional Links Unlock Interactive Use Cases
Although unidirectional links captured 66.83% of the visible light communication market in 2025 because they serve cost-sensitive positioning and signage jobs, bidirectional systems are closing the gap with a 41.47% CAGR. Bidirectional Li-Fi typically pairs a visible downlink with an infrared uplink, delivering secure, full-duplex connectivity suited to telemedicine or military command rooms. pureLiFi’s LINXC Bridge, unveiled at Mobile World Congress 2025, supports 100 concurrent users and gigabit aggregate throughput, making it appealing to conference venues and airport lounges. Signify’s Trulifi 6004 gained FIPS 140-3 validation in 2025, clearing procurement paths inside the United States Department of Defense.
While cost-driven retail roll-outs continue to favor unidirectional kits due to their affordability and simplicity, businesses are increasingly opting for bidirectional packages. These packages address critical needs such as authentication, latency guarantees, and encrypted uplinks, which are essential for secure and efficient operations. Additionally, full-duplex architectures enable advanced features like quality-of-service tagging, adhering to IEEE 802.11bb standards. This alignment allows optical wireless throughput management to integrate seamlessly with familiar Wi-Fi tools, enhancing overall network performance and reliability.
By Application: Life Sciences Accelerate on Cleanroom Imperatives
Life-sciences facilities, pharmaceutical cleanrooms, biotech labs, and medical device plants are on track for a 42.49% CAGR, the fastest among application segments. ISO 14644 cleanrooms permit only low-energy electronics; Li-Fi transceivers packaged inside IP67 housings satisfy both sterility and electromagnetic criteria. Optical wireless links stream batch records and sensor data without risking radio-frequency contamination that can distort precision assays.
Consumer electronics, anchored by laptops and smartphones, controlled 28.29% of the visible light communication market share in 2025. Growth here depends on handset upgrade cycles and convergence with Wi-Fi 7. Defense and security buyers value Li-Fi’s immunity to jamming and eavesdropping, and NATO’s technology office is assessing field-deployable optics for contested environments. Transportation uses in-flight entertainment and vehicle-to-infrastructure channels, and public infrastructure projects layer Li-Fi onto smart street lighting to offload congested cellular spectrum.
By End-User Vertical: Retail Leads on Positioning and Analytics
Retailers will log a 42.21% CAGR through 2031 as big-box and specialty formats roll out indoor-location services, digital signage, and autonomous inventory robots. Walmart’s supercenter pilot with Acuity Brands slashed shelf stockouts by 18% through real-time Li-Fi sensor telemetry. Healthcare institutions maintained a 27.17% share in 2025, with expansion from operating rooms into outpatient clinics. Industrial users integrate Li-Fi into Industry 4.0 control loops, linking robotic arms and machine-vision stations where radio interference hampers accuracy.
Education projects validate multi-user performance under exam-room conditions, ensuring robust and reliable connectivity for multiple users in high-pressure environments. Aerospace cabins utilize overhead lights to provide multi-gigabit entertainment, enabling seamless streaming and data transfer without the need for additional radio antennas, thereby optimizing space and reducing interference. Meanwhile, automotive interiors are carving out a new niche, as evidenced by Nakagawa Laboratories showcasing 500 Mbps vehicle-to-infrastructure links over a distance of 50 meters, a significant advancement in automotive connectivity expected to be implemented by 2025.
Geography Analysis
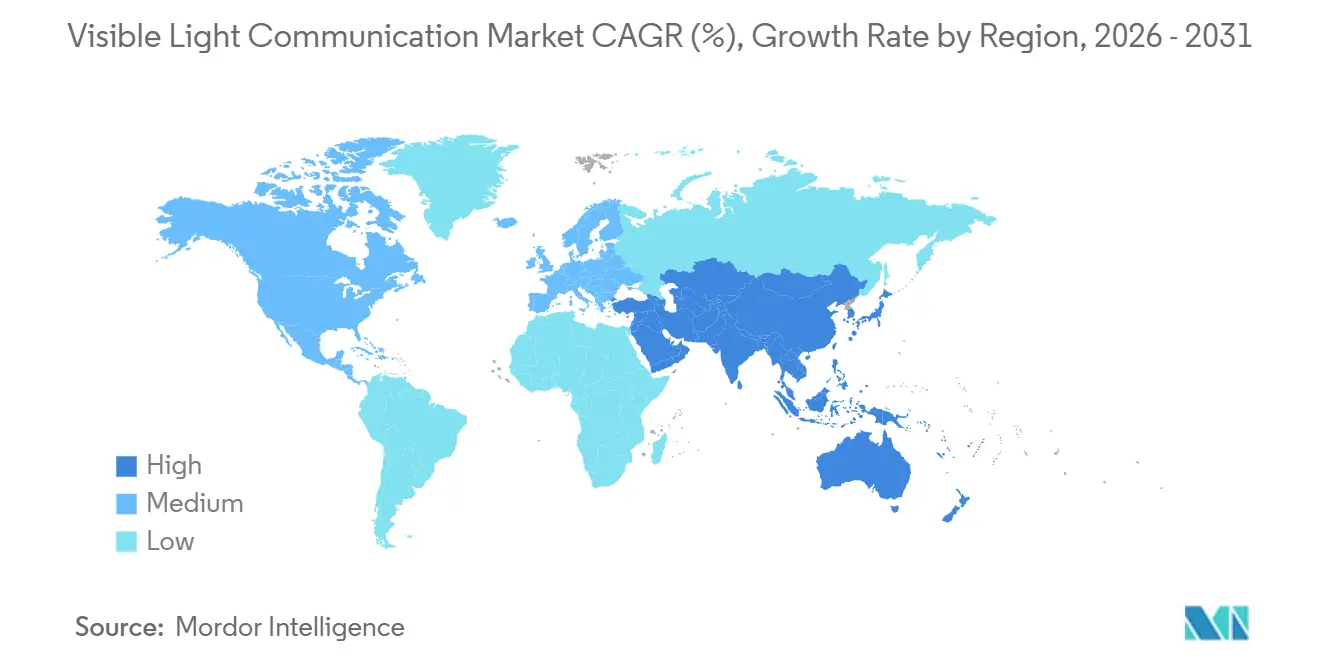
North America held 37.49% of the visible light communication market share in 2025, on the back of early smart-city deployments and defense contracts. The Los Angeles streetlight program converted 98% of 220,000 luminaires to LED and networked 37,000 nodes, positioning the grid for Li-Fi overlays. Washington, D.C.’s 75,000 LED poles similarly create a ready backbone for public Wi-Fi handoffs. Canada channels federal grants into hospital and campus pilot sites, while Mexico’s mall operators embed Li-Fi wayfinding to lift footfall analytics.
Asia Pacific is projected to record a 42.27% CAGR from 2026-2031, the fastest globally, underpinned by China’s 14th Five-Year Plan and Japan’s industrial-automation push. Fudan University and Tsinghua University both receive government funding for smart-city prototypes. Panasonic and Nakagawa Laboratories showcase multi-gigabit test beds for factories and highway corridors. India’s 100-city smart mission plants Li-Fi pilots in Delhi and Bangalore, and South Korea’s ETRI embeds optical wireless within its 6G standards blueprint. Australia probes Li-Fi links in underground mines where radio sparks pose explosion risks.
Europe benefits from strict electromagnetic-compatibility mandates that encourage hospitals and aircraft cabins to adopt optical wireless. The United Kingdom invested GBP 4 million (USD 5 million) in streetlight pilots that combine Li-Fi with pedestrian-safety analytics. Germany’s Siemens and BMW are running factory trials that connect programmable logic controllers via Li-Fi. France extends retail deployments, with Carrefour using Signify’s lighting grid to deliver aisle-level promotions. The Middle East is rolling out Li-Fi in luxury retail and hotels, and Africa’s Zero 1 initiative is experimenting with solar-powered LED poles in underserved regions. South America remains exploratory, citing funding gaps and retrofit costs as near-term hurdles.

Regulatory Landscape
Visible light communication (VLC) and broader optical wireless communication (OWC) deployments generally avoid spectrum licensing requirements because they operate in license-exempt optical bands, shifting compliance focus to product safety and interoperability rather than radio-spectrum governance. Standardization has advanced with ISO/IEC/IEEE 8802-15-7:2025, which defines PHY and MAC requirements for short-range OWC across 190 nm to 10,000 nm and gives enterprises a clearer procurement baseline for interoperable deployments.
Safety and systems architecture requirements remain key gates for adoption in regulated environments. In Europe, CENELEC published EN IEC 60825-12:2026 for laser-based free-space optical communication safety (distinct from LED-based VLC), while ITU-T Recommendation G.9991 provides guidance for high-speed indoor VLC transceivers and ITU-T Y.4465 frames IoT services based on VLC. For IP-based interoperability in IoT networks, the IETF draft-ietf-6lo-owc work targets lightweight IPv6 adaptation over OWC links, reinforcing the shift toward standards-led qualification rather than country-by-country spectrum approvals.
Value Chain Analysis
The VLC value chain begins with component suppliers for LEDs (including emerging micro-LEDs), photodetectors, LED driver ICs, and high-speed microcontrollers/DSP-capable SoCs that execute modulation, equalization, and security functions for bidirectional links. These components feed into module and luminaire makers that integrate optical front-ends into commercial lighting fixtures, as well as device OEMs building dongles, access points, and bridges. Upstream dependency on high-speed driver ICs and specialized optical packaging keeps the component layer strategically important, particularly where ambient-light resilience and multi-gigabit performance are required.
Midstream system vendors and software providers package hardware with network management, authentication, and analytics, then deliver solutions through lighting channels, IT integrators, and vertical-focused partners in healthcare, retail, industrial sites, and transportation. Standards bodies influence integration choices, with ISO/IEC/IEEE 8802-15-7:2025 and ITU-T G.9991 shaping PHY/MAC and indoor transceiver design, and the IETF 6LoWPAN-over-OWC effort supporting IP-native IoT deployments. Downstream, end users typically adopt via retrofit kits or lighting refresh cycles, with service partners handling site surveys, commissioning, and ongoing operations for multi-site rollouts.
Competitive Landscape
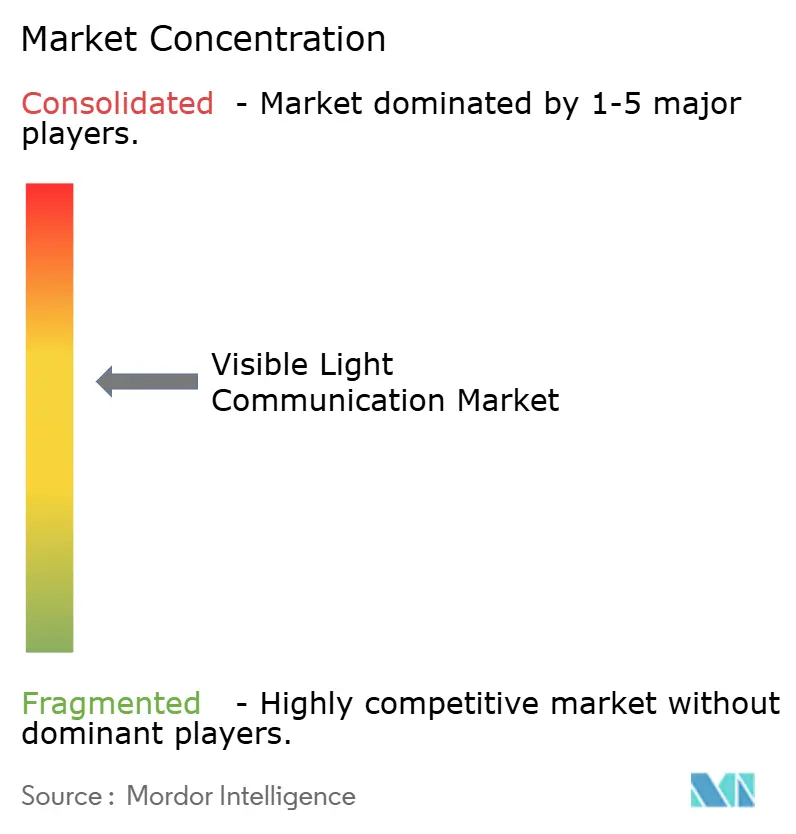
The visible light communication market remains moderately fragmented. Signify leads through its Trulifi range, installed across more than 150 global sites after acquiring Firefly LiFi and Luciom, moves that consolidated pivotal patents. pureLiFi, headquartered in Scotland, raised GBP 18 million (USD 22.5 million) in Series B funding and an additional GBP 10 million (USD 12.5 million) in April 2025, underwriting the scale-up of the LINXC Bridge, which blends optical and Wi-Fi roaming. France’s Oledcomm reached 2 Gbps demonstrators in 2024 and targets aerospace and defense niches.
Acuity Brands integrates Li-Fi within its lighting-and-analytics stack and partners with Walmart for shelf-edge automation. Emerging players such as Velmenni and VLNComm chase cost-sensitive Asia Pacific and Middle East projects with unidirectional positioning kits. Technology differentiation now centers on modulation bandwidth and hybrid optical-radio handoffs, fields bolstered by IEEE 802.11bb’s interoperability guarantees. Pure-play specialists often control both emitters and photodetectors, enabling faster iterations, while incumbents leverage distribution muscle and existing maintenance contracts to win multi-site roll-outs.
Patent filings illustrate momentum toward quantum-dot micro-LEDs capable of 10 Gbps, narrowing the throughput gap with fiber. Vendors increasingly pitch Li-Fi as a low-latency complement to Wi-Fi 7 and 5G Advanced rather than a replacement, enabling blended connectivity that optimizes spectrum usage and energy consumption. Mergers and supplier alliances are likely as component availability and standards roadmaps converge.
Visible Light Communication Industry Leaders
Signify N.V.
pureLiFi Ltd.
Oledcomm S.A.S.
Acuity Brands, Inc.
Panasonic Corporation
- *Disclaimer: Major Players sorted in no particular order

Market Opportunities and Future Outlook
Near-term whitespace centers on turning standards progress into repeatable, multi-vendor deployments in regulated and high-density indoor environments where RF constraints are explicit, such as hospitals, aircraft cabins, and secure government facilities. IEEE 802.11bb (ratified in November 2023) provides a Wi-Fi-aligned baseline for light communications, and the IEEE 802.11 Enhanced Light Communication (ELC, 802.11br) roadmap targets multi-link operations and broader optical bands (including 400 nm to 600 nm and 1200 nm to 1600 nm), which opens additional design room for hybrid visible and infrared implementations. Vendor activity in secure networking (for example, Signify Trulifi systems with U.S. government-oriented validation paths cited in the report context) supports opportunity in procurement-driven segments that prioritize deterministic coverage and contained propagation.
A second opportunity track is the convergence of Li-Fi/OWC with 5G fixed wireless access (FWA) and indoor coverage bridging, where through-window and in-building optical links address penetration and interference limits without adding RF spectrum dependencies. Research programs also broaden the technical ceiling for multi-user capacity and next-generation architectures: the TOWS project (completed in March 2025) reported a 6G-oriented optical wireless system concept with substantially higher capacity than 5G-era baselines, while the LiFi Research and Development Centre TITAN platform continues lighthouse work on use cases such as net-zero data links and LiFi-lidar sensing integration. Together, these programs and standards efforts create clearer implementation pathways for enterprises and integrators to expand beyond pilots into scaled, managed networks.
Recent Industry Developments
- April 2026: Askey Computer Corp. announced a strategic partnership with pureLiFi to develop an all-in-one, through-window bridging system. The move targets the practical deployment gap between outdoor access links and indoor connectivity, positioning optical wireless as a complementary last-meter option alongside existing access technologies.
- November 2025: Oledcomm signed a contract with CNES (Centre national d'etudes spatiales) to develop the LUCI (Ultra-Compact Inter-Satellite Liaison) terminal for high-speed laser communications between satellites. This contract underscores the pull from space and defense-adjacent programs for compact, secure optical links that share enabling components and know-how with terrestrial OWC ecosystems.
- June 2025: Signify announced its Trulifi 6004 light-based network system received FIPS 140-3 validation from the U.S. National Institute of Standards and Technology (NIST). The validation strengthens eligibility for security-sensitive deployments and reinforces Li-Fi positioning as a compliant alternative where encrypted, contained wireless links are required.


Research Methodology Framework and Report Scope
Market Definition and Coverage
This market is defined as revenue generated from using visible light, mainly from LED-based sources, to transmit data between a transmitter and a receiver in commercial and public settings.
Scope exclusions: We exclude infrared-only and ultraviolet-only optical wireless links, as well as pure general-purpose LED lighting sales when the fixture is not enabled and sold for data communication use.
Segmentation Overview
- By Component
- Light-Emitting Diodes
- Photodetectors
- Microcontrollers
- Software and Services
- By Transmission Type
- Unidirectional
- Bidirectional
- By Application
- Consumer Electronics
- Defense and Security
- Transportation
- Public Infrastructure
- Life Sciences
- Other Applications
- By End-User Vertical
- Healthcare
- Retail
- Industrial and Manufacturing
- Aerospace and Aviation
- Education
- By Geography
- North America
- United States
- Canada
- Mexico
- Europe
- Germany
- United Kingdom
- France
- Russia
- Rest of Europe
- Asia-Pacific
- China
- Japan
- India
- South Korea
- Australia
- Rest of Asia-Pacific
- Middle East and Africa
- Middle East
- Saudi Arabia
- United Arab Emirates
- Rest of Middle East
- Africa
- South Africa
- Egypt
- Rest of Africa
- Middle East
- South America
- Brazil
- Argentina
- Rest of South America
- North America
Data Sources, Market Sizing, and Validation
Desk Research
Desk research is used to lock the market boundary, track standardization progress, and collect public indicators that can be tied back to visible light communication demand. We usually review items such as IEEE standards updates (including IEEE 802.11bb), connectivity and spectrum publications from bodies such as the FCC and ITU, and lighting and optoelectronics references from sources such as the US Department of Energy.
To ground the model, we also refer to sources such as customs and trade statistics for relevant electronics categories, patent databases to see where filing activity is building, and peer-reviewed journals for adoption constraints like line-of-sight behavior and interference conditions. Company filings, product briefs, investor presentations, association websites, and reputable press coverage are used to sanity-check adoption claims and typical pricing ranges, and a paid subscription for company financials and news helps connect public statements with commercial traction. These are examples only, and many other sources were also consulted to collect data points, validate assumptions, and clarify open questions.
Primary Interviews and Surveys
Primary interviews and surveys help confirm where visible light communication is being deployed, how offerings are priced across hardware, software, and services, and what slows conversion from pilots into scaled rollouts. We spoke with a mix of ecosystem participants such as component suppliers, solution providers, system integrators, and downstream users across key regions so assumptions from desk work could be tested against implementation details and local buyer expectations.
Distribution of primary research fieldwork respondents
| Company type | Respondent position | Region |
|---|---|---|
| Top tier: 33% | CXOs: 18% | APAC: 39% |
| Mid tier: 46% | Functional/Unit leaders: 39% | EMEA: 37% |
| Smaller Players: 21% | Managers: 43% | Americas: 24% |
Market-Sizing & Forecasting
Sizing starts with a top-down demand pool build where deployment-ready lighting footprints and connectivity use cases are translated into addressable visible light communication installations by region. After that frame is built, the totals are cross-checked using selective bottom-up approximations based on sampled unit volumes and quoted system pricing. We then adjust the direction of the estimates using channel feedback when rollout reality differs from early announcements.
Inputs are kept practical and repeatable, so we used indicators such as LED penetration in target environments, the rate of Li-Fi and indoor positioning trials converting into paid deployments, the mix of unidirectional versus bidirectional systems, average selling price movement for transmitters and receivers, and the services attach rate for integration and maintenance. Where interview inputs varied by application, we captured a range and used the central assumption only after it aligned with other signals such as standards maturity and procurement timing.
For forecasting, scenario analysis is used because the market is sensitive to gating items, such as standards alignment, interference constraints, and budget cycles in infrastructure and transportation projects. Growth assumptions are then stress-tested by region, and where bottom-up visibility is thin, gaps are handled with conservative penetration ramps that can be revisited in later validation calls.
Data Validation & Update Cycle
Validation is handled through a triangulation loop where model outputs are compared against independent signals such as deployment activity, pricing checkpoints, and the pace of standards-driven product launches. Outliers are flagged, and then assumptions like adoption rates or ASP curves are re-checked before numbers move through an internal review.
Reports are refreshed annually, and interim updates are made when there is a material event that changes demand or pricing, such as a standards milestone, a large public deployment, or a meaningful supply constraint. Before delivery, a fresh analyst pass is completed so clients receive the latest view and any remaining variance is explained in plain language.
Mordor Intelligence's Visible Light Communication Market Estimate Compared With Other Published Estimates
Published market sizes for visible light communication can appear far apart, even when they refer to the same family of light-based connectivity solutions. The gaps usually come from what is counted as market revenue, which year is treated as the base, and how quickly deployments are assumed to move from pilots into scaled rollouts.
Standalone LED lighting fixtures sold only for illumination sit outside Mordor Intelligence's scope, which removes a large revenue pool that some estimates appear to blend into visible light communication totals. Differences also show up when software and services are treated as separate categories versus bundled into system revenue, when aggressive scenarios assume faster bidirectional adoption, and when currency timing and refresh cadence are not aligned to the same year assumptions.
Benchmark comparison
| Source | Market Size | Gaps in Research Methodology |
|---|---|---|
| Mordor Intelligence | USD 6.86 B (2026) | |
| Trade Publisher A | USD 5.24 B (2025) | Uses a different base year and provides limited clarity on whether lighting hardware revenue is counted only when it is sold as a communication system, which can shift totals versus a deployment-linked view. |
| Industry Research Group B | USD 3.82 B (2025) | Applies a narrower conversion assumption from pilots to scaled installs, and it is less explicit on whether software and services are included consistently across applications. |
Taken together, the spread is mainly explained by what revenue is counted and how fast adoption is assumed to scale in real sites. By keeping the model tied to observable deployment signals and using consistent pricing and attach-rate logic, the resulting number stays traceable to clear steps that can be repeated during future refreshes.


Key Questions Answered in the Report
How fast is global revenue growing for the visible light communication market?
Global revenue is rising from USD 6.86 billion in 2026 to USD 38.57 billion by 2031, equal to a 41.25% CAGR.
Which component category is expanding the quickest?
Microcontrollers lead with a 42.11% CAGR because bidirectional links need embedded signal-processing intelligence.
What segment currently commands the largest visible light communication market share?
LEDs hold 43.78% share, reflecting their anchor role as both light source and data emitter in 2025.
Which region will add the most incremental demand by 2031?
Asia Pacific, supported by China’s and Japan’s industrial programs, is set for a 42.27% CAGR, the highest worldwide.
Why do hospitals favor Li-Fi over Wi-Fi?
Optical wireless avoids radio-frequency interference with life-support equipment, satisfying strict IEC 60601-1-2 limits.
What is the primary barrier to mass deployment today?
High upfront retrofit costs of USD 200-500 per luminaire stretch payback periods for budget-sensitive sectors.
Page last updated on:





