Virtual Power Plant (VPP) Market Size and Share
Market Overview
| Study Period | 2021 - 2031 |
|---|---|
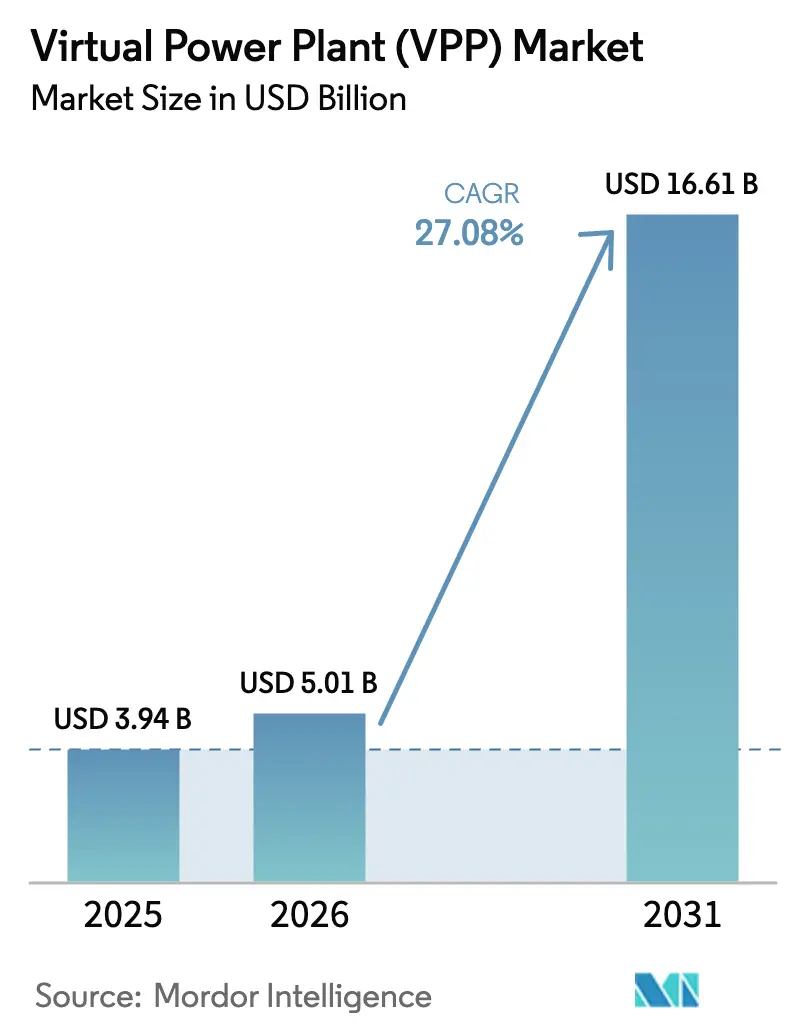
| Market Size (2026) | USD 5.01 Billion |
| Market Size (2031) | USD 16.61 Billion |
| Growth Rate (2026 - 2031) | 27.08% CAGR |
| Fastest Growing Market | Asia Pacific |
| Largest Market | North America |
| Market Concentration | Medium |
Major Players *Disclaimer: Major Players sorted in no particular order Image © Mordor Intelligence. Reuse requires attribution under CC BY 4.0. | |
Virtual Power Plant (VPP) Market Analysis by Mordor Intelligence
The Virtual Power Plant market size is expected to grow from USD 3.94 billion in 2025 to USD 5.01 billion in 2026 and is forecast to reach USD 16.61 billion by 2031 at 27.08% CAGR over 2026-2031.
Market expansion is fueled by renewable-energy mandates, falling storage costs, and policies that open wholesale markets to distributed energy resource (DER) aggregation. Utilities rely on virtual power plant market platforms to orchestrate residential batteries, industrial loads, and rooftop solar, rather than building new peaker plants —a shift that lowers both capital expenditures and carbon intensity. Competitive dynamics are shifting from pilot programs to scaled rollouts as grid operators seek fast-response flexibility to counter renewable energy intermittency. Software-led optimization—especially artificial-intelligence dispatch engines—has become a key differentiator, while hardware suppliers maintain their share through trusted grid equipment portfolios. Growth opportunities remain strongest where regulators harmonize interconnection standards and wholesale-market participation rules.
Key Report Takeaways
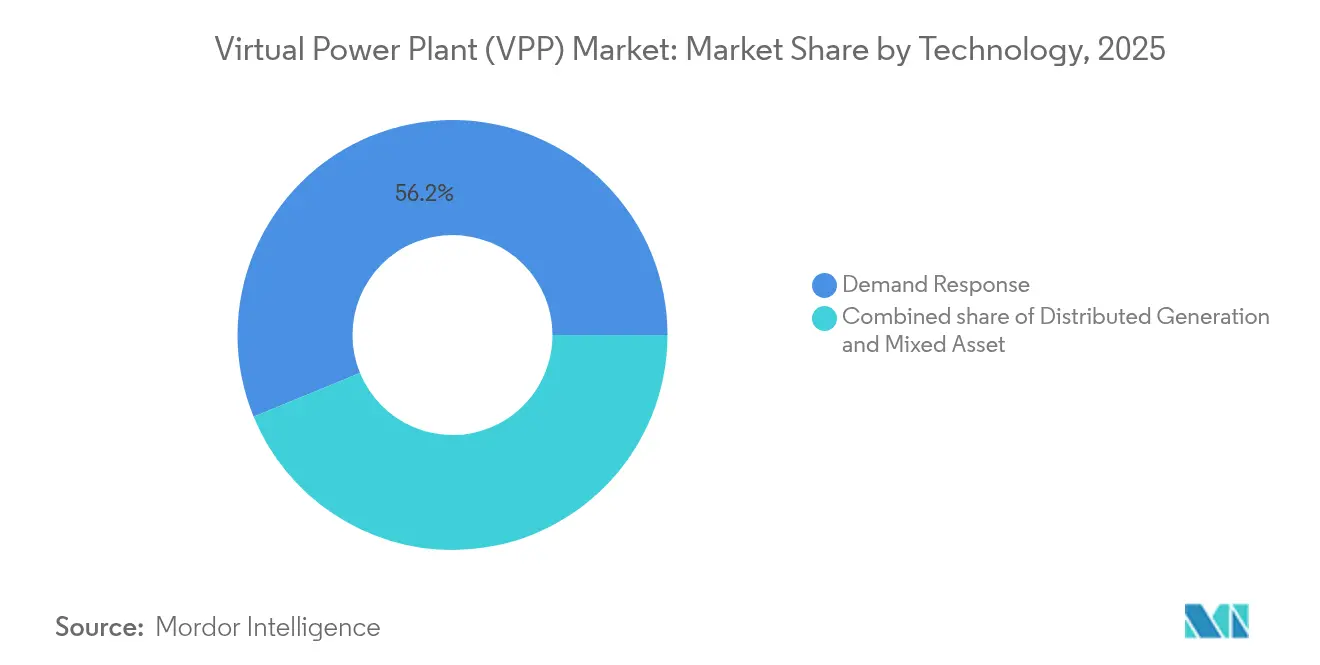
- By technology, demand response commanded 56.20% of the virtual power plant (VPP) market share in 2025, while mixed-asset platforms are forecast to grow at a 29.42% CAGR through 2031.
- By offering, hardware captured 54.10% of the virtual power plant (VPP) market size in 2025; software is advancing at a 27.23% CAGR to 2031.
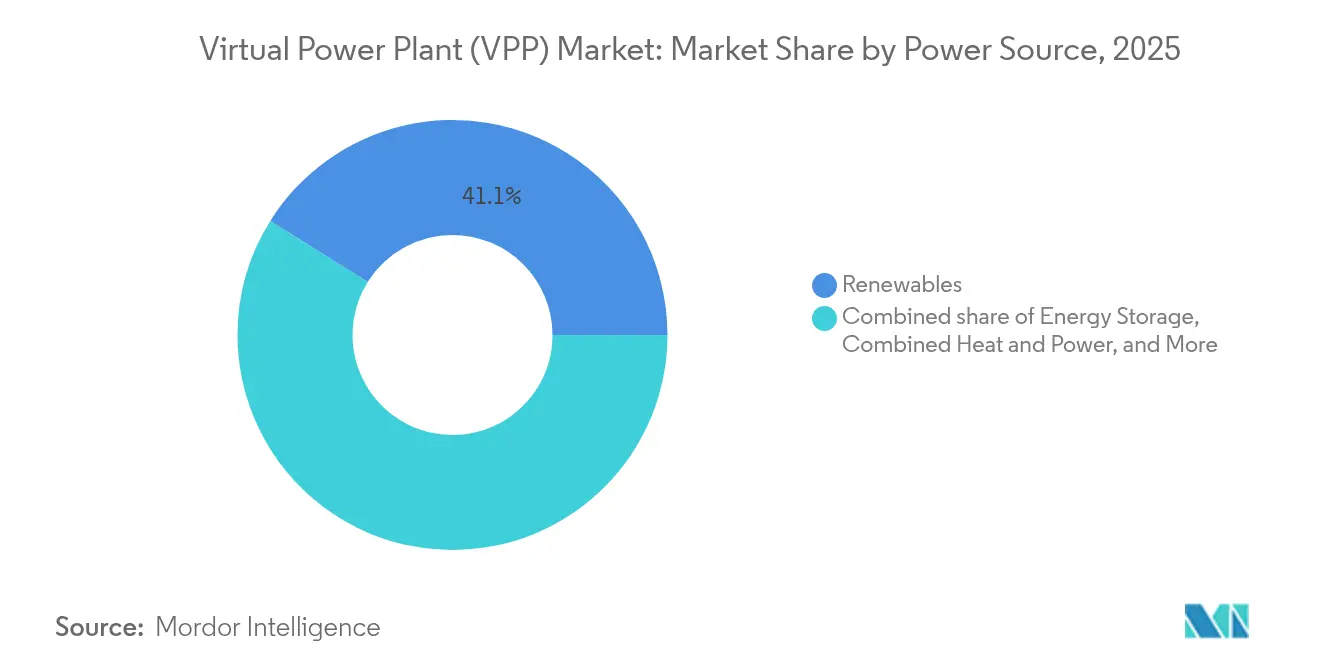
- By power source, renewables led with 41.10% market share in 2025, while also maintaining the highest 27.73% CAGR projection through 2031.
- By end user, industrial facilities held 43.10% revenue share in 2025, whereas residential participation is projected to expand at a 28.07% CAGR through 2031.
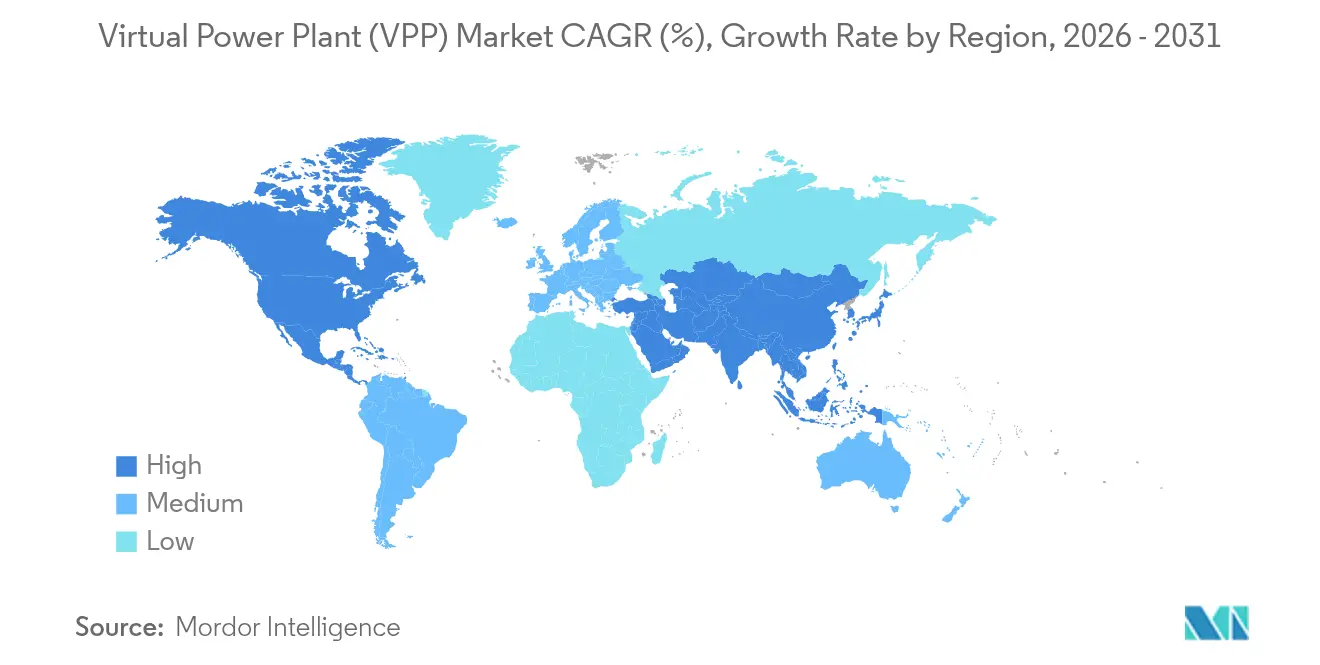
- By region, North America led with a 36.20% share in 2025, and the Asia-Pacific region is projected to rise at a 28.05% CAGR to 2031.
Note: Market size and forecast figures in this report are generated using Mordor Intelligence’s proprietary estimation framework, updated with the latest available data and insights as of 2026.
Market Trends and Insights
Driver Impact Analyis of Virtual Power Plant (VPP) Market*
| Driver | (~) % Impact on CAGR Forecast | Geographic Relevance | Impact Timeline |
|---|---|---|---|
| Rising share of renewables in electricity mix | +5.0% | Global, with concentration in EU, California, Australia | Long term (≥ 4 years) |
| Shift from centralized to distributed generation | +4.4% | North America & EU, expanding to APAC | Medium term (2-4 years) |
| Government incentives for demand response programs | +3.9% | North America core, EU regulatory alignment | Short term (≤ 2 years) |
| Falling battery-storage costs | +3.3% | Global, with early adoption in developed markets | Medium term (2-4 years) |
| EV fleet batteries emerging as mobile storage nodes | +2.2% | North America, EU, China leading deployment | Long term (≥ 4 years) |
| Peer-to-peer energy trading platforms within VPPs | +1.7% | EU regulatory sandboxes, Australia trials | Long term (≥ 4 years) |
| Source: Mordor Intelligence | |||
Rising Share of Renewables in Electricity Mix
Worldwide renewable capacity additions are tightening grid balancing margins, thereby elevating the role of virtual power plant market platforms that aggregate thousands of small-scale assets into dispatchable portfolios. California briefly met 100% of demand with renewables in April 2024, a milestone that highlighted the need for real-time flexibility services delivered by VPPs. The EU’s REPowerEU package aims to achieve 1,236 GW of clean capacity by 2030, thereby increasing the demand for orchestration software that can effectively modulate distributed solar and wind output.[1]European Commission, “REPowerEU Plan,” europa.eu Grid operators now classify VPPs as essential, not optional, infrastructure because they defer investment in spinning reserve while meeting reliability standards. The International Energy Agency foresees renewables providing 85% of global electricity by 2050, implying decades of sustained VPP roll-outs.
Shift from Centralized to Distributed Generation
As distributed-generation costs undercut those of conventional plants, utilities confront coordination challenges that virtual power plant market platforms uniquely address. Germany hosts more than 1.7 million DER installations whose aggregated flexibility is needed to stabilize frequency and voltage. In the United States, FERC Order 2222 enables DER portfolios to bid directly into wholesale markets, generating new revenue streams for asset owners.[2]Federal Energy Regulatory Commission, “Order 2222,” ferc.gov Because mixed resources can delay costly transmission upgrades, utility procurement teams prioritize projects that bundle demand response, solar, and storage within a single control architecture. This distributed model scales the quickest when regulators provide standardized interconnection pathways.
Government Incentives for Demand Response Programs
Public-sector spending accelerates growth by lowering customer payback periods. The U.S. Department of Energy earmarked USD 3.5 billion in 2024 for demand-response and VPP deployments, a direct subsidy that moved several projects from pilot to commercial stage.[3]U.S. Department of Energy, “Grid-Enhancing Technologies Funding,” energy.gov New York’s Value of Distributed Energy Resources tariff allows residential participants to earn up to USD 2,000 per year through VPP enrollment. Europe’s Clean Energy Package compels member states to open markets to aggregation, aligning revenue models across borders. These measures streamline customer onboarding and reduce financing risk for project developers.
Falling Battery-Storage Costs
Average lithium-ion prices fell 14% in 2024 to USD 139 per kWh, validating the economics behind behind-the-meter storage for grid-service applications. Affordable batteries enable virtual power plant market operators to dispatch clean capacity during system peaks, capturing premium ancillary service fees. Tesla’s Megapack installations showcase standardized units that compress construction schedules while improving cycle life. Lower costs also broaden participation to small commercial sites, enlarging the addressable resource pool.
Restraints Impact Analysis of Virtual Power Plant (VPP) Market*
| Restraint | (~) % Impact on CAGR Forecast | Geographic Relevance | Impact Timeline |
|---|---|---|---|
| Cyber-security and data-privacy risks | -3.3% | Global, with heightened concerns in critical infrastructure | Short term (≤ 2 years) |
| Regulatory fragmentation and grid-code complexity | -2.8% | North America state-level, EU member state variations | Medium term (2-4 years) |
| EMF/RF exposure concerns | -2.2% | EU precautionary principle, select U.S. municipalities | Long term (≥ 4 years) |
| DER device data-interoperability limitations | -1.7% | Global, with standards development ongoing | Medium term (2-4 years) |
| Source: Mordor Intelligence | |||
Cyber-security and Data-Privacy Risks
Virtual power plant market platforms expand cyber-attack surfaces, as hackers can exploit aggregated control paths to disrupt grid stability. NIST classifies VPPs as high-priority assets within its Smart Grid Cybersecurity Framework.[4]National Institute of Standards and Technology, “Cybersecurity Framework for Smart Grid,” nist.gov The 2024 cyber-incident that impacted Ukrainian distribution networks underscored systemic vulnerabilities when DER command signals are compromised. Compliance with NERC CIP in North America and GDPR in Europe now demands encrypted data flows, segmented networks, and continuous monitoring—all of which add cost and prolong deployment timelines. Smaller aggregators may struggle with the overhead, favoring larger vendors that can certify advanced security controls.
Regulatory Fragmentation and Grid-Code Complexity
Diverse interconnection rules and market-participation criteria hamper scaling across jurisdictions. In the United States, wholesale oversight rests with FERC while distribution grids fall under state regulators, resulting in patchwork requirements that inflate engineering costs.[5]Federal Energy Regulatory Commission, “Order 2023,” ferc.gov Europe faces similar cross-border discrepancies despite EU-level directives, compelling VPP software vendors to customize their solutions for each transmission system operator. IEEE 1547 revisions aim to harmonize DER technical standards, yet utility adoption schedules vary widely, prolonging uncertainty for investors. This fragmented landscape limits the rapid replication of successful business models.
*Our forecasts treat driver/restraint impacts as directional, not additive. The impact forecasts reflect baseline growth, mix effects, and variable interactions.
Virtual Power Plant (VPP) Market Segment Analysis
By Technology:
Mixed-Asset Platforms Accelerate Revenue StackingDemand-response solutions held a 56.20% market share in the virtual power plant (VPP) market in 2025, thanks to their long-standing relationship with utilities. However, mixed-asset platforms are projected to post a 29.42% CAGR to 2031, reflecting growing operator preference for integrated portfolios that simultaneously bid demand reduction, solar output, and battery discharge into multiple markets. In value terms, mixed-asset deployments are expected to surpass USD 6.28 billion by 2031, underscoring utility demand for versatile resources.
Early adopters highlight the upside. Tesla’s Autobidder orchestrates more than 3 GW of storage, solar, and flexible loads, shifting assets automatically among energy, capacity, and ancillary-service products for margin maximization. Utilities increasingly issue performance-based contracts that reward such multi-service operations, reinforcing mixed-asset momentum. Meanwhile, pure demand-response aggregators are retooling platforms to onboard battery fleets to remain competitive.


By Offering:
Software Surges While Hardware Remains FoundationalHardware accounted for 54.10% of the virtual power plant market size in 2025, encompassing advanced inverters, smart meters, gateway controllers, and secure communications modules. Software revenues are forecast to grow at a 27.23% annual rate through 2031, thanks to AI-driven dispatch algorithms that enhance asset utilization and trader bid accuracy.
Competitive positioning now hinges on proprietary analytics that predict price volatility, customer behavior, and device availability in sub-second intervals. Enel X’s DER.OS, for instance, leverages machine learning to improve dispatch profitability by 12% over rule-based strategies, according to internal performance audits. Services—covering integration, maintenance, and market operations—form a smaller but rapidly growing share as utilities outsource end-to-end VPP management rather than building in-house expertise.
By Power Source:
Renewables and Storage Lead Capacity AdditionsRenewable resources—chiefly rooftop and community solar—supplied 41.10% of aggregated power in 2025, and they are on track for a 27.73% CAGR to 2031 as cost curves for photovoltaic modules continue to decline. Energy-storage assets follow, with battery systems now embedded in more than 60% of new residential DER enrollments. The combined renewables-plus-storage model ensures dispatchability, enabling VPP portfolios to participate in premium fast-frequency markets.
IRENA estimates utility-scale solar levelized costs at USD 0.048 per kWh in 2024, down 6% year over year, allowing solar-centric VPPs to bid energy at competitive rates while earning ancillary service premiums. Combined heat-and-power units remain a niche but important contributor, particularly at industrial sites that require both steam and reliable electricity, delivering base-load flexibility during price spikes.
By End User:
Residential Momentum Challenges Industrial DominanceIndustrial facilities retained 43.10% of 2025 revenue, given their large curtailable loads and sophisticated controls. Yet residential enrollments are forecast to outpace all other segments at a 28.07% CAGR, driven by smart-home devices and rooftop solar adoption. The virtual power plant industry now bundles home batteries, EV chargers, and smart thermostats to unlock value with minimal manual intervention.
Sunrun’s GridServices program aggregates more than 25,000 home batteries, supplying California utilities with 300 MW of peak capacity under pay-for-performance contracts that collectively generate USD 750 million in grid-service revenues over a 10-year term. Commercial buildings sit between the two extremes, leveraging building-management systems to earn flexibility payments without disrupting occupant comfort.
Geography Analysis
Pacific and Northeastern United States Virtual Power Plant (VPP) Market
North America continues to anchor the virtual power plant market at 36.20% share, owing to synchronized wholesale rules and a broad base of customer-sited DERs. California alone operates more than 2.5 GW of aggregated capacity through programs backed by Tesla, Sunrun, and Enphase, providing flexible support during summer heat waves. Texas follows with merchant models inside ERCOT, where aggregators can stack energy and ancillary-service income without utility mediation. Northeast states channel rate-payer funds into demand response, widening resource pools beyond air-conditioning control to include residential batteries and EV fleets.
APAC Virtual Power Plant (VPP) Market
Asia-Pacific’s 28.05% forecast CAGR derives from intensive public investment in grid modernization. China’s State Grid is coordinating with 12 pilot provinces to integrate 50 GW of DERs by 2030, relying on domestic battery manufacturers for cost-effective storage solutions. Australia’s National Electricity Market reforms open frequency-control ancillary service segments to aggregated rooftop systems, converting households into microgenerators. Japan’s Ministry of Economy, Trade, and Industry subsidizes VPP platforms that can deliver at least 4,000 MWh of balancing energy annually, motivated by post-Fukushima resilience priorities.
Broader European Markets
Europe benefits from high renewable energy penetration and supportive EU-wide policies, yet divergent national standards temper the pace. Germany’s Next Kraftwerke orchestrates a 10 GW portfolio, exemplifying the commercial potential when market rules are transparent. The United Kingdom incentivizes fast-response flexibility through its Dynamic Containment market, enabling aggregators to earn up to GBP 17 per MW per hour for sub-second responses. France and Spain expand smart-meter coverage, delivering the telemetry backbone necessary for mass-market VPP enrollments.

Competitive Landscape
The virtual power plant market exhibits moderate concentration, with top players holding roughly 40% combined share across major regions. Legacy grid-equipment vendors—ABB, Siemens, and General Electric—capitalize on existing utility relationships to bundle DER management software with proven hardware, thus mitigating integration risk for cautious buyers. Software-first challengers, such as Tesla’s Autobidder and Enel X’s DER.OS, Next Kraftwerke, and Voltus differentiate on algorithmic dispatch that monetizes volatility in real-time markets.
Strategic themes center on AI and machine learning to optimize asset performance across multiple revenue channels. Tesla claims its predictive models improve revenue capture by 25% compared to deterministic schedules, a figure validated in ERCOT back-tests. Partnership activity is accelerating: Enel X teamed with Google in September 2024 to pool 1 GW of flexible load from data centers, marking the largest corporate VPP globally. Consolidation also shapes the landscape; Next Kraftwerke’s acquisition of Limejump expanded its European capacity to 6 GW, illustrating the benefits of scale economics in terms of trader access and regulatory compliance.
White-space opportunities persist in residential aggregation and emerging markets. Blockchain-enabled peer-to-peer trading platforms, such as Bamboo Energy, seek to bypass utility intermediaries while still providing balancing capacity to system operators. Providers that can satisfy rigorous cybersecurity audits and adapt quickly to shifting grid codes are likely to capture outsized growth as commercial deployments surpass pilots.
Virtual Power Plant (VPP) Industry Leaders
ABB, Ltd.
Next Kraftwerke GmbH
Siemens AG
Next Kraftwerke GmbH
Schneider Electric SE
- *Disclaimer: Major Players sorted in no particular order
Virtual Power Plant (VPP) Market Companies Covered in this Report
- ABB Ltd.
- Tesla Inc. (Autobidder)
- Uplight, Inc.
- Next Kraftwerke GmbH
- Enel X S.r.l.
- Flexitricity Ltd.
- General Electric Co.
- Hitachi Energy Ltd.
- AGL Energy Ltd.
- Centrica Business Solutions Ltd.
- CPower Energy Management LLC
- Engie SA
- RWE AG (Virtual Capacities)
- Doosan GridTech Inc.
- Siemens AG (DEMS/VPP)
- Wartsila Corp. (GEMS)
- EDF Group (Powershift)
- NTT FACILITIES Inc.
- Sunrun Inc. (Brightbox VPP)
- Swell Energy Inc.
- Voltus Inc.
- Kiwi Power Ltd.
- Bamboo Energy S.L.

Recent Industry Developments in Virtual Power Plant (VPP) Market
- May 2025: NRG Energy acquired a commercial and industrial virtual power-plant platform from LS Power, doubling generation capacity to 25 GW and adding 6 GW of aggregation covering 2,000 CandI customers in the United States.
- March 2025: Pacific Gas and Electric launched the Seasonal Aggregation of Versatile Energy (SAVE) program, connecting 1,500 residential batteries and 400 smart panels to support summer peak reliability, with 60% enrollment from low-income households.
- November 2024: Enpal and joint-venture Flexa invested EUR 100 million (USD 107 million) to build a multi-GW VPP across 80,000 customers in Germany.
- November 2024: NRG Energy partnered with Renew Home to create a 1 GW AI-driven VPP in Texas by spring 2025, distributing smart thermostats for grid-responsive cooling.


Virtual Power Plant (VPP) Market Report Scope and Research Methodology
Market Definition and Coverage
Mordor Intelligence defines the virtual power plant (VPP) market as the revenue earned from software platforms, control hardware, and value-added services that digitally aggregate distributed energy resources, solar PV, wind micro-turbines, battery storage, combined heat and power sets, electric vehicles, and flexible loads, so they transact as a single, dispatchable power unit. The figures include only first-sale income from VPP enablement; recurring retail tariffs, stand-alone batteries, or traditional demand-response contracts operated without an aggregation platform are not counted.
Scope exclusion: behind-the-meter battery sales unconnected to a VPP platform remain outside this study.
Segments Covered in This Report
- By Technology
- Demand Response
- Distributed Generation
- Mixed Asset
- By Offering
- Hardware
- Software
- Services
- By Power Source
- Renewables
- Energy Storage
- Combined Heat and Power (CHP)
- Other Local Generation (Fuel-cells, Battery etc.)
- By End-User
- Residential
- Commercial
- Industrial
- By Geography
- North America
- United States
- Canada
- Mexico
- Europe
- Germany
- United Kingdom
- France
- Italy
- Spain
- Russia
- Rest of Europe
- Asia-Pacific
- China
- India
- Japan
- South Korea
- Australia and New Zealand
- Rest of Asia-Pacific
- South America
- Brazil
- Argentina
- Rest of South America
- Middle East and Africa
- Saudi Arabia
- United Arab Emirates
- South Africa
- Egypt
- Rest of Middle East and Africa
- North America
Data Sources, Market Sizing, and Validation
Desk Research
We began by mapping public domain datasets that anchor the DER landscape: International Energy Agency renewable additions, U.S. EIA Form 860 capacity filings, Eurostat smart-meter rollouts, and China NEA distributed PV statistics. Supplementary insights came from trade association white papers such as Smart Electric Power Alliance briefs, DOE FERC Order 2222 filings, and peer-reviewed work in Applied Energy that quantifies VPP response rates. To enrich company-level revenue splits, we accessed D&B Hoovers and Dow Jones Factiva, while patent clustering around VPP orchestration algorithms was sampled through Questel.
These sources illustrate the breadth of factual signals consulted; many other domain articles, investor decks, tenders, and grid tariff notices were reviewed to complete secondary validation.
Primary Research
Mordor analysts interviewed VPP platform operators, grid planners, distributed asset OEMs, and energy traders across North America, Europe, and Asia-Pacific. Discussions clarified platform pricing logic, asset participation thresholds, and typical availability factors, enabling us to cross-check adoption curves suggested by desk research.
Market-Sizing & Forecasting
A top-down reconstruction starts from installed DER megawatts and average platform participation rates, which are then monetized through prevailing orchestration software fees and gateway hardware prices. Bottom-up spot checks, supplier roll-ups, and sampled contract ASP × volume feed back into the model to fine-tune totals. Key variables include annual DER capacity additions, battery cost per kWh, smart-meter penetration, frequency regulation clearing prices, and FERC 2222 participation timelines. Multivariate regression coupled with scenario analysis projects how these drivers shape revenue through 2030; gaps in bottom-up estimates are bridged by region-specific uptake ratios verified in interviews.
Data Validation & Update Cycle
Outputs pass a three-layer review: automated variance flags, analyst peer checks, and final sign-off by a senior reviewer. Models refresh every twelve months, with mid-cycle revisions triggered by material policy or technology cost shifts. Before report delivery, an analyst re-runs the latest inputs so clients receive an up-to-date baseline.
How Mordor Intelligence's Virtual Power Plant (VPP) Market Size Compares to Other Published Estimates
Published market estimates frequently diverge because firms choose different asset scopes, base years, and currency conversions. Our disciplined definition focuses on first-sale enablement revenue and aligns drivers with grid interconnection rules, removing noise from hardware sales that never reach an aggregation platform.
Key gap drivers versus other publishers include: (a) some tally only software or only demand-response assets, (b) others freeze exchange rates or apply uniform capacity factors, and (c) update cycles stretching beyond two years that miss rapid battery cost declines.
Benchmark comparison
| Market Size | Anonymized source | Primary gap driver |
|---|---|---|
| USD 6.65 B (2025) | Mordor Intelligence | - |
| USD 5.01 B (2024) | Global Consultancy A | Omits EV chargers and uses earlier base year, understating growth surge |
| USD 1.90 B (2024) | Industry Association B | Counts only software fees, excludes gateway hardware and services |
| USD 1.86 B (2024) | Trade Journal C | Covers 25 countries rather than global, leading to lower aggregate value |
Across these comparisons, the Mordor approach delivers a balanced, transparent baseline grounded in clearly stated asset boundaries, annually refreshed cost curves, and corroborated adoption ratios, giving decision-makers a dependable starting point for strategy.


Key Questions Answered in the Report
How large is the virtual power plant market in 2026?
The virtual power plant market size is valued at USD 5.01 billion in 2026 and is forecast to grow rapidly through 2031.
Which technology segment is expanding fastest?
Mixed-asset platforms that coordinate demand response, storage, and renewable generation are projected to grow at a 29.42% CAGR to 2031.
Why is Asia-Pacific recording the highest growth rate?
Aggressive grid-modernization spending and national VPP pilots in China and Australia drive a 28.05% CAGR across the region.
What role do falling battery prices play?
A 14% drop in lithium-ion costs during 2024 made storage-enabled VPPs economically attractive, boosting adoption among residential and commercial users.
Which companies lead current deployments?
Tesla, Enel X, ABB, Siemens, and Next Kraftwerke collectively control about 40% of installed VPP capacity worldwide.
How do regulations influence market expansion?
Policies such as FERC Orders 2222 and 2023, along with the EU Clean Energy Package, provide standardized pathways for DER aggregation, accelerating project approvals.
Page last updated on:


