Robo-advisory Services Market Size and Share
Market Overview
| Study Period | 2020 - 2031 |
|---|---|
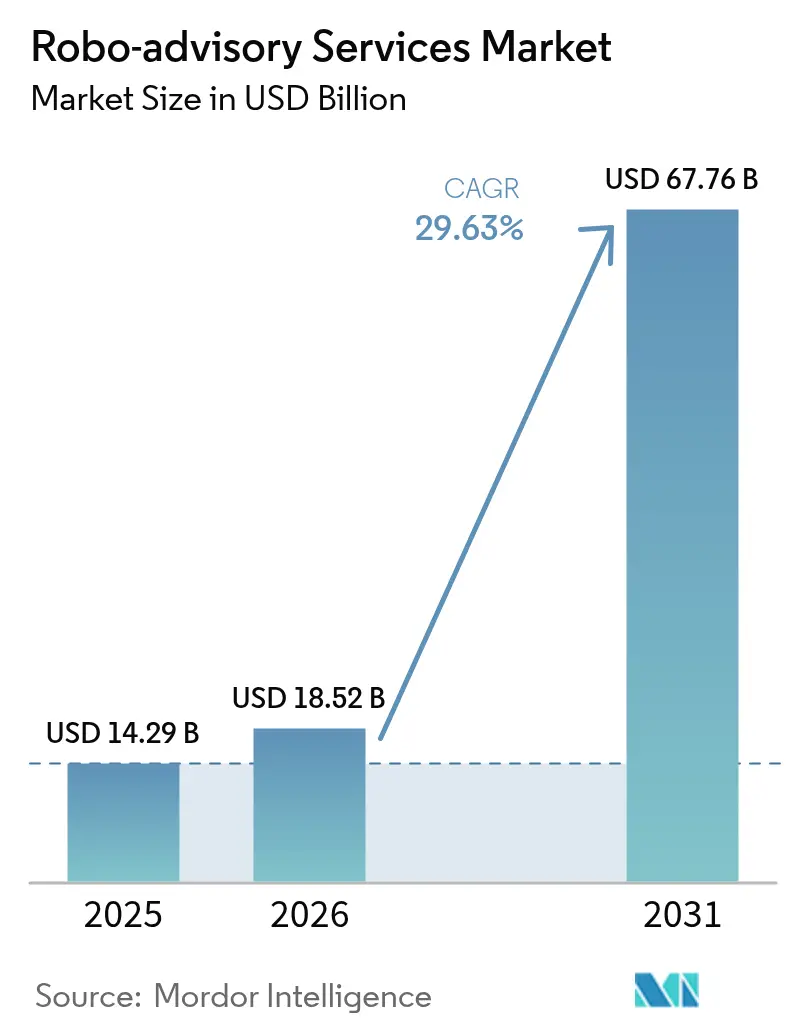
| Market Size (2026) | USD 18.52 Billion |
| Market Size (2031) | USD 67.76 Billion |
| Growth Rate (2026 - 2031) | 29.63% CAGR |
| Fastest Growing Market | Asia Pacific |
| Largest Market | North America |
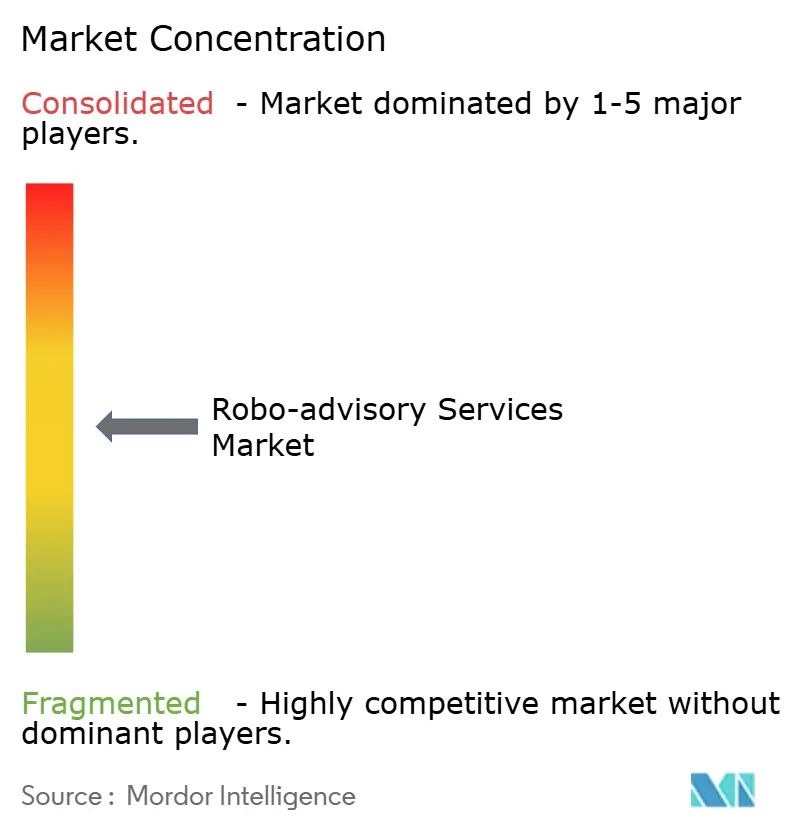
| Market Concentration | Medium |
Major Players *Disclaimer: Major Players sorted in no particular order Image © Mordor Intelligence. Reuse requires attribution under CC BY 4.0. | |
Robo-advisory Services Market Analysis by Mordor Intelligence
Robo Advisory Services market size in 2026 is estimated at USD 18.52 billion, growing from 2025 value of USD 14.29 billion with 2031 projections showing USD 67.76 billion, growing at 29.63% CAGR over 2026-2031. Rapid artificial-intelligence improvements, pro-digital regulatory updates, and the ongoing global wealth transfer from Baby Boomers to younger, tech-native cohorts power growth. Algorithm-driven portfolio construction, real-time tax optimization, and embedded-finance distribution models now compete directly with traditional advisors. Platforms are also differentiating through hyper-personalization features that translate spending, income, and behavioral data into timely portfolio nudges. Meanwhile, regulatory clarity in North America and Europe is spurring institutional adoption, while Asia-Pacific benefits from sandbox frameworks that lower go-to-market barriers.
Key Report Takeaways
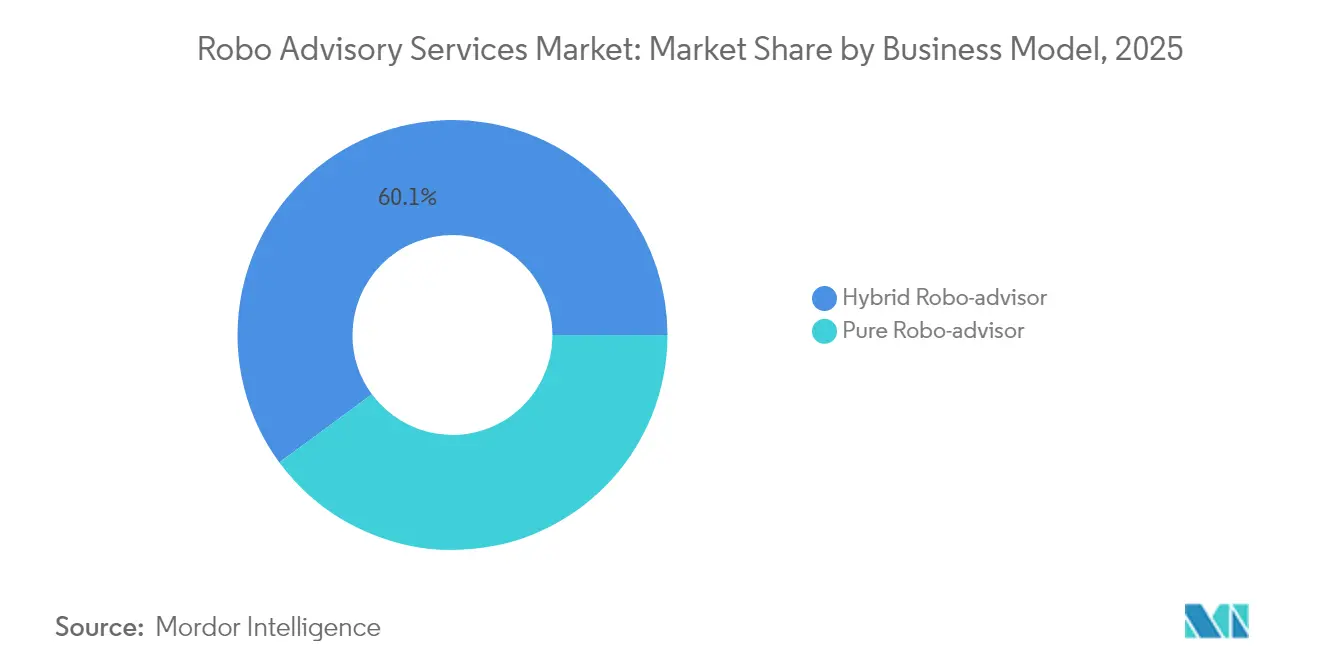
- By business model, hybrid platforms led with 60.10% of the robo-advisory services market share in 2025, while pure-play models are on track for the fastest 34.35% CAGR to 2031.
- By service type, wealth-management functions controlled 38.15% revenue in 2025; tax-loss harvesting is forecast to post a 33.20% CAGR through 2031.
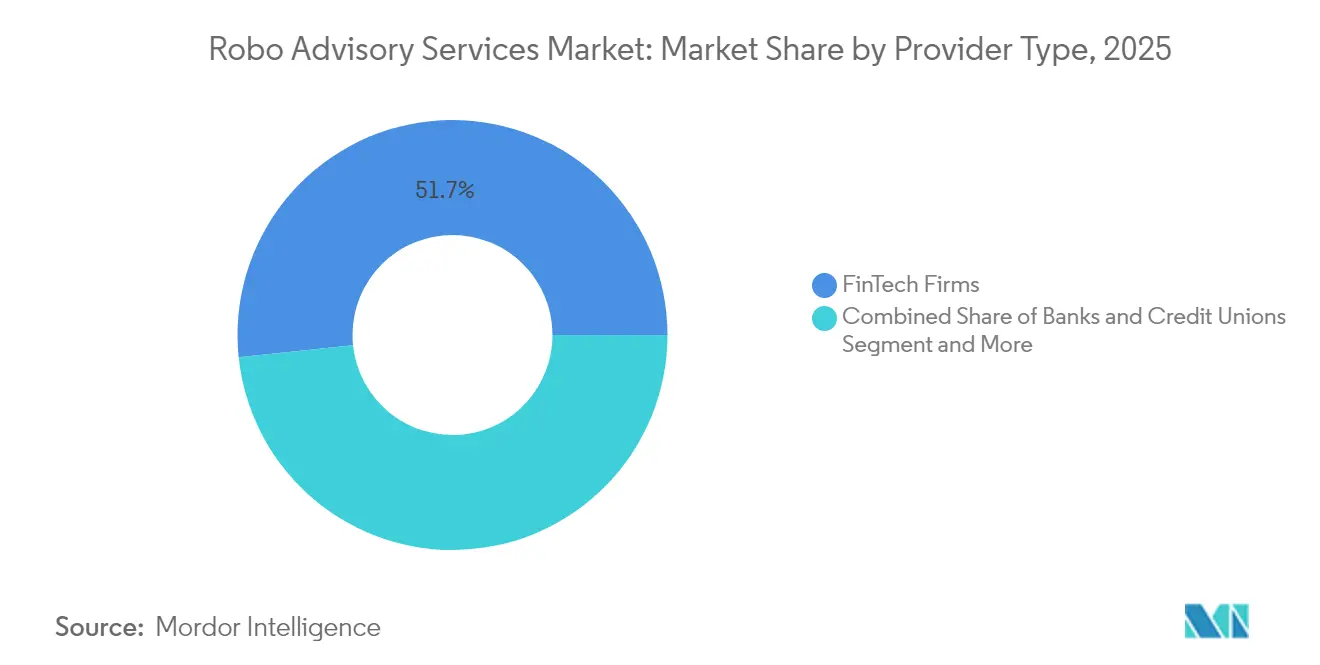
- By provider type, fintech innovators held 51.65% of 2025 revenue, whereas banks and credit unions are expanding at a 34.40% CAGR to 2031.
- By end-user, high-net-worth clients accounted for 54.60% of 2025 demand, yet the retail segment is accelerating at a 33.10% CAGR to 2031.
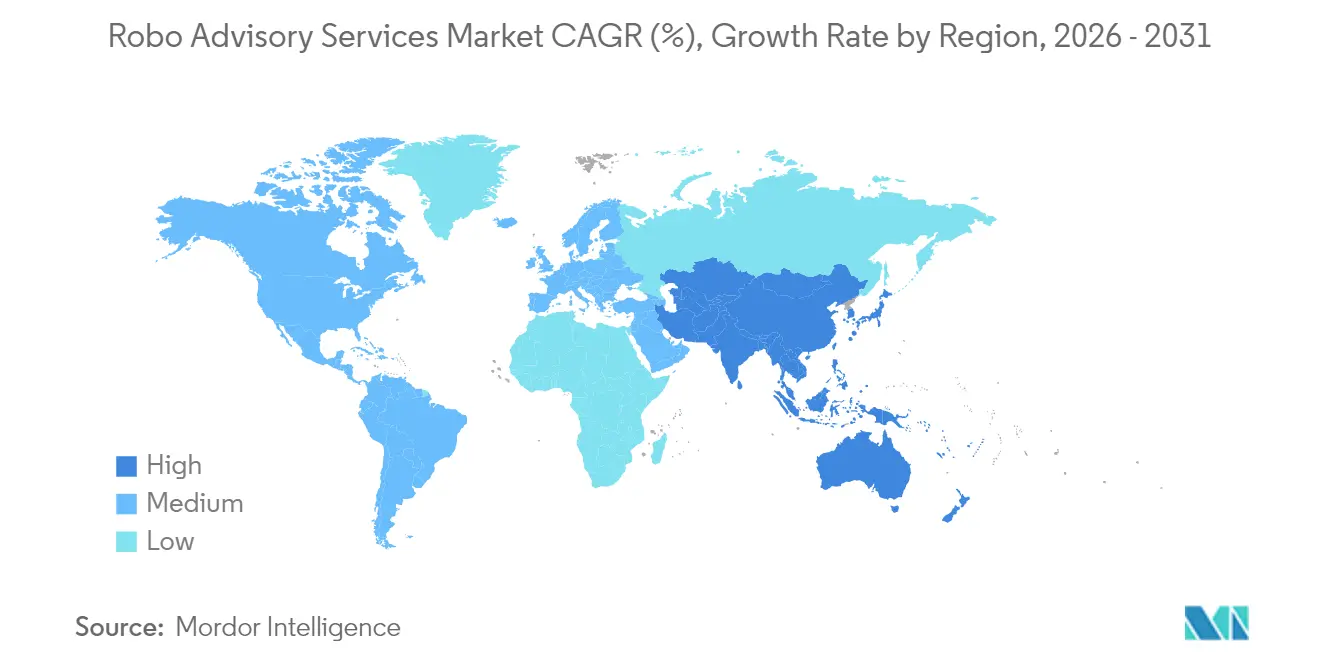
- By geography, North America commanded 37.75% revenue in 2025, but Asia-Pacific is advancing at a 32.90% CAGR to 2031.
Note: Market size and forecast figures in this report are generated using Mordor Intelligence’s proprietary estimation framework, updated with the latest available data and insights as of 2026.
Global Robo-advisory Services Market Trends and Insights
Drivers Impact Analysis*
| Driver | (~) % Impact on CAGR Forecast | Geographic Relevance | Impact Timeline |
|---|---|---|---|
| Digitisation of the BFSI industry | +8.2% | Global, with acceleration in APAC and Europe | Medium term (2-4 years) |
| Cost-efficiency in personal finance management | +6.5% | North America and EU core, expanding to emerging markets | Short term (≤2 years) |
| Growing millennial and Gen-Z preference for DIY investing | +7.8% | Global, with highest impact in North America and APAC | Long term (≥4 years) |
| AI-powered hyper-personalised nudges boost engagement | +5.1% | Developed markets initially, scaling to emerging markets | Medium term (2-4 years) |
| Embedded robo-advice within payroll/benefits platforms | +3.4% | North America and Europe, with corporate adoption focus | Long term (≥4 years) |
| Source: Mordor Intelligence | |||
Digitisation of the BFSI industry
Cloud-native infrastructure and API-driven architectures are enabling banks to plug robo modules into legacy cores without wholesale rewrites. JPMorgan’s AI-based cash-management tool cut manual processing by 90% for 2,500 clients, proving scalability for algorithmic advice.[1]J.P. Morgan, “Siemens Treasury Digital Transformation Case Study,” jpmorgan.com Siemens Treasury’s digital migration shaved USD 20 million in yearly costs, underscoring how programmable payments and blockchain rails support real-time rebalancing. Europe’s ESMA has issued AI guidance that clarifies compliance guardrails, fostering institutional uptake.
Cost-efficiency in personal finance management
Automated portfolios typically charge 0.25–0.50% versus 1–2% at traditional firms, a spread that unlocked more than USD 1 trillion in global robo assets in 2025.[2]BlackRock, “Weathering Market Volatility With Loss Harvesting,” blackrock.com Betterment’s tiered model illustrates margin leverage: the firm manages USD 50 billion while passing efficiency gains to users. BlackRock’s Aperio platform executed 1.3 million trades and harvested USD 164 million in tax losses, turning algorithmic speed into after-tax alpha.
Growing millennial and Gen-Z preference for DIY investing
Forty-one percent of investors under 40 are comfortable delegating to AI, against 14% of Boomers. The USD 68 trillion inter-generational wealth transfer will therefore favor automated channels. Robinhood’s acquisition of AI start-up Pluto and its SEC-registered RIA application show incumbents reshaping to capture this audience.[3]Robinhood, “Robinhood Completes Acquisition of TradePMR,” robinhood.com
AI-powered hyper-personalised nudges boost engagement
BlackRock’s “Asimov” virtual analyst reads filings, research, and emails to surface investment insights in natural language. PortfolioPilot reached USD 20 billion AUM in two years by tailoring prompts to each user’s cash-flow profile. Predictive analytics now anticipate contribution gaps and suggest catch-up moves, increasing retention and wallet share.
Restraints Impact Analysis*
| Restraint | (~) % Impact on CAGR Forecast | Geographic Relevance | Impact Timeline |
|---|---|---|---|
| Lack of human touch and empathy | -4.2% | Global, with higher impact in relationship-focused cultures | Long term (≥ 4 years) |
| Regulatory and fiduciary uncertainty across regions | -3.8% | Fragmented across jurisdictions, highest in emerging markets | Medium term (2-4 years) |
| Algorithmic-bias risk creating compliance liabilities | -2.1% | Global, with stricter enforcement in EU and North America | Medium term (2-4 years) |
| Source: Mordor Intelligence | |||
Lack of human touch and empathy
Only 5% of U.S. investors currently rely on a robo despite lower fees, highlighting the emotional gap that algorithms still cannot bridge.[4]Financial Planning Association, “Customer Trust and Satisfaction With Robo-Adviser Technology,” financialplanningassociation.orgDuring downturns, attrition rises as clients crave reassurance. Hybrid models that bundle CFP access—such as Betterment Premium—help but add cost overhead.
Regulatory and fiduciary uncertainty across regions
The SEC’s 2025 Internet Adviser Rule restricts exemptions to firms that serve clients exclusively via interactive websites, raising compliance budgets. FinCEN’s 2026 AML directive will further lift cost structures. Europe’s AI guidelines under MiFID II require bias testing and explainability, complicating cross-border scaling.
*Our forecasts treat driver/restraint impacts as directional, not additive. The impact forecasts reflect baseline growth, mix effects, and variable interactions.
Segment Analysis
By Business Model: Hybrid Dominance Drives Market Maturation
Hybrid advisers captured 60.10% of 2025 revenue, equal to the largest single slice of robo-advisory services market share, while pure robos are expanding at a 34.35% CAGR. Investors gravitate to the hybrid promise of low-cost efficiency with a human backstop during volatility.
Platforms increasingly segment by life stage rather than wealth tier. Robinhood’s upcoming plain-vanilla robo uses algorithms for allocation but retains human security selection, illustrating a nuanced blend that meets SEC expectations and user comfort levels.


By Service Type: Tax Optimization Emerges as Growth Catalyst
Wealth management services retained 38.15% of 2025 spending, representing the largest slice of the robo-advisory services market size at USD 5.45 billion. By contrast, tax-loss harvesting is accelerating at 33.20% CAGR, riding investor demand for after-tax alpha.
Direct indexing coupled with automated harvesting can add 1–2 percentage points of net returns. BlackRock’s Aperio success shows that institutional-grade algorithms can now be delivered to affluent retail accounts, locking in loyalty ahead of the 2026 tax-code revisions.
By Provider Type: Banks Accelerate Digital Transformation
Fintechs controlled 51.65% of the 2025 robo-advisory services market, equating to USD 7.38 billion of robo-advisory services market size, yet banks are scaling fastest at 34.40% CAGR. MUFG’s USD 660 million buyout of WealthNavi signals incumbents’ resolve to acquire rather than build.
Goldman Sachs offloaded Marcus Invest accounts to Betterment, suggesting that white-label or partnership models may trump in-house builds for institutions lacking consumer-tech DNA.
By End-user: Retail Democratization Drives Expansion
High-net-worth clients contributed 54.60% of 2025 volume, delivering the single largest contribution to robo-advisory services market share, yet retail demand is climbing at a 33.10% CAGR. Micro-investing features and fractional ETFs help platforms profitably serve accounts under USD 5,000.
Corporate-treasury use cases are emerging as firms automate idle-cash deployment. Capitalize partnered with Schwab and Robinhood to mine 401(k) rollovers worth USD 1.65 trillion, underscoring B2B runway.
Geography Analysis
North America retained 37.75% of global spending in 2025 on the back of regulatory clarity and early-mover platforms such as Betterment and Wealthfront. The region’s shareholder-friendly tax frameworks and high digital-banking penetration sustain premium pricing models despite fierce fee compression.
Europe’s MiFID II ecosystem promotes investor protection and transparency, encouraging cross-border expansion for digital advisers. ESMA’s AI guidelines further standardize algorithmic disclosures, though firms must still reconcile data-privacy obligations country by country. Pan-European platforms like Scalable Capital are localizing language, risk questionnaires, and pension integrations to unlock addressable demand.
Asia-Pacific posts the highest 32.90% CAGR. Regulatory sandboxes in Singapore, Japan, and India let start-ups iterate rapidly, while rising middle-class savings pools drive AUM inflows. Revolut’s Singapore robo launched with only USD 100 minimums, and Syfe’s Hong Kong build-out signals a mass-affluent land grab. MUFG’s WealthNavi acquisition validates the scalability of local champions and paves a path for cross-listing of robo ETFs on the Tokyo Stock Exchange.

Competitive Landscape
The robo-advisory services market remains moderately fragmented, yet consolidation momentum is unmistakable. Heavyweights are pursuing M&A to gain scale that lowers per-account compliance costs. MUFG-WealthNavi, Betterment-Ellevest, and Robinhood-TradePMR deals all closed within one year, signaling a rising premium on integrated custody and advice stacks.
Technology is the primary battleground. BlackRock’s “Asimov” shows how incumbents wield proprietary data to build virtual analysts that extend human teams rather than replace them. Pure-digital challengers such as PortfolioPilot reached USD 20 billion AUM in under 24 months by deploying generative-AI chat interfaces that demystify asset allocation.
Product roadmaps are converging on three differentiators: embedded finance APIs, advanced tax-alpha engines, and behavioral analytics that nudge savings rates. Banks that lack API fluency are opting for white-label partnerships, while fintechs are courting employer-benefit channels to lock in paycheck-linked inflows. Over the forecast horizon, the winners are likely to combine AI personalization, regulatory capital, and multi-channel distribution at a global scale.
Robo-advisory Services Industry Leaders
Vanguard Group Inc.
Charles Schwab & Co. Inc. (Intelligent Portfolios)
Empower Advisory Group Inc. (Personal Capital)
Betterment LLC
Wealthfront Corporation
- *Disclaimer: Major Players sorted in no particular order

Recent Industry Developments
- June 2025: Kristal raised USD 30 million Series B to expand its AI-driven investing engine
- June 2025: BlackRock debuted “Asimov,” an AI virtual analyst for portfolio teams.
- February 2025: Betterment finalized the purchase of Ellevest’s automated-investing arm.
- February 2025: Robinhood closed its TradePMR acquisition, adding USD 40 billion in AUA.
- January 2025: Revolut unveiled robo portfolios in Singapore with a USD 100 minimum.
- November 2024: MUFG agreed to acquire WealthNavi for USD 660 million.


Research Methodology Framework and Report Scope
Market Definitions and Key Coverage
Our study defines the global robo-advisory services market as fee-based, algorithm-driven digital platforms that gather client data online, construct diversified ETF or equity portfolios, rebalance, harvest tax losses, and deliver on-demand reporting while charging asset-linked advisory fees. According to Mordor Intelligence, revenue earned by these platforms is the value we size rather than the underlying assets.
Scope exclusion: Execution-only trading apps and white-label software vendors that license advice engines without managing discretionary portfolios fall outside this scope.
Segmentation Overview
- By Business Model
- Pure Robo-advisor
- Hybrid Robo-advisor
- By Service Type
- Investment Advisory
- Wealth Management
- Retirement Planning
- Tax-loss Harvesting
- Goal-based Planning
- By Provider Type
- FinTech Firms
- Banks and Credit Unions
- Traditional Wealth Managers/Broker-Dealers
- By End-user
- Retail Investors
- High-Net-Worth Individuals (HNWI)
- SMEs and Corporate Treasuries
- By Geography
- North America
- United States
- Canada
- Mexico
- South America
- Brazil
- Argentina
- Chile
- Rest of South America
- Europe
- Germany
- United Kingdom
- France
- Italy
- Spain
- Russia
- Rest of Europe
- Asia-Pacific
- China
- India
- Japan
- South Korea
- Singapore
- Malaysia
- Australia
- Rest of Asia-Pacific
- Middle East and Africa
- Middle East
- Saudi Arabia
- Turkey
- Israel
- Rest of Middle East
- Africa
- South Africa
- Nigeria
- Rest of Africa
- Middle East
- North America
Detailed Research Methodology and Data Validation
Primary Research
Mordor analysts interviewed fintech founders, bank digital-wealth heads, independent advisers, and regulators across North America, Europe, and Asia. Follow-up surveys with retail users confirmed average assets per account, churn patterns, and price tolerance, letting us stress-test each assumption.
Desk Research
We began by mapping the addressable universe through public files such as US SEC Form ADV, FINRA account statistics, European Banking Authority consultation papers, OECD household wealth tables, and Bank for International Settlements payment volumes, which revealed where digital wealth adoption is strongest. Investor presentations, company 10-Ks, and portals like the Investment Company Institute supplied fee ladders and asset migration clues that sharpened initial estimates. Our team then tapped paid repositories, including D&B Hoovers for firm revenues and Dow Jones Factiva for capital raises, to close data gaps. The sources listed are illustrative; many others helped us collect, validate, and clarify numbers.
Market-Sizing & Forecasting
We start with a top-down build that estimates robo assets under management as a share of the global mass-affluent investable pool reconstructed from central-bank tables. We then convert those assets to revenue using blended fee curves. Supplier roll-ups of disclosed AUM multiplied by stated fees act as bottom-up anchors that we reconcile. Key variables include digital adoption penetration, hybrid platform mix, advisory fee compression, account growth velocity, and rule changes such as the SEC Internet Adviser update. Forecasts rely on multivariate regression paired with scenario analysis.
Data Validation & Update Cycle
Outputs pass variance checks against signals like new brokerage accounts and ETF net inflows before a two-stage analyst review. We refresh models each year and issue interim updates whenever material events shift the narrative.
Why Mordor's Robo-advisory Services Baseline Commands Confidence
Published estimates often diverge because firms vary service scope, fee curves, and refresh cadence, yet decision makers still need a dependable number.
Key gap drivers we see include exclusion of hybrid advisers, older base years, static AUM multiples, and linear growth paths that ignore fee erosion; differences our disciplined approach corrects.
Benchmark comparison
| Market Size | Anonymized source | Primary gap driver |
|---|---|---|
| USD 14.29 B (2025) | Mordor Intelligence | |
| USD 10.86 B (2025) | Global Consultancy A | Omits Asia-Pacific emerging platforms and tax-loss services |
| USD 8.47 B (2024) | Trade Journal B | Uses earlier base year and linear growth; hybrid revenues partly excluded |
These contrasts show that our scope choices, dual-path modeling, and annual refresh cycle tie every figure to clear variables and repeatable steps, giving clients a balanced, transparent baseline they can trust.


Key Questions Answered in the Report
What is the projected size of the robo-advisory services market by 2031?
The robo-advisory services market is forecast to reach USD 67.76 billion by 2031 based on a 29.63% CAGR.
Why are hybrid robo-advisors gaining popularity?
Hybrid platforms blend low-fee algorithms with human planners, satisfying investors’ need for emotional reassurance while preserving cost efficiency.
Which service type is growing fastest within robo platforms?
Tax-loss harvesting leads with a 33.20% CAGR as investors prioritize after-tax performance.
How are banks responding to fintech robo competition?
Many are acquiring or partnering with specialists; MUFG’s USD 660 million WealthNavi deal and Goldman Sachs’ transfer of Marcus Invest accounts to Betterment exemplify this shift.
What regulatory changes most affect robo-advisors in 2025?
The SEC’s updated Internet Adviser Rule tightens digital-only exemptions, while FinCEN’s upcoming AML rules will raise compliance costs.
Which regions will grow the fastest?
Asia-Pacific is expected to post the highest 32.90% CAGR through 2031 thanks to fintech sandboxes and rising middle-class investors.
Page last updated on:


