Global Veterinary X-Ray Market Size and Share
Market Overview
| Study Period | 2020 - 2031 |
|---|---|
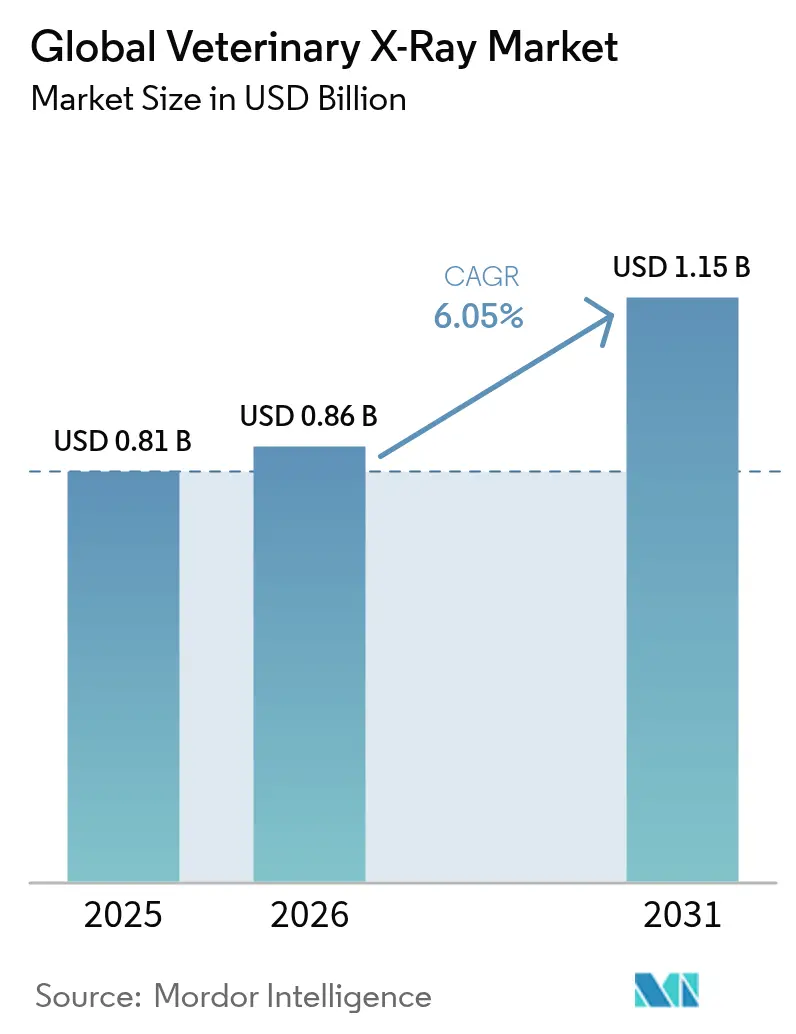
| Market Size (2026) | USD 0.86 Billion |
| Market Size (2031) | USD 1.15 Billion |
| Growth Rate (2026 - 2031) | 6.05% CAGR |
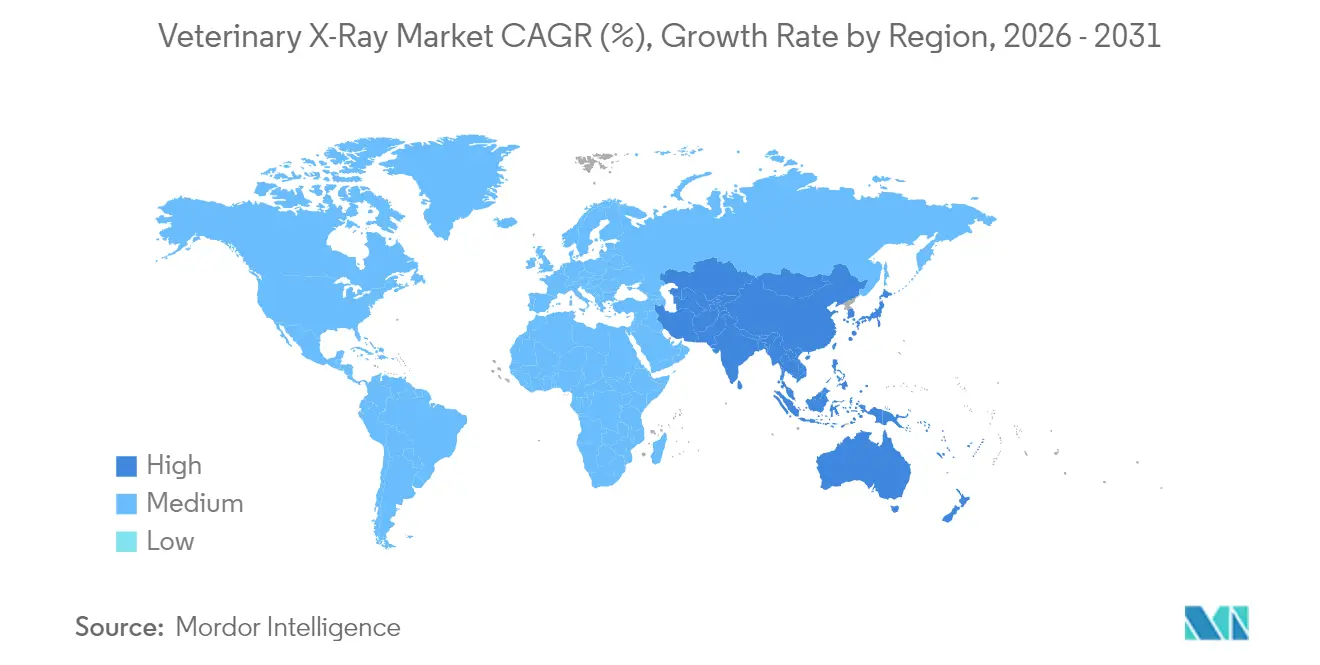
| Fastest Growing Market | Asia Pacific |
| Largest Market | North America |
| Market Concentration | Medium |
Major Players *Disclaimer: Major Players sorted in no particular order Image © Mordor Intelligence. Reuse requires attribution under CC BY 4.0. | |
Global Veterinary X-Ray Market Analysis by Mordor Intelligence
The veterinary X-ray market size in 2026 is estimated at USD 0.86 billion, growing from 2025 value of USD 0.81 billion with 2031 projections showing USD 1.15 billion, growing at 6.05% CAGR over 2026-2031. Growth is propelled by record pet ownership, fast-advancing digital imaging technology, and the spread of well-equipped veterinary facilities in mature and emerging economies alike. North America leads in equipment uptake thanks to a deep installed base and high medicalization, yet Asia-Pacific is expanding fastest as disposable incomes climb and veterinary training capacity widens. Digital radiography’s sharper images and streamlined workflows underpin rapid replacement of legacy film systems, while AI software that flags subtle lesions boosts diagnostic confidence and practitioner productivity. Supply-chain risk tied to Chinese export controls on rare-earth detector materials is the key cost pressure and may favor vendors with diversified sourcing. Workforce shortages—estimated at more than 70,000 veterinarians by 2032—reinforce demand for imaging tools that shave interpretation time and reduce retakes.
Key Report Takeaways
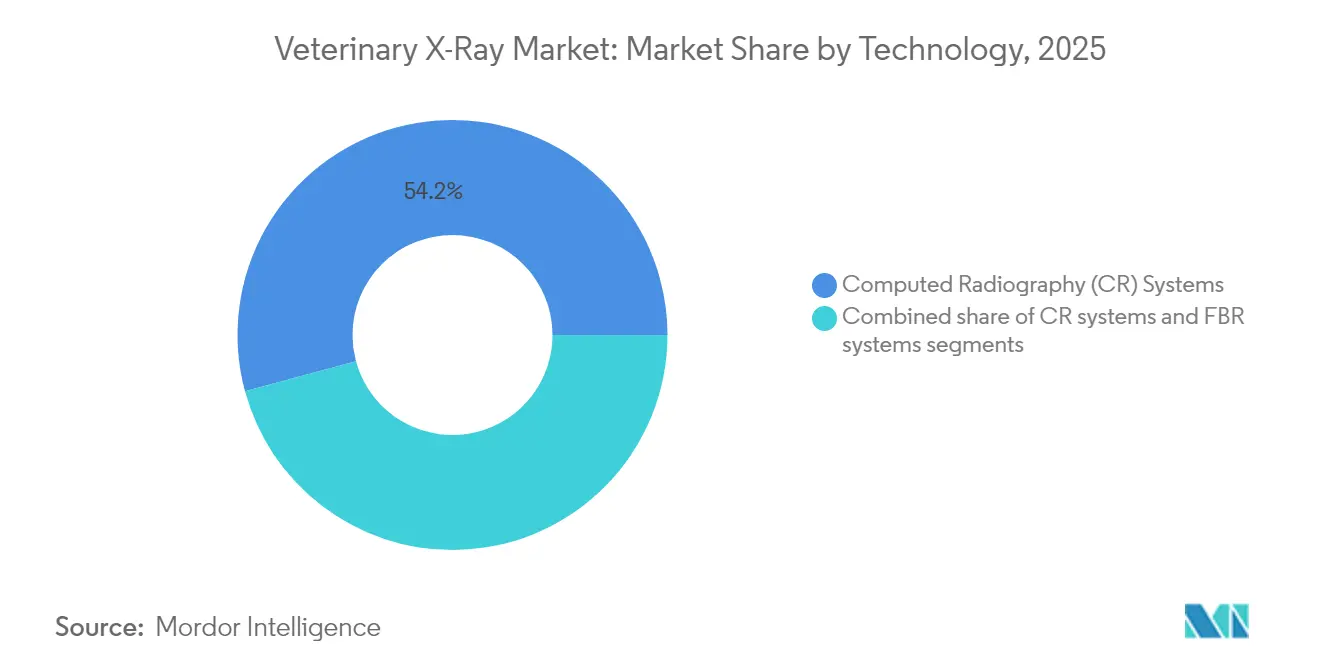
- By technology, Computed Radiography (CR) led with 54.22% of veterinary X-ray market share in 2025, while Direct Radiography (DR) is on track for the quickest 6.78% CAGR to 2031.
- By system type, digital X-ray accounted for 72.35% of revenue in 2025; portable units are forecast to expand at 6.48% CAGR through 2031.
- By animal, small companion species captured 64.58% of 2025 demand; large-animal imaging is growing but at a slower clip.
- By application, orthopedics held 32.10% share of the veterinary X-ray market size in 2025, whereas oncology imaging is advancing at a 6.89% CAGR.
- By end-user, veterinary hospitals comprised 44.15% of purchases in 2025; mobile/field practices record the fastest 6.59% CAGR to 2031.
- By geography, North America generated 39.35% of 2025 revenue; Asia-Pacific is pacing a 6.86% CAGR through 2031.
Note: Market size and forecast figures in this report are generated using Mordor Intelligence’s proprietary estimation framework, updated with the latest available data and insights as of 2026.
Global Veterinary X-Ray Market Trends and Insights
Drivers Impact Analysis*
| Driver | (~) % Impact on CAGR Forecast | Geographic Relevance | Impact Timeline |
|---|---|---|---|
| Increasing pet adoption & animal-health spend | +1.8% | Global, with North America & Europe leading | Medium term (2-4 years) |
| Shift from analog to digital radiography | +1.5% | Global, accelerated in Asia-Pacific | Short term (≤ 2 years) |
| Growing number of veterinary hospitals & clinics | +1.2% | Asia-Pacific core, spill-over to MEA | Long term (≥ 4 years) |
| Rising orthopedic injury incidence in companion animals | +0.9% | North America & EU primarily | Medium term (2-4 years) |
| AI-enabled image-analysis workflows | +0.6% | North America & EU early adoption | Long term (≥ 4 years) |
| Expansion of mobile/field veterinary X-ray services | +0.4% | Global, rural, and underserved areas | Medium term (2-4 years) |
| Source: Mordor Intelligence | |||
Increasing pet adoption and animal-health spend
U.S. households owning pets climbed to 94 million in 2025, with Generation Z over-indexing on multispecies ownership, capturing veterinary mindshare for high-value services. Average visit fees reached USD 190 during 2024[1]American Veterinary Medical Association, “Pet population continues increase while pet spending declines,” avma.org, yet a 4% dip in per-household spend revealed price-sensitivity that favors efficient diagnostics able to trim ancillary costs. Animal lifespans are lengthening through better vaccination and nutrition, prolonging exposure to chronic conditions that often require repeat imaging. Canine orthopedic injuries and feline chronic kidney disease, for instance, mandate serial radiographs for monitoring. Employment in the veterinary profession is growing 19% and adds pressure for equipment that speeds case throughput while maintaining quality. Together these forces enlarge the addressable veterinary X-ray market and reinforce investment in flexible, future-proof platforms.
Shift from analog to digital radiography
Film processing chemicals, dark-room real estate, and lengthy exposure-to-image times make analog systems costly and cumbersome. Direct Radiography delivers images in less than 5 seconds, trimming workflow steps by 50% in many clinics and lowering per-study radiation dose. Retrofit kits let practices convert existing buckys[2]ScienceDirect, “Digital radiography in veterinary practice,” sciencedirect.com to DR at a smaller outlay than full system replacement, softening the cap-ex hurdle. Instant image sharing through cloud PACS boosts teleconsultation and satisfies owners expecting immediate findings. As a result, the veterinary X-ray market is witnessing a CR-to-DR migration curve comparable to human radiology’s transition a decade earlier.
Growing number of veterinary hospitals and clinics
Asia-Pacific governments are funding new veterinary colleges and subsidizing rural clinics to enhance animal-health coverage, creating an equipment replacement wave. India added more than 150 accredited veterinary campuses between 2022 and 2025, each requiring teaching labs equipped with multi-modal imaging suites. Corporate consolidation among U.S. and European clinic chains further lifts demand, because chain operators standardize equipment fleets to simplify training and maintenance. The ripple extends to the portable segment as satellite locations and home-visit divisions need compact flat-panel detectors. This clinic boom underpins a durable mid-term lift in the veterinary X-ray market even as mature economies move toward upgrade cycles.
AI-enabled image-analysis workflows
Roughly 30% of small-animal veterinarians now deploy AI tools for chest and abdominal studies, citing reduced retakes and faster reports[3]Journal of the American Veterinary Medical Association, “Position statement on AI in veterinary imaging,” avmajournals.avma.org . Algorithms detect subtle pulmonary nodules and early hip dysplasia, which can be overlooked in busy practices. IDEXX’s CancerDx platform launched in 2025 for lymphoma screening exemplifies commercial AI potential. Regulatory bodies still urge rigorous validation, yet early adopters report 10-minute shorter interpretation times per study. As workforce shortages deepen, AI’s incremental gains translate into tangible clinic revenue and entrench its role as a growth catalyst for the veterinary X-ray market.
Restraints Impact Analysis*
| Restraint | (~) % Impact on CAGR Forecast | Geographic Relevance | Impact Timeline |
|---|---|---|---|
| High upfront cost of digital X-ray equipment | -1.4% | Global, acute in emerging markets | Short term (≤ 2 years) |
| Absence of reimbursement for imaging procedures | -1.1% | Global, severe in developing countries | Medium term (2-4 years) |
| Shortage of trained veterinary radiologists | -0.8% | Global, severe in North America | Long term (≥ 4 years) |
| Dependency on rare-earth flat-panel components | -0.5% | Global, concentrated in Asia-Pacific supply chains | Medium term (2-4 years) |
| Source: Mordor Intelligence | |||
High upfront cost of digital X-ray equipment
Premium DR suites approach USD 100,000 when detectors, acquisition software, and radiation-safety features are bundled, deterring single-doctor practices from upgrading. Only 28.2% of pet owners regard current veterinary prices as satisfactory, limiting clinics’ ability to pass equipment costs through service fees. Financing programs and manufacturer lease-to-own models soften sticker shock, but slower equipment turnover in developing economies drags adoption. As a result, the veterinary X-ray market occasionally sees extended use of legacy CR units beyond their optimal life, constraining the broader digital transition.
Shortage of trained veterinary radiologists
Residency capacity has not kept pace with imaging complexity, leaving many practices to rely on generalists who may lack advanced interpretation skills. Survey data show 43% of U.S. veterinary technician programs face declining enrollment[4]LR Kogan, “Trends in enrollment, retention, and graduation of United States veterinary technicians/nurses schools,” Frontiers in Veterinary Science, frontiersin.org because wages lag training costs. Tele-radiology networks offer stop-gap coverage, yet turnaround time can stretch when global caseload spikes. The bottleneck slows full utilization of sophisticated detectors and AI modules, modestly capping the attainable CAGR for the veterinary X-ray market.
*Our forecasts treat driver/restraint impacts as directional, not additive. The impact forecasts reflect baseline growth, mix effects, and variable interactions.
Segment Analysis
By Technology: CR systems face DR disruption
In 2025, CR platforms commanded 54.22% of the veterinary X-ray market share in 2025, reflecting their entrenched presence and relatively low capital outlay. The segment nevertheless inches toward saturation as DR systems gain 6.78% CAGR on image clarity and sub-5-second exposure-to-review cycles. Many clinics extend CR service life by buying retrofit cassettes, but decreasing component costs are expected to swing preference fully toward DR by 2028. The veterinary X-ray market size for DR is projected to exceed USD 0.69 billion by 2031, underscoring the ascendant trajectory of direct capture technology.
Advances in wireless flat-panel sensitivity now allow dose reductions without granularity loss, satisfying tightened radiation-safety guidelines. Combined with rugged detector housings suitable for barn environments, these innovations progressively eliminate the performance gap between stationary clinic DR and field imaging, accelerating CR displacement worldwide.


By System Type: Digital dominance accelerates
Digital units held 72.35% of the veterinary X-ray market size in 2025 and are tracking a 6.25% CAGR through 2031. That dominance stems from cloud PACS integration, enabling instant referrals and AI overlay compatibility. Analog systems linger mainly in price-sensitive geographies; however, spare-part scarcity and chemical disposal rules compound their operating costs. In 2025, digital solutions make up roughly 85% of new installations across corporate clinic chains in the United States, solidifying their status as the default choice for most facility upgrades. Capital inflows into tele-consult platforms that hinge on high-resolution datasets further enlarge digital’s slice of the veterinary X-ray market.
Looking forward, image-enhancement firmware updates—downloadable over-the-air—extend equipment life and future-proof investments, a selling point unmatched by legacy analog hardware. Vendors bundling AI triage subscriptions with detector sales deepen customer lock-in and generate recurring revenue streams that stabilize total veterinary X-ray market size visibility for shareholders.
By Mobility: Portable systems gain traction
Stationary suites still represented 54.10% of the veterinary X-ray market share in 2025, yet portable configurations are expanding at 6.48% CAGR. Equine and bovine practitioners spearhead adoption; field radiographs prevent costly animal transport and reduce stress for high-value sport horses. Lithium-ion battery packs now power five-hour continuous imaging sessions, while 5G modules upload studies directly to cloud PACS even in rural zip codes. Mobile practices also appeal to urban pet owners who value convenience, translating into sustained order books for portable suppliers. Consequently, the veterinary X-ray market size attributable to portable systems is forecast to surpass USD 0.41 billion by 2031.
Portable DR’s upward curve is reinforced by disaster-response mandates following severe weather events; emergency teams increasingly stock foldable detectors to triage injured companion animals on site. The model diverges from hospital-centric care and embeds radiography deeper into primary field workflows, altering the competitive playbook for manufacturers rooted in fixed-room solutions.
By Animal Type: Small companions drive growth
Small-animal imaging formed 64.58% of the veterinary X-ray market size in 2025 and enjoys a 6.2% CAGR as dogs and cats live longer and owners demand human-grade diagnostics. Breed-specific orthopedic screening and oncologic staging protocols require serial radiographs, nudging clinics toward multipanel DR. Large-animal radiography remains vital for lameness assessment in equine athletes, yet its replacement cycles extend further due to lower annual study volumes. Exotics and zoo species, while niche by count, stimulate specialized product design such as micro-focus tubes suited for tiny mammals.
Canine oncology tools like CancerDx highlight a growing pipeline of species-targeted AI models that offer earlier tumor detection, fortifying small-animal imaging’s role in overall veterinary X-ray market expansion. As telemedicine platforms integrate remote second opinions, clinic directors report higher client acceptance of imaging-based treatment plans, securing repeat revenue.

By Application: Orthopedics leads, oncology accelerates
Orthopedic studies represented 32.10% of the veterinary X-ray market share in 2025, primed by frequent cruciate ligament tears and hip dysplasia monitoring in dogs. High-resolution DR supports pre-operative templating and post-surgical implant evaluation, making radiography indispensable to orthopedic case management. Yet oncology is the fastest riser at 6.89% CAGR, fed by earlier cancer screening protocols and adjuvant radiotherapy planning needs. Dental and cardiothoracic imaging follow, buoyed by preventive-care packages that bundle annual radiographs with wellness visits.
Oncology’s surge has strategic implications: clinics investing in low-contrast-detecting detectors capture referrals that previously went to specialty centers, redistributing revenue within the veterinary X-ray market. AI-assisted tumor-margin delineation tools now in beta testing aim to cut interpretation variability, smoothing reimbursement discussions with pet insurance providers.
By End-User: Hospitals lead, mobile practices surge
Veterinary hospitals retained 44.15% of the veterinary X-ray market size in 2025, leveraging multi-room suites to service high patient throughput. Independent clinics adopt lighter configurations but remain pivotal at the neighborhood scale. Mobile/field practices, however, are increasing at 6.59% CAGR, embodying the fastest structural shift in service delivery. Equipment makers are responding with ruggedized casings and auto-calibrating collimators to expedite deployment during house calls.
Growth in mobile/field usage also sparks demand for integrated scheduling and billing software, letting practitioners generate invoices on-site and embed radiographs in the patient portal before leaving the driveway. This seamless experience translates into higher utilization rates and deepens the revenue moat for portable system vendors within the veterinary X-ray market.
Geography Analysis
North America captured 39.35% of the veterinary X-ray market size in 2025, backed by widespread pet health insurance and a dense network of 32,000 companion-animal clinics. The United States supports grant programs such as Virginia’s USD 110,000 incentive to lure veterinarians to underserved rural counties, indirectly boosting portable detector sales. Canada mirrors these patterns, while Mexico shows rising adoption as multinational chains standardize equipment across NAFTA markets. The region is expected to log a steady 5.55% CAGR to 2031, with replacement purchases outweighing first-time installs.
Europe advances at a 5.9% CAGR, led by Germany, the United Kingdom, and France. Strict animal-welfare directives and uniform CE marking rules shorten regulatory lead-times, promoting quick uptake of next-gen DR. Funding from EU Horizon research projects further spurs AI algorithm development for multi-species radiography, adding incremental lift to the veterinary X-ray market. Southern and Eastern member states present white-space opportunities as GDP per capita climbs and companion-animal populations increase.
Asia-Pacific stands out for velocity: a 6.86% CAGR is projected through 2031, propelled by urban pet ownership booms in China, India, and Southeast Asia. China’s regulatory modernization has trimmed device approval cycles by 20%, though rare-earth export restrictions remain a strategic variable. India’s mix of large-animal and rising small-animal segments warrants dual-purpose equipment, boosting unit volumes. Japan and South Korea, already saturated, are pivoting toward AI upgrades and dose-tracking software, illustrating the region’s technological heterogeneity. The veterinary X-ray market size in Asia-Pacific is therefore expected to surpass North America by early 2031 if current momentum persists.

Competitive Landscape
Market structure is moderately concentrated. IDEXX, Heska-Antech, Fujifilm, Canon, GE HealthCare, and Carestream collectively hold a large share of the global veterinary diagnostics revenue. Competition now centers on ecosystem breadth—hardware, cloud PACS, AI—orchestration, and on-demand service contracts—rather than detector pixels alone.
AI partnerships illustrate this convergence. GE HealthCare joined forces with NVIDIA in March 2025 to embed autonomous workflow engines into new X-ray consoles, promising significant labor-savings for understaffed clinics. Canon committed USD 34 million to an Ohio-based imaging center to hasten prototype-to-clinic cycle time, signaling deep R&D spend to maintain edge. Agile entrants such as SignalPET differentiate via subscription AI interpretation, serving 2,300 clinics that lack in-house radiologists. China’s material export rules may reorder supply hierarchies, advantaging firms with diversified detector chemistry portfolios or domestic fabs outside restricted mineral lists.
Customer-service models are likewise changing. Vendor-managed inventory for detector batteries and collimator bulbs cuts downtime, while SaaS updates unlock new AI modules without hardware swaps. Collectively, these strategies aim to anchor clients in multi-decade platform relationships, cementing recurring revenue and supporting the long-term growth of the veterinary X-ray market.
Global Veterinary X-Ray Industry Leaders
Antech Diagnostics, Inc.
Canon Inc.
Fujifilm Holdings Corp.
GE HealthCare
IDEXX Laboratories Inc.
- *Disclaimer: Major Players sorted in no particular order

Recent Industry Developments
- March 2025: GE HealthCare and NVIDIA unveiled a joint roadmap to deliver autonomous X-ray and ultrasound systems built on the NVIDIA Isaac for Healthcare platform, targeting 4.2 billion imaging exams annually.
- June 2024: SK Telecom launched X Caliber, an AI-based veterinary X-ray analysis service, in the Australian market.
- January 2024: SignalPET rolled out SignalSTAT, guaranteeing 24/7 X-ray interpretations within 45 minutes for USD 75 or less per study.
- May 2023: IMV Technologies acquired Belgium-based Veterinary Solutions to broaden its companion-animal digital radiography and PACS portfolio in Europe.


Research Methodology Framework and Report Scope
Market Definitions and Key Coverage
Our study treats the veterinary X-ray market as the total annual revenue generated from new, factory-built radiography systems, digital or analog, that produce diagnostic two-dimensional images for companion, large, exotic, and zoo animals across in-clinic, hospital, and field settings. Accessories, software, and service contracts directly bundled with the system price are included in the value.
Imaging consumables, advanced cross-sectional modalities (CT, MRI), and refurbished equipment remain outside the current scope.
Segmentation Overview
- By Technology
- Direct Radiography (DR) Systems
- Computed Radiography (CR) Systems
- Film-based Radiography Systems
- By System Type
- Digital X-ray
- Analog X-ray
- By Mobility
- Stationary Systems
- Portable Systems
- By Animal Type
- Small Companion Animals
- Large Animals
- Exotic & Zoo Animals
- By Application
- Orthopedics
- Neurology
- Oncology
- Cardiology
- Dental
- Other Applications
- By End-User
- Veterinary Hospitals
- Veterinary Clinics
- Mobile/Field Practices
- By Geography
- North America
- United States
- Canada
- Mexico
- Europe
- Germany
- United Kingdom
- France
- Italy
- Spain
- Rest of Europe
- Asia-Pacific
- China
- India
- Japan
- Australia
- South Korea
- Rest of Asia-Pacific
- Middle East and Africa
- GCC
- South Africa
- Rest of Middle East and Africa
- South America
- Brazil
- Argentina
- Rest of South America
- North America
Detailed Research Methodology and Data Validation
Primary Research
Our analysts interviewed small-animal veterinarians, equine practitioners, and imaging distributors across North America, Europe, and Asia-Pacific. Discussions validated capital-budget norms, typical replacement cycles, and regional price dispersion, then reconciled secondary gaps and challenged early model outputs.
Desk Research
We built the foundational demand map by reviewing open data sets such as the American Veterinary Medical Association pet ownership census, USDA livestock population sheets, FEDIAF companion animal counts, and customs import codes for HS 902214. Industry white papers and peer-reviewed journals on digital radiography adoption trends complemented these statistics. Financial filings and investor decks from listed imaging suppliers clarified average selling prices, while news archives on Dow Jones Factiva and company intelligence from D&B Hoovers supplied shipment and capacity clues. The sources mentioned are illustrative and not exhaustive; many additional documents were consulted for cross-checks.
Market-Sizing & Forecasting
A top-down build that reconstructs equipment demand from clinic and hospital counts, weighted by X-ray penetration and annual replacement propensity, set the 2025 baseline. Select bottom-up roll-ups of supplier shipments and sampled ASP x volume tests adjusted totals for gray-market leakage. Key variables feeding the model include: pet population growth, new veterinary facility openings, digital conversion rate from film to DR, average capital outlay per practice, and orthopedic procedure incidence that raises image frequency.
Five-year forecasts rely on a multivariate regression that ties equipment demand to pet population elasticity, clinic additions, and DR price erosion scenarios vetted with subject-matter experts. Data gaps in bottom-up samples were bridged using moving-average imputations constrained to historic replacement ranges.
Data Validation & Update Cycle
Outputs pass variance checks against import statistics, supplier revenue disclosure, and installed-base tallies. An internal peer review scrutinizes anomalies before sign-off. Reports refresh annually, and interim updates are triggered by material events such as major regulatory shifts or disruptive technology launches.
Why Mordor's Veterinary X-Ray Baseline Stays Reliable
Published values often differ because firms choose distinct scope limits, input variables, and refresh cadences.
Key gap drivers include whether refurbished units are counted, how accessories are bundled, currency conversion points, and the aggressiveness of digital-shift assumptions. Mordor analysts lock scope early, employ a balanced top-down and bottom-up blend, and revisit models each year, which minimizes drift.
Benchmark comparison
| Market Size | Anonymized source | Primary gap driver |
|---|---|---|
| USD 0.81 B (2025) | Mordor Intelligence | - |
| USD 0.90 B (2025) | Global Consultancy A | Bundles certain consumables; excludes stationary analog upgrades; uses average 2024 EUR rate |
| USD 0.69 B (2023) | Regional Consultancy B | Restricts scope to fixed systems and an earlier base year without digital premium adjustment |
| USD 1.40 B (2032) | Trade Journal C | Combines X-ray with CT/MRI and applies optimistic adoption curve through 2032 |
These comparisons show that when scope creep or variable omissions occur, values swing widely. By grounding every figure in transparent clinic counts, verified price corridors, and annually refreshed assumptions, Mordor Intelligence delivers a dependable baseline decision-makers can track and replicate.


Key Questions Answered in the Report
Why are veterinary clinics rapidly replacing computed radiography with direct radiography?
Direct radiography produces higher-resolution images in seconds and removes film processing steps, which shortens appointment times and improves diagnostic confidence.
How is artificial intelligence changing day-to-day veterinary imaging workflows?
AI software now highlights potential lesions automatically, reducing interpretation errors and letting veterinarians spend more time discussing findings with pet owners.
What is driving demand for portable veterinary X-ray equipment?
Mobile services that bring diagnostics to farms, barns, and client homes rely on lightweight, battery-powered detectors that maintain image quality outside traditional exam rooms.
In what way do rare-earth export restrictions affect X-ray system pricing?
Limits on key minerals used in flat-panel detectors tighten global supply, creating cost pressures that can raise equipment prices or delay deliveries.
How does the veterinary workforce shortage influence imaging technology adoption?
Clinics adopt automated positioning aids, cloud PACS, and AI triage tools to handle growing caseloads with fewer trained radiologists on staff.
Why are oncology applications gaining momentum in veterinary radiography?
Earlier cancer screening protocols and breed-specific risk assessments push clinics to integrate advanced imaging for tumor detection and treatment monitoring.
Page last updated on:


