Vehicles For Disabled Market Size and Share
Market Overview
| Study Period | 2020 - 2031 |
|---|---|
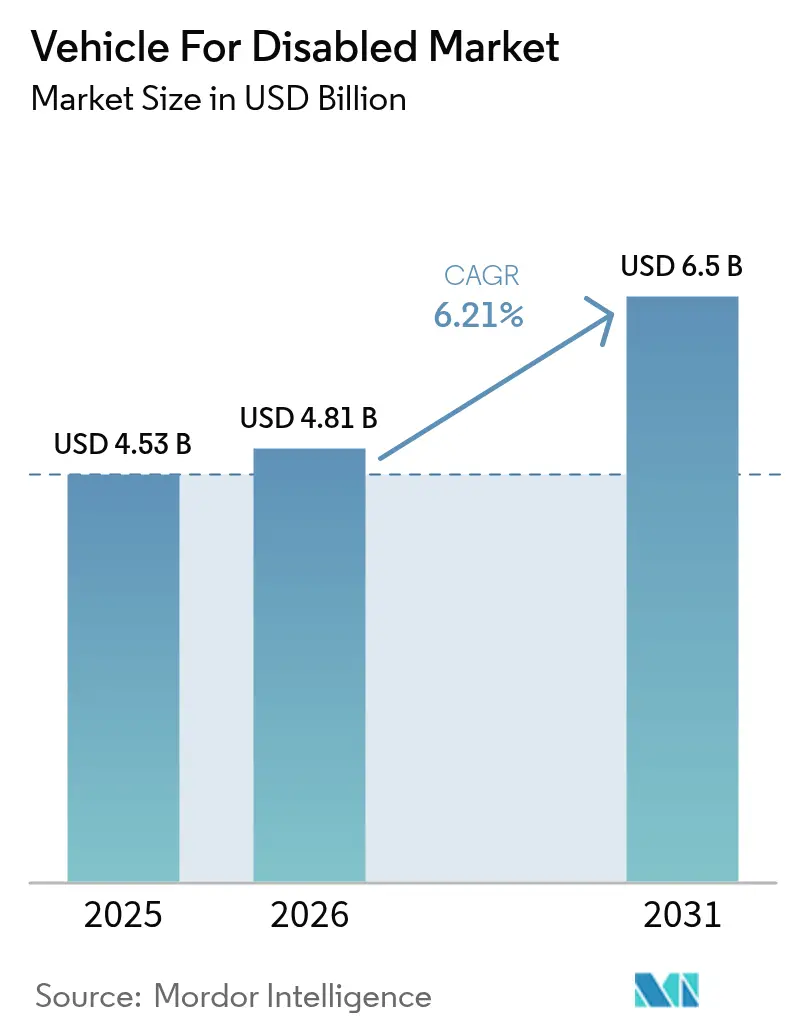
| Market Size (2026) | USD 4.81 Billion |
| Market Size (2031) | USD 6.5 Billion |
| Growth Rate (2026 - 2031) | 6.21% CAGR |
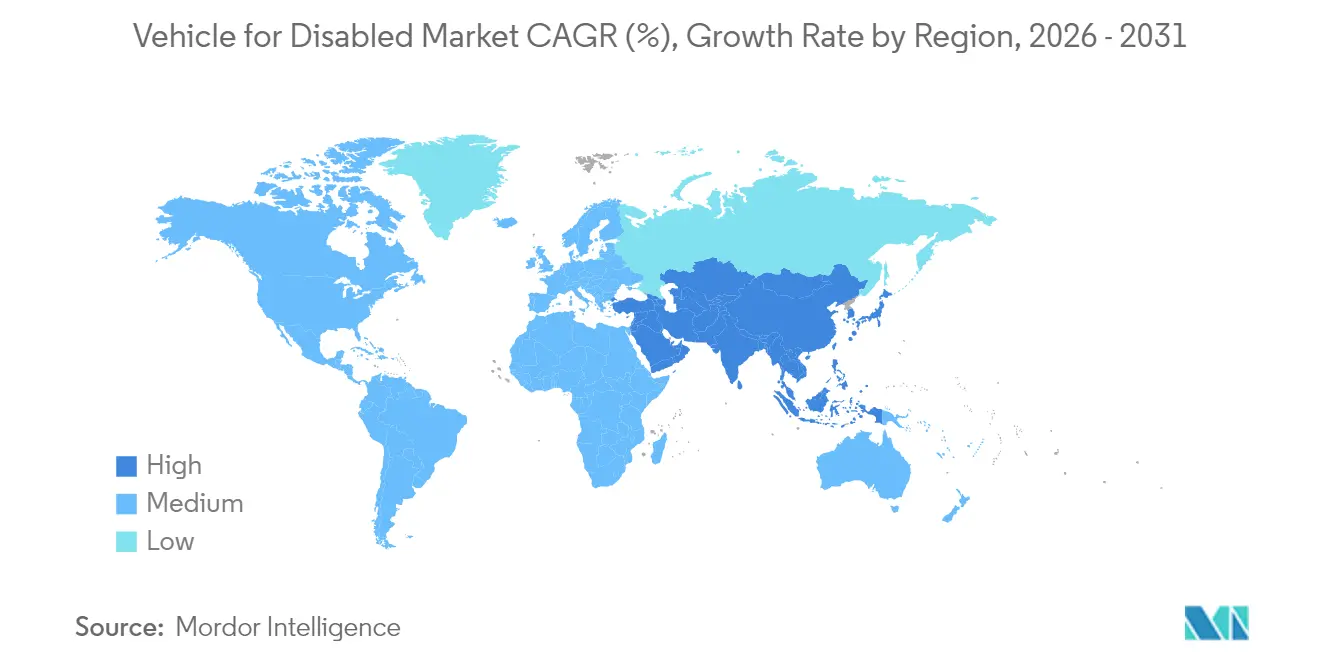
| Fastest Growing Market | Asia Pacific |
| Largest Market | North America |
| Market Concentration | Medium |
Major Players *Disclaimer: Major Players sorted in no particular order Image © Mordor Intelligence. Reuse requires attribution under CC BY 4.0. | |
Vehicles For Disabled Market Analysis by Mordor Intelligence
Vehicle for disabled market size in 2026 is estimated at USD 4.81 billion, growing from 2025 value of USD 4.53 billion with 2031 projections showing USD 6.5 billion, growing at 6.21% CAGR over 2026-2031. The rise is driven by rapid population aging, stricter accessibility mandates, and OEM adoption of factory-installed mobility packages. The confluence of higher life expectancy, expanding insurance coverage in developed regions, and stronger public procurement programs is translating unmet mobility needs into measurable demand. At the same time, electric van platforms with low flat floors are lowering conversion complexity while automated securement systems and steer-by-wire interfaces are reducing caregiver burden. Competitive intensity is moving from pure retrofit specialists toward integrated manufacturers that can combine electromechanical innovations with cybersecurity-ready software. These forces are rebalancing value creation toward technology leadership and scale economics rather than labor-intensive customization, shaping the next phase of vehicle for disabled market growth
Key Report Takeaways
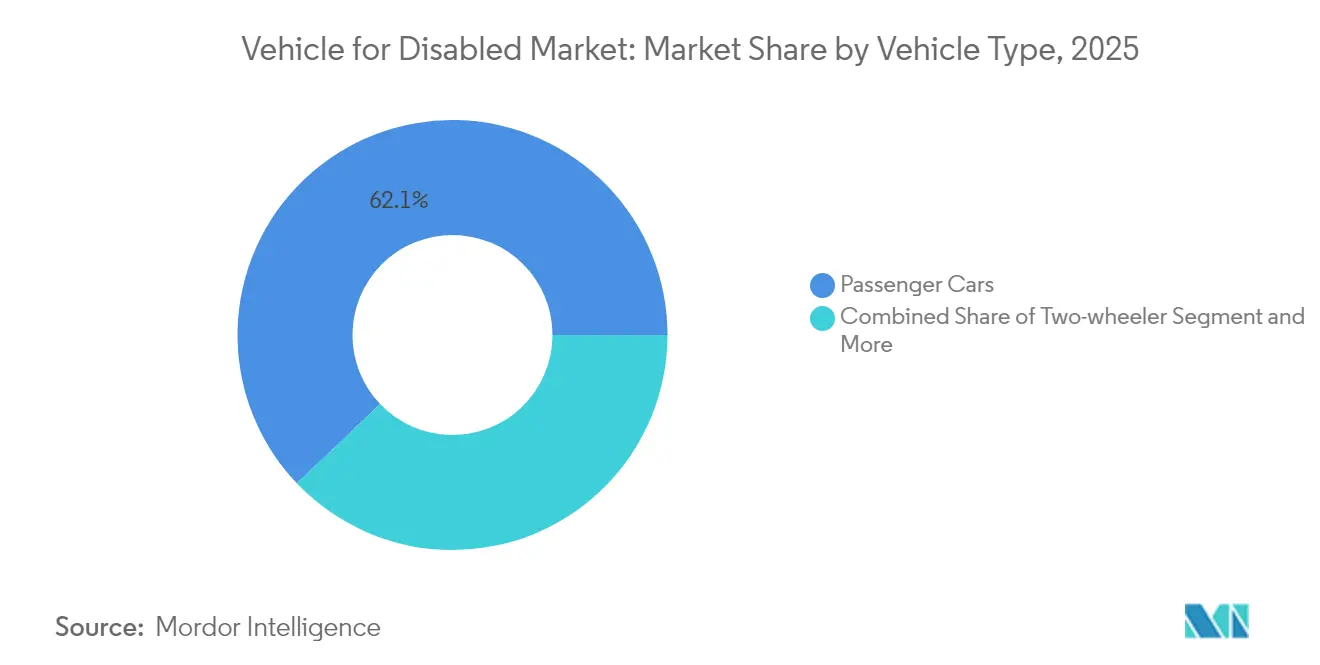
- By vehicle type, passenger cars captured 62.12% of the vehicle for disabled market share in 2025, while commercial vehicles are projected to expand at a 7.05% CAGR through 2031.
- By modification type, wheelchair-accessible vehicles commanded a 44.62% share of the cars for the disabled market size in 2025, and ramp-equipped vehicles are advancing at an 7.88% CAGR.
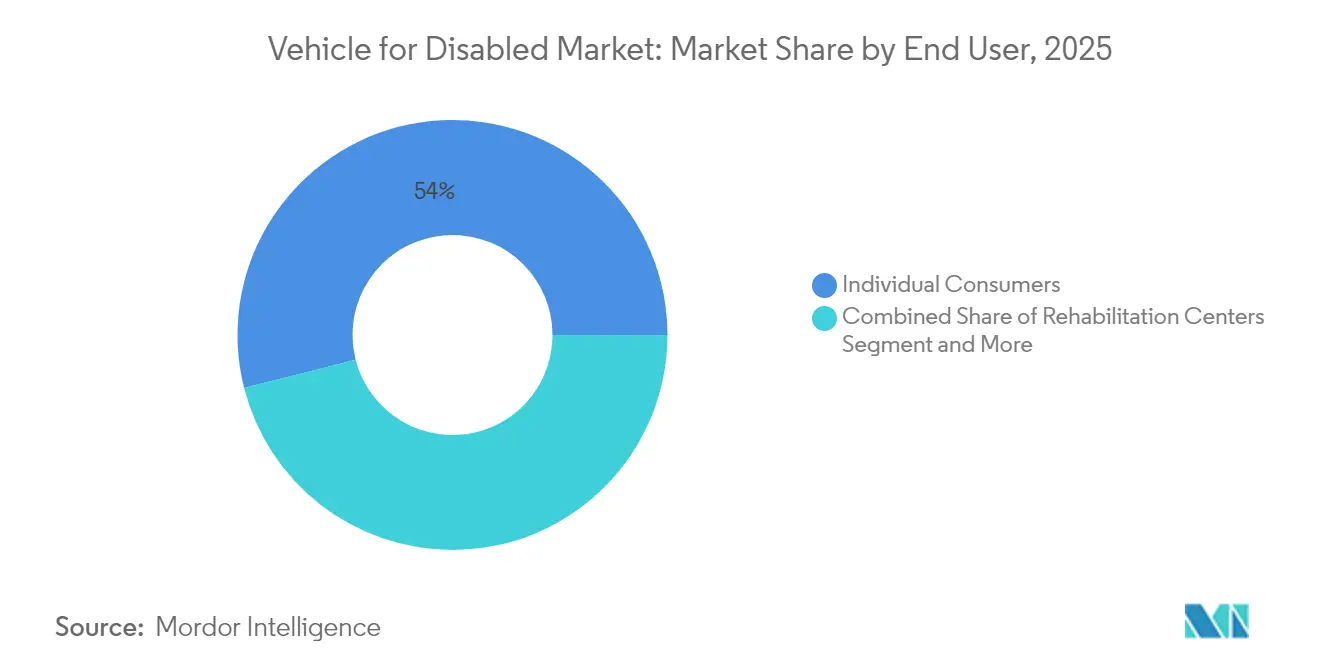
- By end user, individual consumers held a 53.96% share of the vehicle for disabled market size in 2025, while government agencies are projected to have the highest CAGR at 6.55% through 2031.
- By distribution channel, aftermarket conversions led with a 71.58% vehicle market share for the disabled in 2025, whereas OEM sales are growing at a 7.52% CAGR.
- By geography, North America accounted for 43.35% of the vehicle for disabled market size in 2025, and the Asia-Pacific region is forecast to grow at an 8.31% CAGR from 2025 to 2031.
Note: Market size and forecast figures in this report are generated using Mordor Intelligence’s proprietary estimation framework, updated with the latest available data and insights as of 2026.
Global Vehicles For Disabled Market Trends and Insights
Drivers Impact Analysis*
| Driver | (~) % Impact on CAGR Forecast | Geographic Relevance | Impact Timeline |
|---|---|---|---|
| Aging Populations and Longer Life Expectancy | +1.8% | Global, peak in North America and Europe | Long term (≥ 4 years) |
| Wheelchair-Accessibility Mandates for Fleets | +1.5% | North America and EU, expanding to Asia-Pacific | Medium term (2-4 years) |
| OEM Factory-Installed Accessibility Packages | +1.2% | Global, led by North America and Europe | Medium term (2-4 years) |
| Electric Vans with Low Flat Floors | +0.9% | Global, early use in Europe and North America | Short term (≤ 2 years) |
| “One-Touch” Securement and Steer-By-Wire | +0.7% | Developed markets first, spreading globally | Medium term (2-4 years) |
| Subsidized On-Demand Paratransit Programs | +0.4% | Urban centers in North America, Europe, select Asia-Pacific | Short term (≤ 2 years) |
| Source: Mordor Intelligence | |||
Accelerating Demand from Aging Populations and Longer Life Expectancy
Globally, as lifespans extend, societies are re-evaluating concepts of mobility and independence. Aging individuals often face physical challenges, making conventional transportation options less viable. This shift highlights a growing interest in adaptive mobility solutions, enabling older adults to maintain their daily autonomy. Concurrently, retirees are witnessing enhanced financial conditions, bolstered by more inclusive insurance coverage. Such advancements facilitate easier access to vehicle modifications and mobility aids. The healthcare sector is pivoting too, prioritizing 'aging in place'—enabling individuals to stay in their homes instead of transitioning to institutional care. Within this framework, personal vehicles evolve from mere conveniences to essential lifelines. On a global scale, certain nations are leading the way, with public insurance covering a significant chunk of mobility-related expenses. These initiatives underscore a growing acknowledgment of mobility's pivotal role in quality aging, presenting potential blueprints for other affluent nations to emulate.
Regulatory Mandates for Wheelchair Accessibility in Public and Private Fleets
Governments are tightening compliance clocks for both public transit and private mobility providers. The 2024 Americans with Disabilities Act amendments require U.S. transit agencies to achieve 100% wheelchair-accessible fleets by 2027[1]“ADA Regulations Revised in 2024,”, U.S. Department of Transportation, transportation.gov. In the EU, Directive 2019/882 is being implemented, accompanied by financial penalties for accessibility lapses. Municipal regulations now extend to ride-hailing fleets, forcing operators to expand accessible vehicle pools or face fines. Similar statutes are emerging in high-growth Asian economies that are eager to align with global standards and secure tourism revenue, collectively creating predictable demand for compliant vehicles.
OEM Factory-Installed Accessibility Packages Gaining Model Coverage
Automakers are transitioning conversions from aftermarket shops to the factory floor, cutting lead times and retaining full vehicle warranties. Ford added factory mobility packages across its 2024 Transit range, enabling same-day delivery for common configurations[2]“Transit Mobility Program Expansion,”, Ford Motor Company, corporate.ford.com. Toyota expanded its Mobility Program coverage to 15 models, signaling mainstream acceptance of built-in solutions. Early involvement at the design stage allows integration of ISO 14155 medical-device interfaces, reduces redundant labor, and streamlines global homologation, thereby reshaping supply chain economics throughout the vehicle for disabled market.
“One-Touch” Securement and Steer-By-Wire Tech Lowering Caregiver Burden
Q’Straint’s automated securement system locks and releases a wheelchair in 15 seconds, a sixfold improvement over manual belts[3]“Quattro Securement System Earns FMVSS 222 Approval,”, Q’Straint, qstraint.com. Paravan’s steer-by-wire interface customizes steering effort and control placement, eliminating mechanical columns that impede transfers. Such technologies free clinical staff in rehabilitation fleets while improving patient safety, and telematics connections enable remote diagnosis, keeping critical assets on the road. As these technologies reach production scale, they elevate functional expectations and spur competitive upgrades across the vehicle for disabled market.
Restraints Impact Analysis*
| Restraint | (~) % Impact on CAGR Forecast | Geographic Relevance | Impact Timeline |
|---|---|---|---|
| High Conversion Costs and Limited Finance | -1.3% | Global, acute in emerging markets | Long term (≥ 4 years) |
| Shortage of Certified Conversion Technicians | -0.9% | North America and Europe | Medium term (2-4 years) |
| EV Battery Placement Blocking Floor Drops | -0.6% | Global, growing with EV adoption | Short term (≤ 2 years) |
| Cyber-Secure Gateways Limiting Retrofits | -0.4% | Developed markets with connected vehicles | Medium term (2-4 years) |
| Source: Mordor Intelligence | |||
EV Skateboard Chassis Battery Placement Restricting Floor-Drop Conversions
Battery modules under the cabin floor in platforms such as the Tesla Model X eliminate physical space for traditional lowered-floor solutions, making side-entry ramps or raised interior platforms the only viable alternatives. These workarounds can reduce headroom or increase build hours, offsetting some of the EV architecture advantages. Conversion firms are investing in bespoke kits, but interim constraints shave growth off the vehicle for disabled market until scalable solutions become mainstream.
Cyber-Secure Gateway Software Locks That Block Third-Party Retrofits
To protect over-the-air updates, automakers deploy encrypted gateways that can disable vehicle functions if unknown hardware is detected. General Motors strengthened its cybersecurity protocols in 2024, requiring third-party mobility systems to be digitally whitelisted, which delayed installations and added certification paperwork. Smaller converters without direct OEM channels may struggle to obtain required access tokens, especially for niche models, thereby limiting consumer choice and dampening aftermarket volume.
*Our forecasts treat driver/restraint impacts as directional, not additive. The impact forecasts reflect baseline growth, mix effects, and variable interactions.
Segment Analysis
By Vehicle Type: Commercial Fleets Drive Accessibility Adoption
Commercial vehicles generated momentum with a 7.05% CAGR forecast between 2026 and 2031, despite passenger cars retaining a 62.12% market share for vehicles for the disabled in 2025. Regulatory countdowns and public subsidies for fleet electrification prompt transit agencies and ride-share operators to purchase compliant vans, minibuses, and taxis on a large scale. The Federal Transit Administration’s mandate for fully accessible fleets by 2027 accelerates procurement cycles, compelling manufacturers to deliver pre-configured solutions. Commercial OEMs, such as Ford, integrate lifts and securement directly on the assembly line, thereby compressing delivery timelines and reducing retrofit costs. Passenger cars remain the dominant choice for individual ownership because insurance benefits and financing programs increasingly cover hand controls, swivel seats, and personal ramps, thereby sustaining demand for tailored modifications. Emerging markets exhibit early interest in adaptive two-wheelers, offering cost-efficient mobility in congested urban corridors where car ownership remains low.
Factory-built accessibility trims installation defects and preserves structural integrity, increasing resale prospects for commercial buyers concerned with lifecycle cost. Flat-floor EV vans further simplify the conversion process, aligning environmental goals with accessibility requirements. Conversely, aging populations in developed economies continue to prioritize vehicle familiarity, keeping sedans and minivans relevant within the vehicle market for the disabled. This dual pathway highlights a market split: standardized, high-volume commercial builds and bespoke passenger vehicles catering to diverse disability profiles.


By Modification Type: Ramp Systems Gain Technology Edge
Wheelchair-accessible vehicles held the largest share at 44.62% in 2025; however, ramp-based configurations are expected to grow the fastest with an 7.88% CAGR. Automated lightweight aluminum ramps reduce caregiver strain and cut deployment times from 45 seconds to 8 seconds in the latest BraunAbility platforms. Integrated weight sensors prevent premature stowage, enhancing safety while meeting ISO 10542 standards. Lift mechanisms still dominate high-duty applications such as hospital shuttles, but face cost headwinds and maintenance schedules that favor ramps in personal use cases. Hand-control conversions, though a smaller revenue segment, remain vital for drivers with upper-limb strength, and technology upgrades are focusing on haptic feedback and redundant braking circuits.
Smart sensors now flag maintenance alerts to fleet managers, improving uptime and lowering the total cost of ownership. Swivel seat systems appeal to older consumers who require assistance with entering but do not use wheelchairs, a demographic that is expanding with rising life expectancy. The blend of automation and connectivity across modification categories enhances reliability. It ensures compliance with increasingly stringent safety codes, positioning ramps as a mainstream solution in the vehicle market for people with disabilities.
By End User: Government Agencies Accelerate Procurement
Individual consumers contributed 53.96% to the market size of vehicles for the disabled in 2025, driven by increasing disposable income and favorable insurance terms. Nevertheless, government agencies are projected to register the quickest 6.55% CAGR as public fleets race toward statutory targets. Standardized federal specifications streamline bidding and maintenance, encouraging bulk orders that temper per-unit pricing. Hospitals and rehabilitation centers depend on specialized interior layouts but benefit from the same procurement economies as municipal fleets, further pulling demand toward institutional buyers.
Government enthusiasm for electric fleets increases orders because vehicles simultaneously meet both environmental and accessibility benchmarks. Meanwhile, NGOs leverage partnership frameworks to pool purchasing power, extending coverage to underserved rural communities. These shifts redistribute volume away from fragmented one-off orders toward planned fleet cycles, reshaping revenue visibility across the vehicle for disabled market.
By Distribution Channel: OEM Sales Challenge Aftermarket Dominance
Aftermarket conversions still dominated the market share for vehicles for the disabled, with 71.58% in 2025; however, OEM sales are expected to outpace this with a 7.52% CAGR as automakers integrate lift and ramp options at the plant. Factory builds ensure warranty continuity and capitalize on robotic production lines for consistent quality. Fleet buyers value immediate availability since idle assets erode service metrics. Aftermarket specialists respond by pivoting to high-customization niches and geographic coverage gaps, introducing modular kits that can be installed at dealerships in under 48 hours, as seen in Vantage Mobility International’s new series.
Subscription-based mobility services represent an emerging hybrid channel, with leasing firms buying converted vehicles in bulk and offering flexible rental plans to seniors who may need different aids over time. This model aligns asset utilization with dynamic health conditions, enlarging the user base beyond traditional ownership paradigms. Channel rivalry, therefore, hinges on speed, depth of customization, and financing creativity within the vehicle for disabled market.
Geography Analysis
North America commands a 43.35% share of the vehicle for disabled market size in 2025, owing to strong legal frameworks, well-funded insurance systems, and robust financing channels. The amended ADA imposes strict compliance, prompting commercial operators to refresh or retrofit fleets at scale. Veteran Affairs grants and private insurers regularly reimburse adaptive equipment, minimizing up-front barriers for many end users. Demographic momentum adds further pull; the continent’s senior cohort is forecast to increase between 2020 and 2040, driving steady demand for accessible personal transportation. Canada’s inclusion under similar safety regulations eases cross-border trade, while provincial health plans often cover significant portions of conversion costs.
The Asia-Pacific region is the fastest-growing, advancing at an 8.31% CAGR through 2031. Japan’s super-aged population drives immediate needs, and its national long-term care insurance subsidizes vehicle adaptations. South Korea made equal access in transportation mandatory in 2024, mirroring European standards and accelerating local OEM rollouts. China’s Ministry of Transport requires urban buses to be wheelchair accessible, translating this policy into large municipal tenders. India’s implementation of disability rights primarily extends to metros, and market penetration beyond tier-one cities is contingent upon road infrastructure upgrades and lending availability.
Europe posts stable expansion under the European Accessibility Act, which harmonizes technical norms across member states and lowers barriers for cross-border mobility brands. Germany’s engineering expertise underpins exports of steer-by-wire systems, while Scandinavian nations fund conversion costs through tax-financed social insurance. The Middle East and Africa exhibit a nascent but rising demand, led by the UAE’s federal inclusion strategy, which integrates transportation accessibility into its smart-city blueprint. South Africa’s disability rights policy stimulates urban purchases, yet weaker credit systems and limited service networks hinder rural uptake. Collectively, geographic patterns reveal that regulatory certainty, demographic aging, and fiscal capacity collectively dictate the adoption pace in the market for vehicles for the disabled.

Competitive Landscape
The vehicle for disabled market remains moderately fragmented, although consolidation is underway. BraunAbility and Vantage Mobility International anchor the North American scene, each broadening product breadth through acquisitions and robotics investments.
Technology differentiation is intensifying. Q’Straint holds FMVSS 222-certified patents for automated securement and recently obtained ISO 14155 clearance to penetrate medical transport fleets. Paravan upgraded steer-by-wire modules with encryption compliant with UNECE WP.29, positioning itself as a cybersecurity-ready supplier. OEMs such as Ford and Toyota are embedding accessibility directly, challenging retrofit incumbents and expanding dealer-based service ecosystems. Smaller firms are carving out niches in adaptive two-wheelers, luxury SUV conversions, and modular rental fleets, where personalized service takes precedence over scale.
Manufacturers with in-house fabrication of lifts, ramps, and control electronics gain cost advantages and speed to market. Partnerships with leasing firms and healthcare providers expand recurring-revenue pools beyond one-time vehicle sales. The patent arena exhibits clustering around automation and digital interfaces, thereby raising entry barriers for new entrants lacking deep research and development budgets. Competitive success increasingly depends on meeting the dual imperatives of rapid configuration at scale and secure integration with OEM software, defining the next battleground inside vehicle for disabled market.
Vehicles For Disabled Industry Leaders
BraunAbility
REV Group
Vantage Mobility LLC.
Rollx Vans.
Toyota Mobility
- *Disclaimer: Major Players sorted in no particular order


Recent Industry Developments
- May 2025: Kia Corporation (Kia), in collaboration with UK-based Motability Operations Ltd, unveiled the PV5 WAV (Wheelchair Accessible Vehicle) at the Financial Times' Future of the Car Summit in London. This exhibition, part of Kia's ongoing commitment to improving mobility for individuals with disabilities, highlights the company's leadership role as a provider of sustainable mobility solutions.
- February 2024: AMF-Bruns has unveiled the inaugural hydrogen-powered vehicle designed for wheelchair accessibility. This innovative conversion features a rear cut floor with an integrated ramp, providing enhanced mobility solutions for individuals with disabilities. The vehicle accommodates either seven passengers or five passengers alongside a wheelchair, offering flexibility and convenience for diverse transportation needs.


Global Vehicles For Disabled Market Report Scope
The Vehicle for Disabled Market Report is Segmented by Vehicle Type (Two-wheeler, Passenger Cars, and Commercial Vehicles), Modification Type (Wheelchair Accessible Vehicles, Hand-Controlled Vehicles, Ramp-Equipped Vehicles, Lift-Equipped Vehicles, and Swivel Seat Systems), End User (Individual Consumers, Rehabilitation Centers, Hospitals, NGOs, and Government Agencies), Distribution Channel (OEM Sales and Aftermarket Conversions), and Geography (North America, South America, Europe, Asia-Pacific, and Middle East and Africa). The Market Forecasts are Provided in Terms of Value (USD).
| Two-wheeler |
| Passenger Cars |
| Commercial Vehicles |
| Wheelchair Accessible Vehicles |
| Hand-Controlled Vehicles |
| Ramp-Equipped Vehicles |
| Lift-Equipped Vehicles |
| Swivel Seat Systems |
| Individual Consumers |
| Rehabilitation Centers |
| Hospitals |
| NGOs |
| Government Agencies |
| OEM Sales |
| Aftermarket Conversions |
| North America | United States |
| Canada | |
| Rest of North America | |
| South America | Brazil |
| Argentina | |
| Rest of South America | |
| Europe | Germany |
| United Kingdom | |
| France | |
| Italy | |
| Spain | |
| Rest of Europe | |
| Asia-Pacific | China |
| India | |
| Japan | |
| South Korea | |
| Rest of Asia-Pacific | |
| Middle East and Africa | United Arab Emirates |
| Saudi Arabia | |
| South Africa | |
| Turkey | |
| Rest of Middle East and Africa |
| By Vehicle Type | Two-wheeler | |
| Passenger Cars | ||
| Commercial Vehicles | ||
| By Modification Type | Wheelchair Accessible Vehicles | |
| Hand-Controlled Vehicles | ||
| Ramp-Equipped Vehicles | ||
| Lift-Equipped Vehicles | ||
| Swivel Seat Systems | ||
| By End User | Individual Consumers | |
| Rehabilitation Centers | ||
| Hospitals | ||
| NGOs | ||
| Government Agencies | ||
| By Distribution Channel | OEM Sales | |
| Aftermarket Conversions | ||
| By Geography | North America | United States |
| Canada | ||
| Rest of North America | ||
| South America | Brazil | |
| Argentina | ||
| Rest of South America | ||
| Europe | Germany | |
| United Kingdom | ||
| France | ||
| Italy | ||
| Spain | ||
| Rest of Europe | ||
| Asia-Pacific | China | |
| India | ||
| Japan | ||
| South Korea | ||
| Rest of Asia-Pacific | ||
| Middle East and Africa | United Arab Emirates | |
| Saudi Arabia | ||
| South Africa | ||
| Turkey | ||
| Rest of Middle East and Africa | ||


Key Questions Answered in the Report
What is the projected value of the vehicles for disabled market in 2031?
The vehicles for disabled market size is forecast to reach USD 6.5 billion by 2031.
Which region is growing the fastest?
Asia-Pacific leads growth with an expected 8.31% CAGR through 2031, driven by rapid aging and new accessibility mandates.
Which vehicle type currently holds the largest share?
Passenger cars dominate with a 62.12% vehicles for disabled market share recorded in 2025.
How are electric vans influencing accessibility conversions?
Skateboard EV architectures offer low flat floors that simplify ramp installations and reduce conversion labor, although battery placement can limit floor-drop modifications.
Why are OEM sales gaining momentum over aftermarket conversions?
Factory-installed accessibility packages cut delivery times, preserve warranties, and meet rising fleet demand, prompting a 7.52% CAGR in the OEM channel.
Page last updated on:


