Vanillin Market Size and Share
Market Overview
| Study Period | 2021 - 2031 |
|---|---|
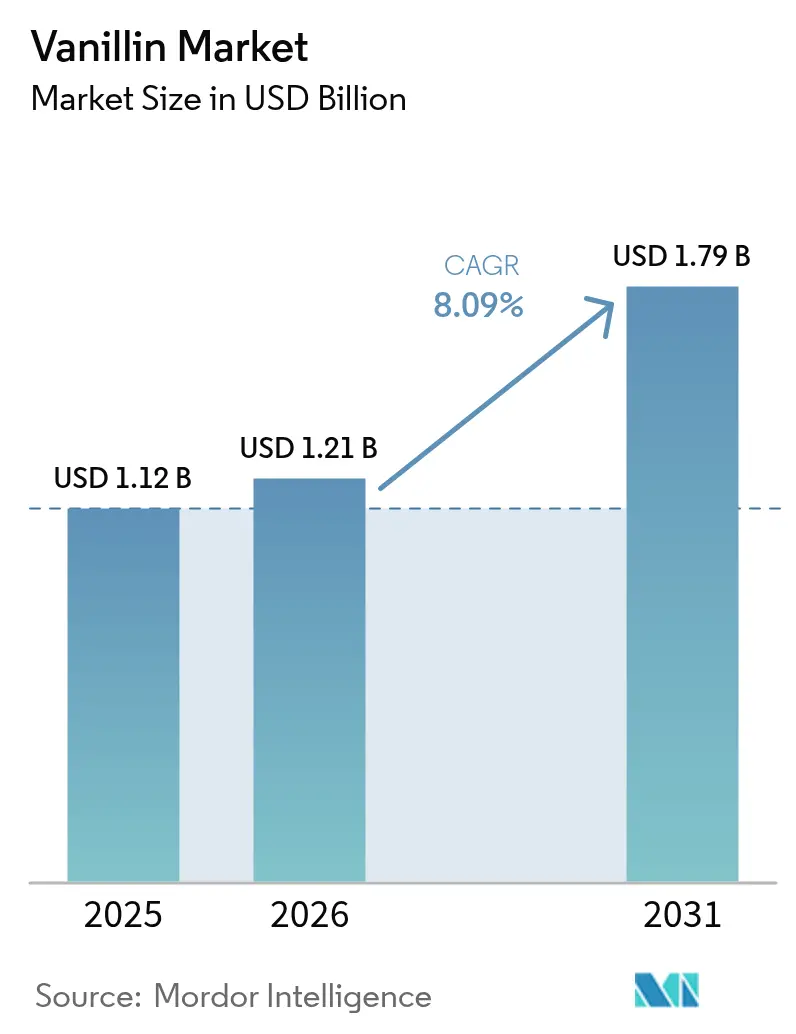
| Market Size (2026) | USD 1.21 Billion |
| Market Size (2031) | USD 1.79 Billion |
| Growth Rate (2026 - 2031) | 8.09% CAGR |
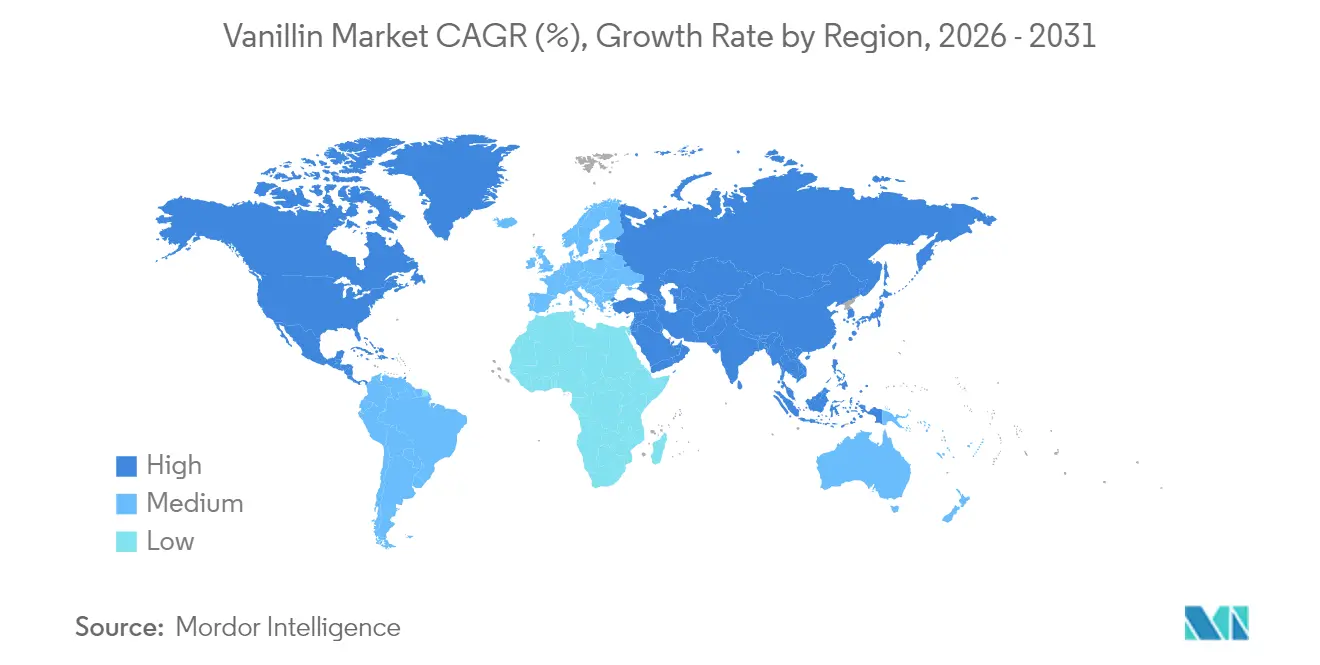
| Fastest Growing Market | Asia-Pacific |
| Largest Market | Europe |
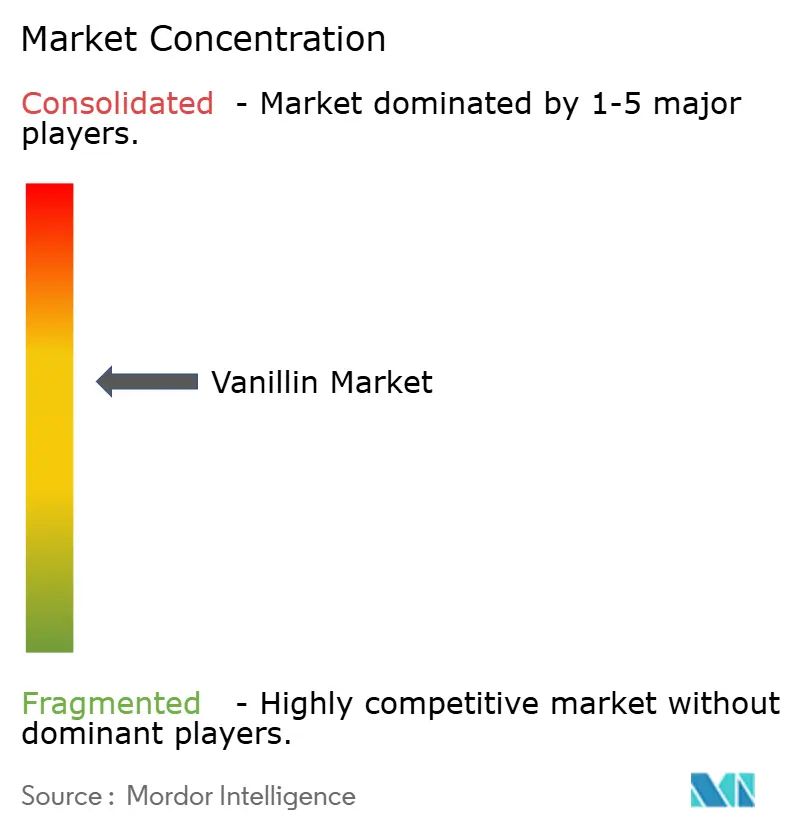
| Market Concentration | Medium |
Major Players *Disclaimer: Major Players sorted in no particular order Image © Mordor Intelligence. Reuse requires attribution under CC BY 4.0. | |
Vanillin Market Analysis by Mordor Intelligence
The vanillin market size was valued at USD 1.12 billion in 2025 and estimated to grow from USD 1.21 billion in 2026 to reach USD 1.79 billion by 2031, at a CAGR of 8.09% during the forecast period (2026-2031). Strong demand from food, beverage, pharmaceutical, and personal care manufacturers anchors today’s volume, while biotechnology-driven cost reductions in natural production widen future applications. Intensifying clean-label adoption, regulatory clarity around natural versus synthetic classifications, and breakthroughs in lignin-based fermentation strengthen the commercial case for natural offerings. Trade policies—from antidumping duties on Chinese shipments to stricter additive standards in Canada—reshape sourcing decisions and accelerate geographic diversification. Producer strategies cluster around vertical integration, feedstock innovation, and direct partnerships with downstream brands seeking secure, sustainable supply.
Key Report Takeaways
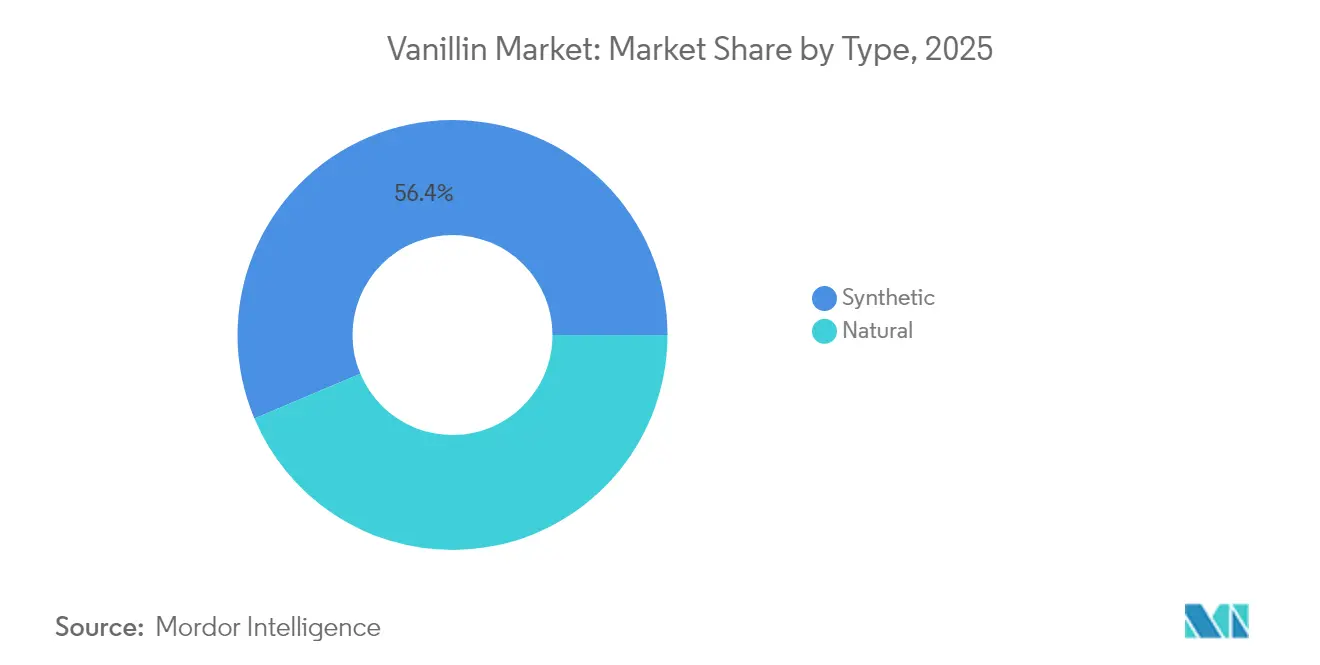
- By type, synthetic variants accounted for 56.35% vanillin market share in 2025. Natural vanillin is forecast to expand at an 8.42% CAGR between 2026 and 2031.
- By form, liquid formulations held 52.05% of the vanillin market size in 2025 and are expected to grow at an 8.22% CAGR through 2031.
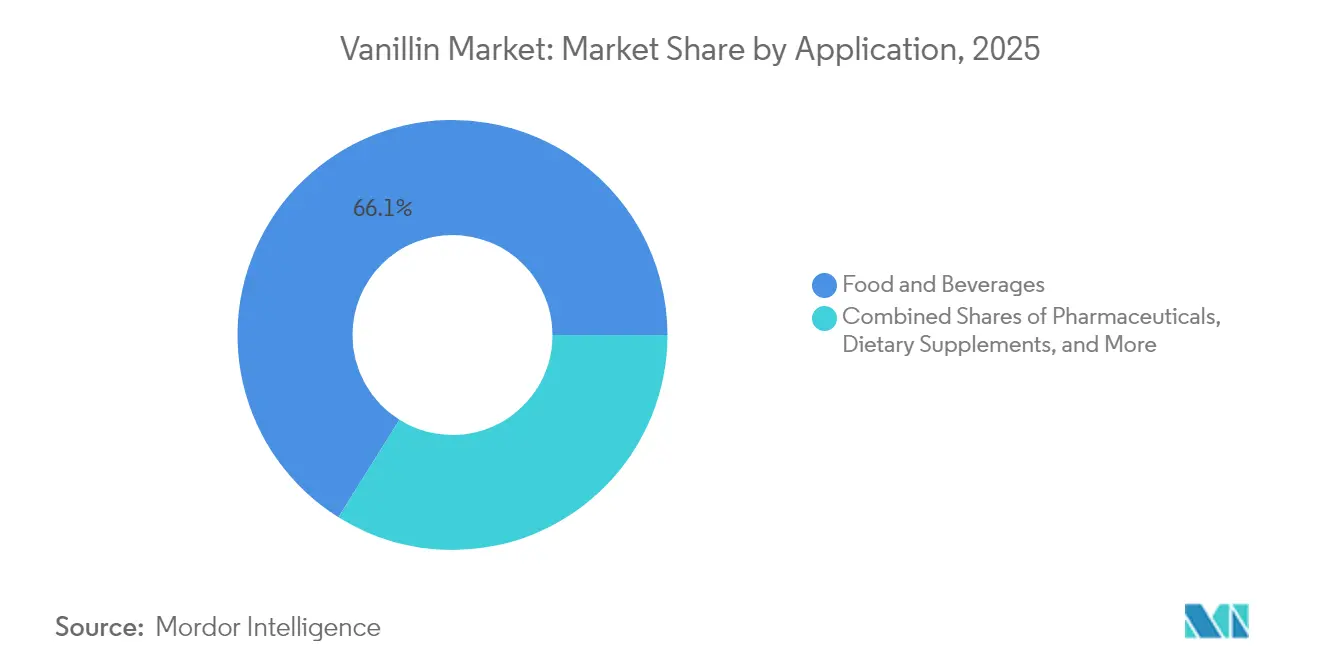
- By application, food and beverage contributed 66.10% revenue in 2025, whereas pharmaceuticals will post a 10.18% CAGR to 2031.
- By Geography, Europe captured 31.10% regional revenue in 2025, while the Asia Pacific is set to post a 9.30% CAGR to 2031.
Note: Market size and forecast figures in this report are generated using Mordor Intelligence’s proprietary estimation framework, updated with the latest available data and insights as of 2026.
Global Vanillin Market Trends and Insights
Drivers Impact Analysis*
| Drivers | (~) % impact on CAGR Forecasts | Geographic Relevance | Impact Timeline |
|---|---|---|---|
| Rising demand for natural ingredients in food, beverages, and personal care | +1.8% | Global, with strongest impact in North America & EU | Medium term (2-4 years) |
| Advancements in biotechnology and fermentation | +1.5% | Global, led by developed markets with R&D capabilities | Long term (≥ 4 years) |
| Increase in clean-label and organic product adoption | +1.2% | North America & EU primarily, expanding to APAC | Medium term (2-4 years) |
| Rising use as preservative and antioxidant in pharmaceutical formulations | +0.9% | Global, concentrated in major pharmaceutical markets | Long term (≥ 4 years) |
| Product innovations and customized flavor blends | +0.7% | Global, with innovation centers in developed markets | Short term (≤ 2 years) |
| Growth of packaged and processed foods | +0.6% | APAC core, spill-over to MEA and Latin America | Medium term (2-4 years) |
| Source: Mordor Intelligence | |||
Rising demand for natural ingredients in food, beverages, and personal care
As consumers increasingly prefer natural products over synthetic ones, opportunities for premium pricing in bio-based vanillin production are emerging. Thanks to biotechnological advancements, companies can now produce vanillin labeled as "natural" through fermentation processes, allowing them to charge around USD 700 per kilogram. In contrast, synthetic vanillin retails at just USD 15 per kilogram. Researchers at Tokyo University of Science have bioengineered enzymes that transform ferulic acid, sourced from agricultural waste, into vanillin in a single step. This innovation not only addresses sustainability and supply concerns but also ensures the product retains its "natural" classification under FDA regulations. With this breakthrough, manufacturers can tap into the lucrative price gap of USD 1,200-4,000 per kilogram between natural vanilla extracts and their synthetic counterparts, all while adhering to major market regulations for natural labeling.
Advancements in biotechnology and fermentation
Genetic engineering and fermentation technologies are revolutionizing vanillin production economics by enabling scalable natural production without reliance on agriculture. Engineered microbial systems, particularly Saccharomyces cerevisiae and Escherichia coli, have demonstrated commercial feasibility in producing natural vanillin from renewable feedstocks such as eugenol, ferulic acid, and lignin derivatives. Lignin-based processes achieve a 6.2% yield by weight, providing a sustainable alternative to petroleum-based synthetic vanillin while addressing waste management issues in the pulp and paper industry. These innovations position biotechnology companies to capture a significant market share by delivering cost-effective natural vanillin that meets the increasing environmental sustainability expectations of major food and beverage manufacturers.
Increase in clean-label and organic product adoption
Clean-label product adoption drives fundamental shifts in vanillin sourcing strategies as manufacturers respond to consumer demands for recognizable, natural ingredients. Food companies increasingly specify natural vanillin in product formulations to achieve clean-label positioning, despite cost premiums of 40-50 times synthetic alternatives. Major brands, including Nestlé, committed to natural flavor sourcing, coinciding with significant vanilla bean production declines that elevated prices and accelerated biotechnological production investments. Regulatory frameworks support this transition, with the FDA and EFSA maintaining distinct classifications for natural versus synthetic vanillin, enabling premium positioning for biotechnology-derived products that meet natural labeling requirements, according to the Alcohol and Tobacco Tax and Trade Bureau data[1]Alcohol and Tobacco Tax and Trade Bureau, “Artificial versus Natural Vanillin,” ttb.gov.
Rising use as preservative and antioxidant in pharmaceutical formulations
Vanillin's therapeutic properties are driving growth in the pharmaceutical market, as research highlights its significant antioxidant, anti-inflammatory, and neuroprotective effects. Clinical trials confirm vanillin's effectiveness in addressing neurodegenerative diseases such as Alzheimer's and Parkinson's by inhibiting acetylcholinesterase and preventing amyloid aggregation. The FDA's "Generally Recognized as Safe" (GRAS) designation has facilitated its inclusion in pharmaceutical formulations, where it functions as both an active ingredient and a preservative. Additionally, patent filings demonstrate vanillin's antimicrobial synergy with isothiocyanate compounds for food preservation, expanding its market potential from traditional flavoring to functional ingredient applications.
Restraint Impact Analysis*
| Restraints | (~) % Impact on CAGR Forecast | Geographic Relevance | Impact Timeline |
|---|---|---|---|
| Volatile supply of natural vanilla beans | -1.4% | Global, with highest impact on natural vanillin segment | Short term (≤ 2 years) |
| Stringent regulatory compliance for food additives and synthetic products | -0.8% | North America & EU primarily, expanding globally | Medium term (2-4 years) |
| High production costs for natural/bio-vanillin | -0.6% | Global, particularly affecting emerging market adoption | Long term (≥ 4 years) |
| Competitive pressure from alternative flavoring agents | -0.4% | Global, with regional variations in flavor preferences | Medium term (2-4 years) |
| Source: Mordor Intelligence | |||
Volatile supply of natural vanilla beans
Madagascar's dominance in vanilla bean production creates systemic supply risks that cascade through natural vanillin markets, with climate events and political instability generating extreme price volatility. Uganda's emergence as the second-largest vanilla producer with over 600 metric tonnes exported in 2024 provides limited supply diversification, earning USD 16.6 million while achieving vanillin content exceeding 4%. Price bubble analysis identifies five distinct volatility periods linked to cyclones, market speculation, and regulatory changes, with recommendations for direct company-farmer negotiations to enhance stability. Natural vanillin production requires approximately 500 kilograms of vanilla pods per kilogram of vanillin, corresponding to pollination of 40,000 flowers, highlighting the agricultural intensity that constrains supply scalability and drives biotechnological alternatives.
Stringent regulatory compliance for food additives and synthetic products
Stringent food additive regulations across major markets create compliance costs that disproportionately impact smaller producers while favoring established manufacturers with regulatory expertise. FDA[2]U.S. Food and Drug Administration, “21 CFR 182.60 — Synthetic Flavoring Substances and Adjuvants,” ecfr.gov regulations under 21 CFR Parts 169 and 182 specify detailed identity standards for vanilla products and synthetic flavoring substances, requiring extensive documentation for GRAS status maintenance. Canadian regulatory amendments effective December 2024 modernize food additive frameworks while maintaining strict compositional standards that require ongoing compliance investments. EFSA evaluations establish acceptable daily intake levels and impurity limits that necessitate continuous monitoring and testing protocols, creating barriers for market entry while ensuring product safety and quality standards across European markets.
*Our forecasts treat driver/restraint impacts as directional, not additive. The impact forecasts reflect baseline growth, mix effects, and variable interactions.
Segment Analysis
By Type: Natural Segment Gains Despite Synthetic Dominance
Synthetic offerings supplied 56.35% of 2025 volume thanks to petro-based guaiacol economics. This segment delivered steady cash flows as the vanillin market size crossed USD 1.12 billion in 2025. Natural variants, however, recorded the highest 8.42% CAGR and will rise from niche to mainstream by 2031 as fermentation costs dip below USD 300 per kg. Borregaard’s lignin route, operational since 1993, exemplifies first-mover advantage; newer entrants now mimic the model with higher yields from electrochemical depolymerization. Clean-label mandates in bakery and premium dairy accelerate adoption even at premium price points.
Consumer studies show willingness to pay up to 15% retail premium for “naturally flavored” chocolate, transferring cost absorption from manufacturer to end-user. As a result, natural volumes are expected to represent 25.60% of the vanillin market share by 2031. Synthetic producers respond by licensing biotech IP or retrofitting guaiacol lines for bio-feedstock compatibility, creating a hybrid supply environment.


By Form: Liquid Applications Drive Processing Efficiency
In 2025, liquid vanillin holds a dominant position in the market with a 52.05% share and the highest growth forecast, projected at an 8.22% CAGR through 2031. This leadership is primarily due to its processing benefits in the industrial food and beverage sector. Liquid formulations excel by enabling precise dosing, uniform mixing, and lower handling costs. These advantages are particularly significant in large-scale beverage and dairy production, where faster dissolution rates enhance efficiency. Conversely, powder forms are tailored for specialized uses, such as baking and confectionery, where dry blending necessitates solid formulations. Crystal forms, on the other hand, are preferred for premium applications that demand high purity and extended shelf life.
Advancements in processing are improving the performance of liquid vanillin. For example, β-cyclodextrin encapsulation enhances aqueous solubility while protecting the vanillin from oxidation during storage and use. Additionally, optimizing the crystallization process has achieved up to 80% yield for stable polymorphic forms through controlled cooling and evaporation techniques, with melting points specified at 82.6°C for Form I and 81.0°C for Form II. Market trends increasingly favor liquid formulations as manufacturers focus on improving operational efficiency and reducing costs in high-volume applications. However, demand for powder and crystal forms remains steady in specialty segments due to their specific functional advantages.
By Application: Pharmaceutical Growth Outpaces Food Dominance
In 2025, food and beverage applications hold a leading 66.10% market share, covering bakery, confectionery, dairy, and beverage sectors, which collectively drive global vanillin demand. At the same time, the pharmaceutical sector, supported by expanding therapeutic applications and regulatory approvals for vanillin's bioactive properties, emerges as the fastest-growing segment with a projected 10.18% CAGR through 2031. Vanillin is also gaining traction in personal care and cosmetics due to its antioxidant properties and increasing consumer preference for natural ingredients. Furthermore, the dietary supplements and sports nutrition segments are capitalizing on vanillin's positioning as a functional ingredient.
Research highlights vanillin's therapeutic potential, extending beyond traditional flavoring to include neuroprotection, cancer treatment, and anti-inflammatory applications. Studies have demonstrated its efficacy against multidrug-resistant bacteria and in addressing oxidative stress conditions. The animal feed sector presents new opportunities, utilizing vanillin's antimicrobial properties to improve livestock health and preserve feed. In industrial applications, vanillin is increasingly used in polymer production as a renewable building block for sustainable materials. Regulatory approvals, such as FDA's GRAS status and EFSA's endorsements, are driving the pharmaceutical market's growth. Additionally, patent protections for therapeutic applications provide a competitive advantage to innovative companies developing vanillin-based drug formulations.
Geography Analysis
In 2025, Europe holds a leading 31.10% market share, supported by its strong manufacturing infrastructure, strict quality standards, and high demand from the food, pharmaceutical, and personal care industries. European producers capitalize on regulatory distinctions between natural and synthetic vanillin, enabling premium positioning for biotechnology-derived products. Key markets such as Germany, France, the Netherlands, and the UK feature advanced supply chains and high-value applications, though regulatory compliance costs pose challenges for smaller competitors. The European market exhibits mature demand patterns, with steady growth driven by clean-label trends and the expansion of pharmaceutical applications.
Asia Pacific is the fastest-growing region, with a 9.30% CAGR projected through 2031. This growth is driven by the region's expanding food processing industries, rising consumer spending, and increasing consumption of packaged foods in countries like China, India, Japan, and Australia. However, trade tensions significantly influence regional dynamics, as U.S. antidumping duties of 190.15% to 379.87% on Chinese vanillin imports reshape supply chains and create opportunities for alternative suppliers, according to the Federal Register. While China faces regulatory challenges as a major vanillin producer, India and Southeast Asian markets show strong growth potential, fueled by urbanization and shifting dietary preferences.
North America represents a mature market with well-established regulatory frameworks and strong demand across food, pharmaceutical, and personal care applications. Meanwhile, South America and the Middle East & Africa present emerging growth opportunities, driven by economic development and the expansion of food processing industries. Uganda, as Africa's second-largest vanilla producer, exported over 600 metric tonnes in 2024, highlighting the continent's potential in natural vanillin supply chains. With vanillin content exceeding 4%, Uganda is increasing its market share in the U.S. and EU markets, emphasizing Africa's growing role in global vanillin supply chains. Regional growth trends reflect economic development, regulatory changes, and supply chain optimization as manufacturers seek cost-effective production locations while maintaining quality standards.

Competitive Landscape
Market leaders like Merck KGaA, BASF SE, and Givaudan SA capitalize on their scale advantages and long-standing customer relationships. In contrast, biotechnology firms such as Evolva Holding SA and niche producers like Borregaard AS carve out their space through innovation and premium market positioning. The competitive landscape is shaped by strategic moves towards vertical integration, a commitment to sustainable production, and a deep expertise in navigating regulatory challenges.
Companies are increasingly turning to technology adoption as a means of standing out in the crowded vanillin market. Investments are being funneled into biotechnological production methods, enzyme engineering, and the use of sustainable feedstocks, all aimed at capturing the more lucrative market segments. However, not all players are thriving: Syensqo, previously known as Solvay, faced a setback with a hefty €114 million impairment loss in its Aroma unit, a direct consequence of dwindling demand for synthetic vanillin and mounting competition. This underscores the pressures traditional producers are grappling with.
White-space opportunities are surfacing in areas like pharmaceutical applications, sustainable production technologies, and tapping into emerging markets. However, the intricate maze of regulatory compliance poses challenges, creating a protective barrier that benefits established players. These industry veterans possess the regulatory know-how and the financial muscle to adeptly navigate the complex approval processes that span multiple jurisdictions.
Vanillin Industry Leaders
Jiaxing Zhonghua Chemical Co Ltd.
Merck KGaA
Borregaard AS
Camlin Fine Sciences (CFS)
PRINOVA GROUP LLC
- *Disclaimer: Major Players sorted in no particular order

Recent Industry Developments
- December 2023: After Evolva Holding AG shareholders approved the sale of Evolva AG to Danstar Ferment AG, a Swiss affiliate of Lallemand Inc., the transaction was successfully finalized on 28 December 2023. Following standard procedure, Evolva Holding SA will move to delist its shares from the SIX Swiss Exchange, a process typically taking 6-12 months.
- November 2023: Prinova Global has announced its acquisition of Flavor Tec, a distinguished name in the citrus oil business. This strategic acquisition expands Prinova’s global presence and amplifies its ability as one of the world’s largest essential oil processors to provide uncompromising quality in every ingredient sourced
- June 2023: Solvay unveils the names of the two independent, publicly traded companies, Solvay and Synesqo. Synesqo is the new name of its Specialty Co. that provides a wide range of solutions to different industries.
- June 2023: Univar Solutions Inc. (NYSE: UNVR) ("Univar Solutions" or "the Company"), a leading global solutions provider to users of specialty ingredients and chemicals, announced today that the Company has become an authorized distributor for Camlin Fine Sciences Ltd.'s (CFS) aroma ingredients in the United States and Canada.


Global Vanillin Market Report Scope
Vanillin is a crystalline phenolic aldehyde produced synthetically or by extracting vanilla beans. It is used in diverse industries for its flavor and fragrance properties.
The global vanillin market is segmented by type, application, and geography. By type, the market is divided into natural and synthetic vanillin. The market studied is divided by application into food and beverage, pharmaceuticals, fragrances, and other applications. The report also analyzes the emerging and established geographical regions: North America, Europe, Asia-Pacific, and the Rest of the World.
The report offers market sizes and forecasts in value (USD) for the above segments.
| Natural Vanillin |
| Synthetic Vanillin |
| Powder |
| Crystal |
| Liquid |
| Food & Beverage | Bakery and Confectionery |
| Beverages | |
| Dairy and Frozen Products | |
| Other | |
| Pharmaceuticals | |
| Personal Care & Cosmetics | |
| Dietary Supplements and Sports Nutrition | |
| Animal Feed | |
| Others |
| North America | United States |
| Canada | |
| Mexico | |
| Rest of North America | |
| Europe | Germany |
| France | |
| United Kingdom | |
| Netherlands | |
| Italy | |
| Rest of Europe | |
| Asia Pacific | China |
| India | |
| Japan | |
| Australia | |
| Rest of Asia Pacific | |
| South America | Brazil\ |
| Argentina | |
| Rest of South America | |
| Middle East and Africa | Saudi Arabia |
| South Africa | |
| Rest of Middle East and Africa |
| By Type | Natural Vanillin | |
| Synthetic Vanillin | ||
| By Form | Powder | |
| Crystal | ||
| Liquid | ||
| By Application | Food & Beverage | Bakery and Confectionery |
| Beverages | ||
| Dairy and Frozen Products | ||
| Other | ||
| Pharmaceuticals | ||
| Personal Care & Cosmetics | ||
| Dietary Supplements and Sports Nutrition | ||
| Animal Feed | ||
| Others | ||
| By Geography | North America | United States |
| Canada | ||
| Mexico | ||
| Rest of North America | ||
| Europe | Germany | |
| France | ||
| United Kingdom | ||
| Netherlands | ||
| Italy | ||
| Rest of Europe | ||
| Asia Pacific | China | |
| India | ||
| Japan | ||
| Australia | ||
| Rest of Asia Pacific | ||
| South America | Brazil\ | |
| Argentina | ||
| Rest of South America | ||
| Middle East and Africa | Saudi Arabia | |
| South Africa | ||
| Rest of Middle East and Africa | ||


Key Questions Answered in the Report
How large is the vanillin market in 2026?
The vanillin market size stands at USD 1.21 billion in 2026 with an 8.09% CAGR outlook to 2031.
Which segment grows fastest over 2026-2031?
Natural vanillin shows the highest 8.42% CAGR as fermentation technology scales and clean-label demand rises.
What drives the shift toward liquid vanillin?
Immediate solubility and 14% shorter batch cycles in beverage plants position liquid formulations for an 8.22% CAGR.
Why are antidumping duties relevant to vanillin buyers?
U.S. tariffs of up to 379.87% on Chinese vanillin increase costs and drive buyers to diversify sourcing within ASEAN and Europe.
Page last updated on:


