Valves And Actuators Market Size and Share
Market Overview
| Study Period | 2020 - 2031 |
|---|---|
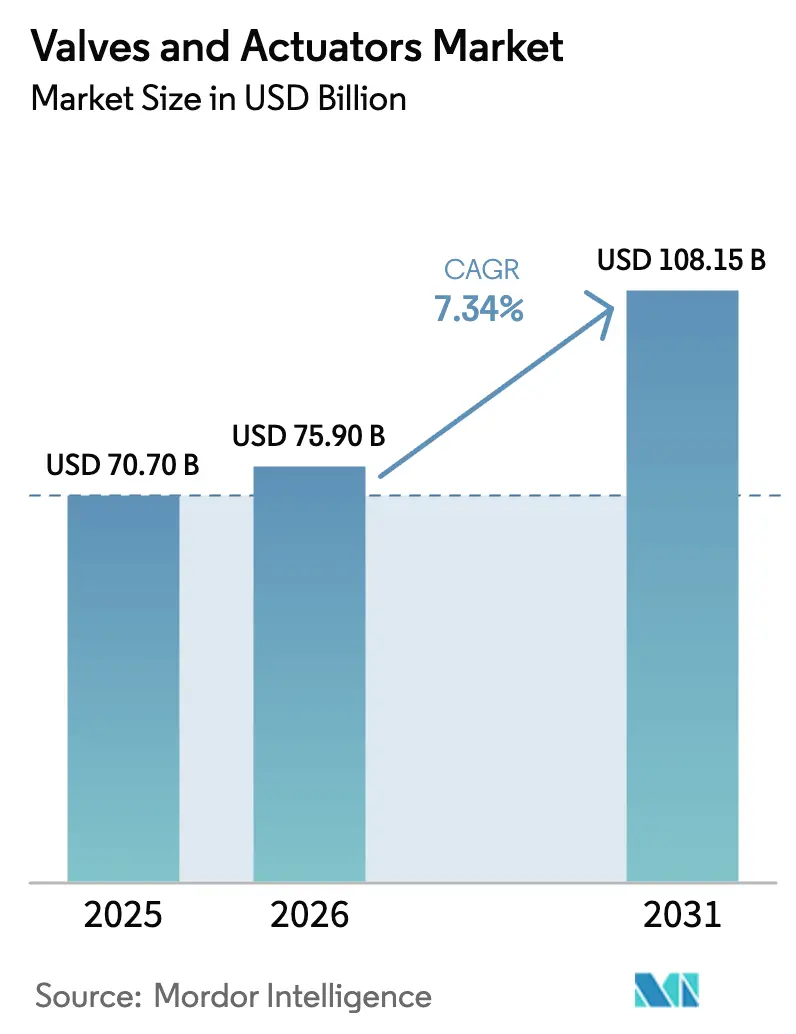
| Market Size (2026) | USD 75.90 Billion |
| Market Size (2031) | USD 108.15 Billion |
| Growth Rate (2026 - 2031) | 7.34% CAGR |
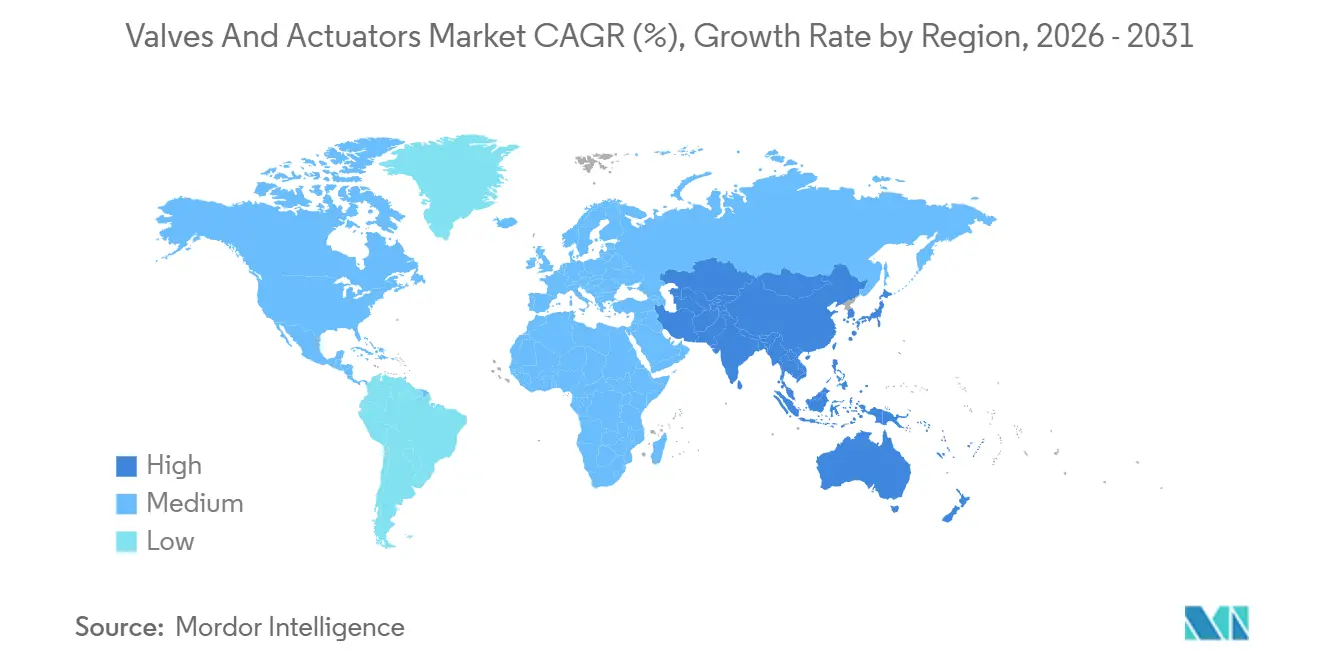
| Fastest Growing Market | Asia Pacific |
| Largest Market | North America |
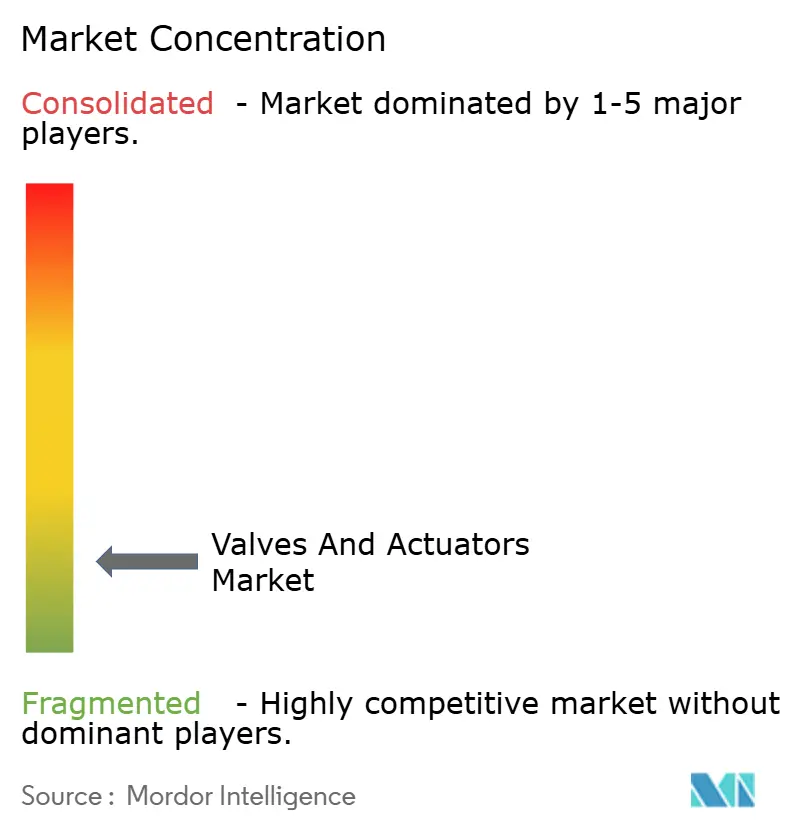
| Market Concentration | Low |
Major Players *Disclaimer: Major Players sorted in no particular order Image © Mordor Intelligence. Reuse requires attribution under CC BY 4.0. | |
Valves And Actuators Market Analysis by Mordor Intelligence
The Valves and actuators market size stood at USD 75.9 billion in 2026 and is projected to reach USD 108.15 billion by 2031 at a 7.34% CAGR. Digitalization mandates, fugitive-emission retrofits, hydrogen-ready designs and LNG infrastructure additions are synchronizing to sustain demand even as legacy refinery spending moderates. Ball valves remain the workhorse for shale wellheads, desalination feed lines and LNG loading arms, while predictive-maintenance software embedded in smart actuators is trimming unplanned downtime across chemical, water and power assets. Material selection is shifting toward stainless steel and super duplex alloys able to manage chloride-rich and hydrogen-embrittling media. At the same time, municipalities are deploying automated valve grids to stem non-revenue water, and OEMs are recasting their portfolios around cyber-secure, edge-analytical devices that comply with IEC 62443 standards.
Key Report Takeaways
- By product type, ball valves captured 28.73% of the Valves and actuators market share in 2025, while pressure relief and safety valves are advancing at an 8.21% CAGR through 2031.
- By actuator type, pneumatic actuators led with 37.63% revenue share in 2025 of the Valves and actuators market, whereas smart and intelligent variants are poised to rise at an 8.44% CAGR to 2031.
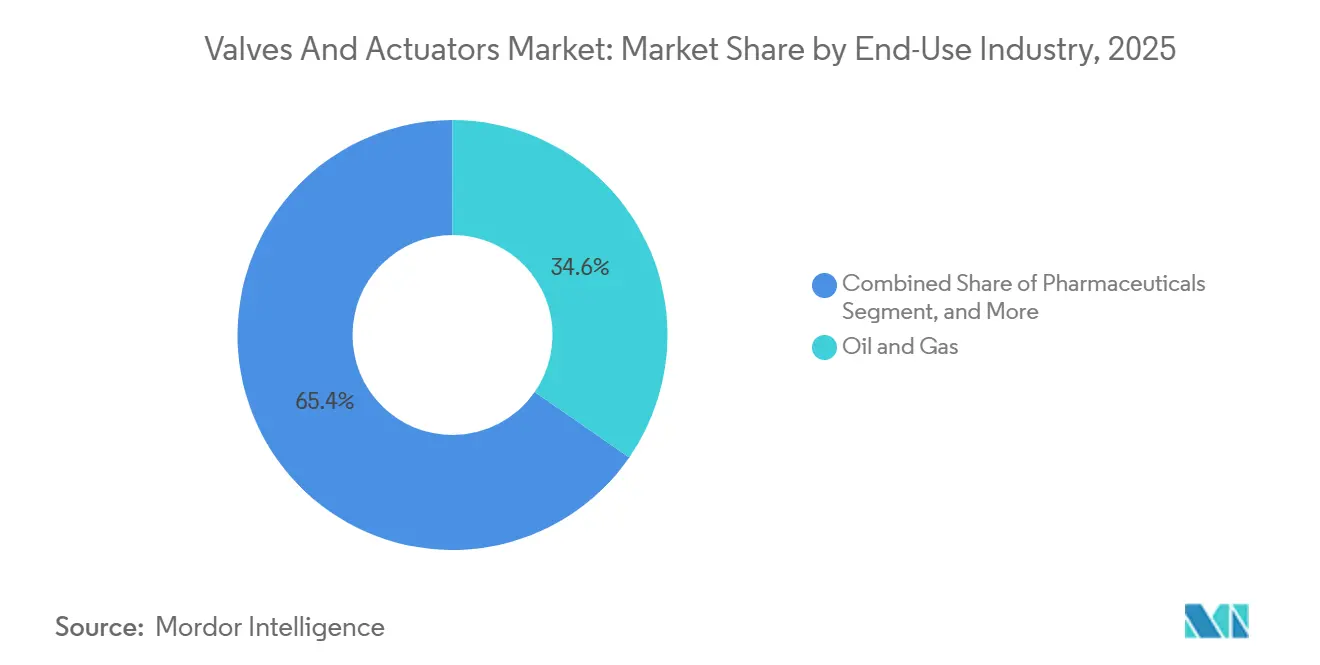
- By end-use, oil and gas accounted for 34.64% of demand in 2025 of the Valves and actuators market, but water and wastewater treatment is expanding at an 8.56% CAGR to 2031.
- By material, stainless steel commanded 42.62% share in 2025 of the Valves and actuators market, with plastic and composite alternatives growing at an 8.99% CAGR.
- By geography, North America held 38.73% of 2025 sales of the Valves and actuators market, whereas Asia Pacific is projected to climb at an 8.55% CAGR through 2031.
Note: Market size and forecast figures in this report are generated using Mordor Intelligence’s proprietary estimation framework, updated with the latest available data and insights as of January 2026.
Global Valves And Actuators Market Trends and Insights
Drivers Impact Analysis*
| Driver | (~) % Impact on CAGR Forecast | Geographic Relevance | Impact Timeline |
|---|---|---|---|
| Rapid adoption of Industry 4.0-enabled smart valves and actuators | +1.4% | Global, with early adoption in North America and Europe | Medium term (2-4 years) |
| Expansion of global desalination capacity, especially in MENA | +1.2% | Middle East and North Africa core, spillover to Asia Pacific | Long term (≥ 4 years) |
| LNG infrastructure build-out in North America and APAC | +1.3% | North America and Asia Pacific | Medium term (2-4 years) |
| Retrofit demand driven by fugitive-emission regulations | +1.1% | North America and Europe | Short term (≤ 2 years) |
| Shift to all-electric subsea production systems | +0.8% | Global offshore regions, concentrated in North Sea and Gulf of Mexico | Long term (≥ 4 years) |
| Hydrogen-ready valve designs for green-H₂ projects | +0.9% | Europe and Middle East, emerging in Asia Pacific | Long term (≥ 4 years) |
| Source: Mordor Intelligence | |||
Rapid Adoption of Industry 4.0-Enabled Smart Valves and Actuators
Operators are embedding edge processors and wireless sensors in valve assemblies to detect torque deviations and seal wear, converting reactive maintenance into condition-based programs that cut refinery downtime worth USD 500,000 per day.[1]Fisher FIELDVUE DVC7K Digital Valve Controller, Emerson Automation Solutions, emerson.com Emerson’s Fisher FIELDVUE DVC7K digital controller captures vibration signatures, while similar positioners from Siemens and ABB communicate over HART and PROFIBUS to legacy DCS platforms. Energy-harvesting modules now power diagnostics without the need for batteries, thereby lowering ownership costs in remote pipeline corridors. Compliance with ISO 50001 is accelerating the adoption of smart pneumatics, as they can reduce air consumption by 15%-20%. The resulting productivity gains reinforce the positive 1.4% impact on the Valves and actuators market CAGR.
Expansion of Global Desalination Capacity
Middle Eastern utilities are contracting reverse-osmosis megaprojects to ease water scarcity, adding a combined 12 million m³-per-day capacity by 2028.[2]World Energy Investment 2025, International Energy Agency, iea.org Dubai’s Hassyan plant, for example, specified motorized butterfly valves with IP68 protection against salt-spray corrosion. Similar projects in Egypt and Algeria mirror these specifications, reinforcing a steady pipeline for duplex-steel ball valves and nickel-aluminum-bronze alloys that support the Valves and actuators market.
LNG Infrastructure Build-Out
North America is adding 50 million tpa of liquefaction capacity, each train outfitted with cryogenic ball valves and triple-offset butterfly valves rated to -162 °C. Rotork won contracts for stainless-steel pneumatic actuators able to withstand low-temperature brittleness, while Asia Pacific follows with floating storage and regasification units in Zhejiang and Dahej. High safety standards under API 6FA raise entry barriers, fortifying revenue for vendors with proven cryogenic portfolios.
Retrofit Demand From Fugitive-Emission Rules
The United States EPA methane rule obliges quarterly leak audits, compelling replacement of 1.2 million valves by 2027.[3]Final Rule on Methane Emissions, U.S. Environmental Protection Agency, epa.gov Low-emission graphite packing can cut leaks by 95%, and ISO 15848-1 certification has become a purchasing prerequisite. Penalties of USD 10,000 per non-compliant valve in the Permian Basin create an immediate retrofit wave, magnifying the short-term uplift in the Valves and actuators market.
Restraints Impact Analysis*
| Restraint | (~) % Impact on CAGR Forecast | Geographic Relevance | Impact Timeline |
|---|---|---|---|
| Prolonged CAPEX slowdown in conventional oil and gas refining | -0.9% | Global, concentrated in Europe and North America | Medium term (2-4 years) |
| Supply-chain bottlenecks for castings and forgings | -0.7% | Global, acute in North America and Europe | Short term (≤ 2 years) |
| Skills gap in digital valve commissioning and maintenance | -0.5% | Global, most pronounced in emerging markets | Long term (≥ 4 years) |
| Cyber-hardening costs for connected flow-control assets | -0.4% | North America and Europe | Medium term (2-4 years) |
| Source: Mordor Intelligence | |||
Prolonged CAPEX Slowdown in Conventional Oil and Gas Refining
Integrated majors are diverting capital toward renewable fuels and carbon capture, reducing refinery projects by 12% year-on-year in 2025. Deferred fluid catalytic cracking upgrades eliminate near-term orders for high-temperature gate and globe valves, squeezing margins for suppliers tied to the hydrocarbon cycle. Vendors are pivoting to aftermarket services and digital retrofits, yet the chill subtracts 0.9% from the Valves and actuators market CAGR.
Supply-Chain Bottlenecks for Castings and Forgings
Foundries in North America and Europe are running at 85%-90% utilization, stretching lead times for large-diameter bodies to 18 weeks. Chinese overflow capacity contracted after energy-rationing mandates, pushing nickel-surcharge premiums up 10%. Dual sourcing in India and South Korea eases bottlenecks but adds four to six weeks for ASME certifications. The resulting price escalation weighs on cost-sensitive municipal water projects, trimming 0.7% from overall growth.
*Our forecasts treat driver/restraint impacts as directional, not additive. The impact forecasts reflect baseline growth, mix effects, and variable interactions.
Segment Analysis
By Valve Product Type: Ball Valves Anchor Upstream Reliability
Ball valves accounted for 28.73% of the Valves and actuators market in 2025, highlighting their quarter-turn simplicity and bubble-tight shutoff, which is essential for wellhead isolation. Pressure relief and safety valves are forecast to grow at a rate of 8.21% through 2031, as petrochemical complexes upgrade to API 520 designs following high-profile overpressure incidents.
The product spectrum is splintering into niche certifications such as API 607 fire-safe and BS 6364 cryogenic approvals, consolidating supplier bases around firms that can finance multiple test rigs. Control and butterfly valves are gaining ground in desalination and HVAC networks, while plug-valve adoption in slurry services spreads from Chilean tailings dams to Indonesian bauxite mines. These shifts preserve the momentum of the Valves and actuators market.


By Actuator Type: Pneumatics Persist but Smart Systems Surge
Pneumatic actuators led with 37.63% revenue share in 2025, favored for intrinsic safety in explosive zones and compatibility with existing air loops. Smart electric models, however, are accelerating at an 8.44% CAGR as asset-performance software tracks stroke counts and torque profiles in real time.
Electric units are displacing pneumatics in water utilities where energy audits spotlight compressed-air costs, while hydraulic designs remain entrenched in subsea trees until all-electric systems scale. ABB’s MotorSense actuator, which harvests vibration energy to power onboard sensors, exemplifies cost-saving innovation. This bifurcation sustains healthy competition within the Valves and actuators market.
By End-Use Industry: Water Treatment Outpaces Oil and Gas
Oil and gas applications still represented 34.64% of 2025 demand, yet water and wastewater utilities are expanding at 8.56% through 2031 on the back of USD 55 billion in U.S. infrastructure funding. Automated valve grids reduce non-revenue water by 18% in pilot studies.
Chemical processors are embracing digital control to cut batch variability, while mining projects in Chile and Australia specify abrasion-resistant valves for mineral slurries. Pharmaceutical and food plants prioritize sanitary, single-use assemblies, underscoring a structural tilt that diversifies the Valves and actuators market.
By Material: Stainless Steel Dominates but Composites Gain
Stainless steel captured 42.62% share in 2025 thanks to its corrosion resistance in chloride and hydrogen environments. Plastic and composite valves are growing at 8.99%, riding demand for PVDF-lined units that eliminate ion leaching in drug manufacturing.
Alloy prices surged when Indonesian nickel exports tightened, spurring exploration of cobalt-free alternatives for hydrogen duties. Composite options offer 30%-40% weight savings on offshore platforms, lowering crane rentals and installation risks. Such material innovation supports continuous evolution within the Valves and actuators market size discussion.
Geography Analysis
North America retained leadership in 2025 with 38.73% of global revenue as shale play monetization and Gulf Coast LNG projects collectively required up to 500,000 valves. Installed-base services generate nearly half of regional turnover, cushioning suppliers from project lulls. Asia Pacific is forecast to register an 8.55% CAGR through 2031, propelled by China’s coal-to-chemicals complexes and India’s smart-city water grids, trends that will steadily lift the Valves and actuators market size in the region.
Europe’s valve demand is driven more by replacement than expansion as the Industrial Emissions Directive compels chemical plants to retrofit low-emission stems every six months. Refineries, however, are shuttering or converting to biofuels, trimming orders for large-bore isolation valves. South America shows episodic spikes tied to Brazil’s pre-salt fields and Argentina’s Vaca Muerta pipelines, yet municipal water spending remains constrained by fiscal headwinds.
The Middle East and Africa rely heavily on desalination and petrochemical megaprojects. High-salinity feedwater cuts butterfly-valve life cycles to five-seven years, guaranteeing a steady aftermarket. Nigeria’s Dangote refinery and Egypt’s Zohr gas field have set precedents for large-scale procurement, though regional distributor networks are still maturing. These geographic dynamics collectively reinforce long-term growth prospects for the Valves and actuators market.

Competitive Landscape
The supplier landscape remains highly fragmented, with the top 10 suppliers accounting for a limited share of global sales, consistent with a low market concentration profile. Scale players such as Emerson, Flowserve, and Rotork monetize installed-base service contracts that deliver nearly half of automation revenue. Their digital-twin platforms differentiate them from regional specialists that compete on customization speed for hydrogen, cryogenic, and sanitary niches.
Technology innovation shapes current competition. ABB has patented a self-diagnosing actuator that predicts seal failure 90 days in advance, while Bürkert’s modular valve islands reduce panel footprints by 40%, offering tangible savings to pharmaceutical plants. Commodity pneumatic segments face intense pricing from Chinese imports that undercut Western catalogs by up to 30%, forcing incumbents to focus on smart, engineered-to-order product lines.
Mergers and acquisitions continue but at smaller scales, for instance, Crane’s 2024 purchase of a cryogenic-valve specialist deepened its LNG portfolio, whereas Emerson’s 2025 acquisition of a European smart-actuator firm added 120 wireless-sensor engineers. Compliance with IEC 62443 creates a cybersecurity moat, making certification capacity a decisive factor in upcoming bids and sustaining competition intensity within the Valves and actuators market.
Valves And Actuators Industry Leaders
Emerson Electric Co.
Schlumberger Limited
Alfa Laval Corporate AB
Flowserve Corporation
Crane Company
- *Disclaimer: Major Players sorted in no particular order

Recent Industry Developments
- December 2025: Emerson Electric completed the acquisition of a European smart-actuator specialist for EUR 180 million (USD 195 million).
- November 2025: Flowserve secured a USD 85 million order for cryogenic valves for an Australian LNG export terminal.
- October 2025: Rotork launched the N05-A fully electric subsea actuator rated for 3,000 m water depth.
- September 2025: Siemens partnered with a Middle Eastern EPC firm to co-develop hydrogen-compatible control valves for the NEOM project.


Global Valves And Actuators Market Report Scope
The Valves and Actuators Market Report is Segmented by Valve Product Type (Ball, Butterfly, Gate/Globe/Check, Plug, Control, Pressure Relief/Safety, Other Types), Actuator Type (Hydraulic, Pneumatic, Electric, Electro-hydraulic, Mechanical, Smart/Intelligent, Other Types), End-Use Industry (Oil and Gas, Power Generation, Chemical and Petrochemical, Water and Wastewater, Mining and Metals, Pharmaceuticals, Food and Beverage, Pulp and Paper, HVAC and Building Services, Marine and Shipbuilding, Other Industries), Material (Stainless Steel, Carbon Steel, Alloy-based, Cast Iron, Plastic and Composite, Cryogenic-service Materials, Other Materials), and Geography (North America, South America, Europe, Asia-Pacific, Middle East and Africa). The Market Forecasts are Provided in Terms of Value (USD).
| Ball |
| Butterfly |
| Gate/Globe/Check |
| Plug |
| Control |
| Pressure Relief / Safety |
| Other Valve Product Types |
| Hydraulic |
| Pneumatic |
| Electric |
| Electro-hydraulic |
| Mechanical |
| Smart / Intelligent |
| Other Actuator Types |
| Oil and Gas |
| Power Generation |
| Chemical and Petrochemical |
| Water and Wastewater |
| Mining and Metals |
| Pharmaceuticals |
| Food and Beverage |
| Pulp and Paper |
| HVAC and Building Services |
| Marine and Shipbuilding |
| Other End-Use Industries |
| Stainless Steel |
| Carbon Steel |
| Alloy-based (Duplex, Inconel, etc.) |
| Cast Iron |
| Plastic and Composite |
| Cryogenic-service Materials |
| Other Materials |
| North America | United States | |
| Canada | ||
| Mexico | ||
| South America | Brazil | |
| Argentina | ||
| Rest of South America | ||
| Europe | Germany | |
| United Kingdom | ||
| France | ||
| Italy | ||
| Spain | ||
| Rest of Europe | ||
| Asia-Pacific | China | |
| Japan | ||
| India | ||
| South Korea | ||
| ASEAN | ||
| Rest of Asia-Pacific | ||
| Middle East and Africa | Middle East | Saudi Arabia |
| United Arab Emirates | ||
| Rest of Middle East | ||
| Africa | South Africa | |
| Nigeria | ||
| Rest of Africa | ||
| By Valve Product Type | Ball | ||
| Butterfly | |||
| Gate/Globe/Check | |||
| Plug | |||
| Control | |||
| Pressure Relief / Safety | |||
| Other Valve Product Types | |||
| By Actuator Type | Hydraulic | ||
| Pneumatic | |||
| Electric | |||
| Electro-hydraulic | |||
| Mechanical | |||
| Smart / Intelligent | |||
| Other Actuator Types | |||
| By End-Use Industry | Oil and Gas | ||
| Power Generation | |||
| Chemical and Petrochemical | |||
| Water and Wastewater | |||
| Mining and Metals | |||
| Pharmaceuticals | |||
| Food and Beverage | |||
| Pulp and Paper | |||
| HVAC and Building Services | |||
| Marine and Shipbuilding | |||
| Other End-Use Industries | |||
| By Material | Stainless Steel | ||
| Carbon Steel | |||
| Alloy-based (Duplex, Inconel, etc.) | |||
| Cast Iron | |||
| Plastic and Composite | |||
| Cryogenic-service Materials | |||
| Other Materials | |||
| By Geography | North America | United States | |
| Canada | |||
| Mexico | |||
| South America | Brazil | ||
| Argentina | |||
| Rest of South America | |||
| Europe | Germany | ||
| United Kingdom | |||
| France | |||
| Italy | |||
| Spain | |||
| Rest of Europe | |||
| Asia-Pacific | China | ||
| Japan | |||
| India | |||
| South Korea | |||
| ASEAN | |||
| Rest of Asia-Pacific | |||
| Middle East and Africa | Middle East | Saudi Arabia | |
| United Arab Emirates | |||
| Rest of Middle East | |||
| Africa | South Africa | ||
| Nigeria | |||
| Rest of Africa | |||


Key Questions Answered in the Report
How fast is the Valves and actuators market expected to grow through 2031?
The market is projected to expand from USD 75.9 billion in 2026 to USD 108.15 billion by 2031 at a 7.34% CAGR.
Which product type currently dominates global demand?
Ball valves led sales in 2025, accounting for 28.73% of global revenue thanks to their quarter-turn reliability in oil, gas and water applications.
What segment is growing the quickest?
Pressure relief and safety valves are forecast to register the fastest growth, rising at an 8.21% CAGR through 2031 as safety standards tighten.
Why are smart actuators gaining traction?
Intelligent electric actuators with embedded diagnostics enable predictive maintenance that cuts plant downtime and compressed-air costs, driving an 8.44% CAGR for the category.
Which region offers the strongest growth outlook?
Asia Pacific is set to record an 8.55% CAGR to 2031, propelled by industrial expansion in China and urban water investments in India.
Page last updated on:


