
Utility Locator Market Size and Share
Market Overview
| Study Period | 2020 - 2031 |
|---|---|
| Market Size (2026) | USD 1.03 Billion |
| Market Size (2031) | USD 1.38 Billion |
| Growth Rate (2026 - 2031) | 6.02 % |
| Fastest Growing Market | Asia Pacific |
| Largest Market | North America |
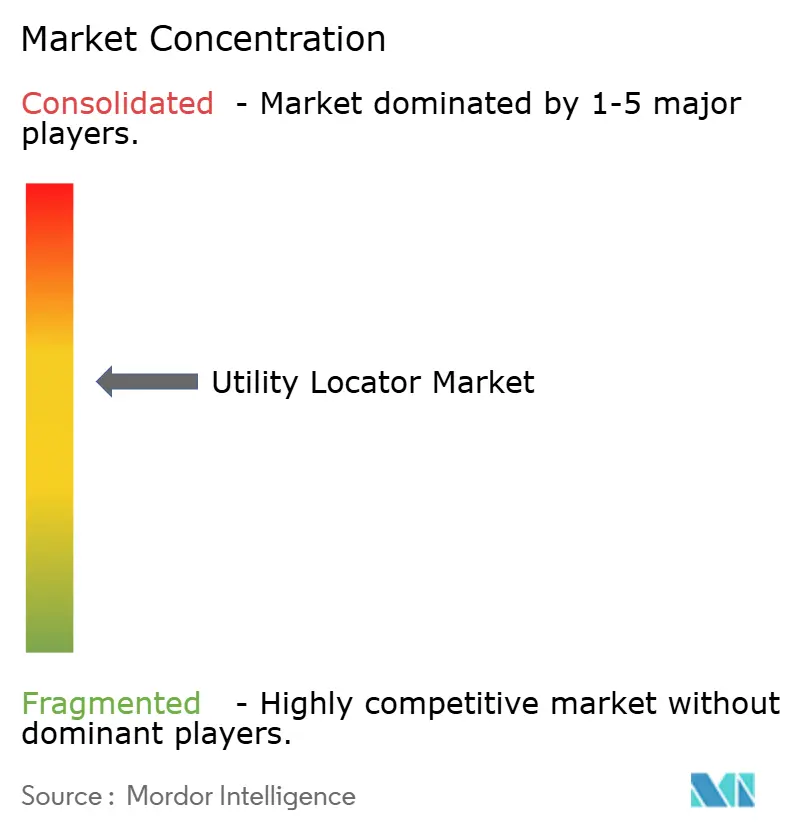
| Market Concentration | Medium |
Major Players *Disclaimer: Major Players sorted in no particular order Image © Mordor Intelligence. Reuse requires attribution under CC BY 4.0. | |
Utility Locator Market Analysis by Mordor Intelligence
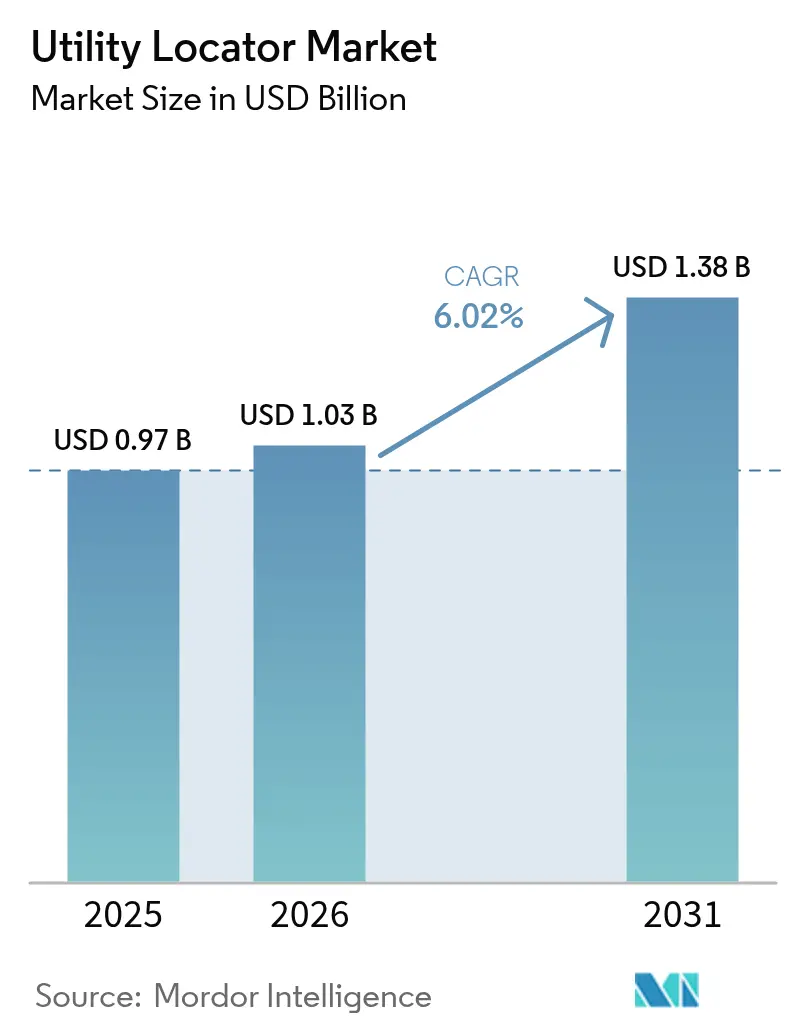
utility locator market size in 2026 is estimated at USD 1.03 billion, growing from 2025 value of USD 0.97 billion with 2031 projections showing USD 1.38 billion, growing at 6.02% CAGR over 2026-2031. Growth is fueled by the collision of aging infrastructure, stricter dig‐safety mandates, and next-generation subsurface imaging that transforms risk management into a continuous, data-driven workflow. Real-time detection expectations, expanding fiber-optic programs, and grid-resilience undergrounding each elevate spend on both equipment and service-based solutions, while copper-price inflation spurs design shifts toward alternative materials. Meanwhile, private equity interest, automation investments, and workforce constraints are reshaping competitive strategies across the utility locator market.
Key Report Takeaways
- By offering, equipment led with 67.30% revenue share in 2025; services are projected to expand at a 7.12% CAGR through 2031.
- By target, metallic utilities held 53.40% of the utility locator market share in 2025, while non-metallic detection is forecast to grow at a 6.79% CAGR to 2031.
- By technique, electromagnetic detection commanded 46.40% of the utility locator market size in 2025; ground penetrating radar (GPR) is advancing at a 6.52% CAGR.
- By application, oil and gas pipelines accounted for a 28.60% share of the utility locator market size in 2025, whereas telecommunications and fiber deployments are moving at a 7.46% CAGR.
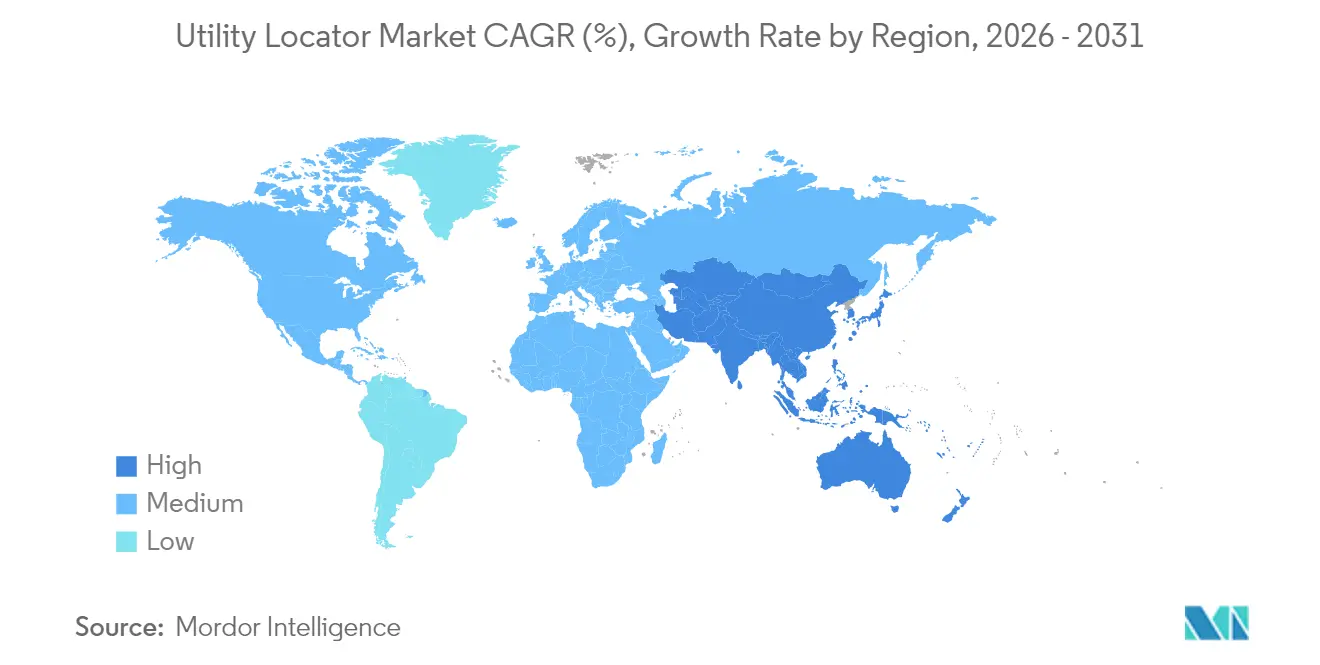
- By geography, North America retained 34.70% share in 2025; Asia Pacific is set to post the fastest 7.46% CAGR
Note: Market size and forecast figures in this report are generated using Mordor Intelligence’s proprietary estimation framework, updated with the latest available data and insights as of 2026.
Market Trends and Insights
Drivers Impact Analysis of Utility Locator Market*
| Driver | (~) % Impact on CAGR Forecast | Geographic Relevance | Impact Timeline |
|---|---|---|---|
| Surge in real-time detection demand | +1.2% | Global, led by North America and Europe | Medium term (2–4 years) |
| Infrastructure-age driven inspections | +0.9% | North America and Europe core, expanding to APAC | Long term (≥ 4 years) |
| Mandatory 811 / Call-Before-You-Dig laws | +0.8% | North America dominance, selective EU adoption | Short term (≤ 2 years) |
| Fiber-optic build-outs requiring precise locates | +1.1% | Global, with APAC and North America leading | Medium term (2–4 years) |
| AI-enabled remote utility mapping platforms | +0.7% | North America and Europe early adoption, APAC following | Long term (≥ 4 years) |
| Grid-resilience undergrounding programs | +0.6% | North America and Europe focus, climate-driven expansion | Long term (≥ 4 years) |
| Source: Mordor Intelligence | |||
Surge in Real-Time Detection Demand
Construction schedules are compressing while the average utility strike costs USD 56,000 in damages, prompting owners and contractors to shift from pre-dig checks toward continuous, real-time asset verification. AT&T’s AI-driven workflow integration illustrates how major network operators embed predictive locates into daily operations. Distributed fiber-optic sensing now turns in-place fiber into live vibration monitors that flag excavation risks. City projects with dense utilities require instant verification before every trench pull, making cloud-connected electromagnetic receivers and multichannel GPR the default toolkit. Vendors respond with mobile apps that stream field data and alert crews the moment proximity thresholds are breached. This behavior change reframes utility location as an ongoing protection service, not a one-time pre-dig step, enlarging the utility locator market.
Infrastructure-Age Driven Inspections
The Infrastructure Investment and Jobs Act directs USD 550 billion to U.S. projects through 2026, much of it earmarked for underground asset renewal. Machine-learning models now rank pipe sections by failure likelihood, pushing utilities to scan 19% of networks across an 11-year cycle.[1]Fabrizio Arrichiello, “Machine Learning for Water Pipeline Monitoring,” MDPI, mdpi.com Condition assessment demands deeper imaging than legacy locates, so water authorities combine multichannel GPR with electromagnetic verification to gauge wall thickness and corrosion. Fiber-optic strain gauges embedded along mains enable permanent structural health monitoring, tying locators into asset-management platforms. As pipeline lifespans shorten and leak-risk liability rises, demand shifts from basic mark-outs toward data-rich subsurface twins, driving incremental spend inside the utility locator market.
Mandatory 811 / Call-Before-You-Dig Laws
The Common Ground Alliance counts more than 450,000 annual strikes in the United States, motivating regulators to toughen penalties and audit accuracy. Private utility lines, representing more than 60% of all buried assets, often sit outside traditional one-call coverage, opening a large private-locate service niche. Recent water-main breaks in Katy, Texas triggered emergency moratoriums on fiber work, spotlighting the cost of inaccurate locates. Transportation departments now demand survey-grade subsurface maps during project design, forcing contractors to procure high-resolution utility data before bid submission. This policy trend expands the addressable utility locator market and rewards providers that certify accuracy through integrated GPR and GPS workflows.
Fiber-Optic Build-Outs Requiring Precise Locates
Fiber now reaches 55.6% of U.S. households and drives a USD 125-250 billion global network build each year. Micro-trenching in congested rights-of-way needs millimeter-level accuracy to avoid gas, power, and storm lines. Reports linking Arizona fiber rollouts to service disruptions underscore reputational risks when locates go wrong. Contractors, therefore, use hybrid systems pairing electromagnetic locators for metallic plant with AI-enhanced GPR for plastic conduit. Utility owners are codifying fiber-specific separation rules, so advanced detection methods secure premium pricing. These projects significantly increase the utility locator market’s service revenue pool, especially in Asia Pacific, where China’s USD 551 billion underground program accelerates demand.[2]“China Pledges USD 551 Billion for Underground Infrastructure,” South China Morning Post, scmp.com
Restraints Impact Analysis of Utility Locator Market*
| Restraint | (~) % Impact on CAGR Forecast | Geographic Relevance | Impact Timeline |
|---|---|---|---|
| High equipment AND upkeep costs | -0.8% | Global, with acute impact in price-sensitive emerging markets | Short term (≤ 2 years) |
| Shortage of trained GPR/EM technicians | -1.1% | North America and Europe acute, expanding globally | Medium term (2–4 years) |
| Urban RF interference degrading accuracy | -0.6% | Urban centers globally, particularly dense metropolitan areas | Medium term (2–4 years) |
| Disparate subsurface data standards | -0.4% | Global, with regional variations in implementation | Long term (≥ 4 years) |
| Source: Mordor Intelligence | |||
High Equipment and Upkeep Costs
A multichannel GPR array can cost up to USD 100,000, while premium electromagnetic receivers approach USD 5,000; rental fees still tally USD 400 per month for GPR and USD 300 per week for EM devices. Record copper prices at USD 5.20 per pound in 2024 drove 45% spikes in wire costs, pushing manufacturers to explore aluminum substitutes and printed-circuit antennas. Annual calibration contracts, mandated by many public owners, add thousands of dollars in service overhead. Smaller service firms struggle to amortize equipment capital across intermittent work, slowing uptake in price-sensitive regions. Equipment-as-a-service models emerge, yet margins depend on high utilization, limiting viability for rural contractors. The cost hurdle restrains broader adoption within the utility locator market until hardware prices stabilize.
Shortage of Trained GPR/EM Technicians
Fiber construction alone needs 28,000 more workers, but utility locating demands specialized competencies in electromagnetic theory, GPR signal reading, and safety standards. Certification courses run USD 1,000–3,000 and require multiday field practicums, creating entry barriers. Experienced GPR analysts remain scarce because interpretation blends geophysics and civil-engineering knowledge. CASE Construction Equipment now markets productivity‐boosting machines aimed at crews struggling with labor gaps. Vendors are embedding AI auto-classification in GPR software to offset skill shortages, yet complex urban soil conditions still require expert review. Labor scarcity, therefore, limits operational capacity, tempering growth despite an expanding utility locator market.
*Our forecasts treat driver/restraint impacts as directional, not additive. The impact forecasts reflect baseline growth, mix effects, and variable interactions.
Utility Locator Market Segment Analysis
By Offering:
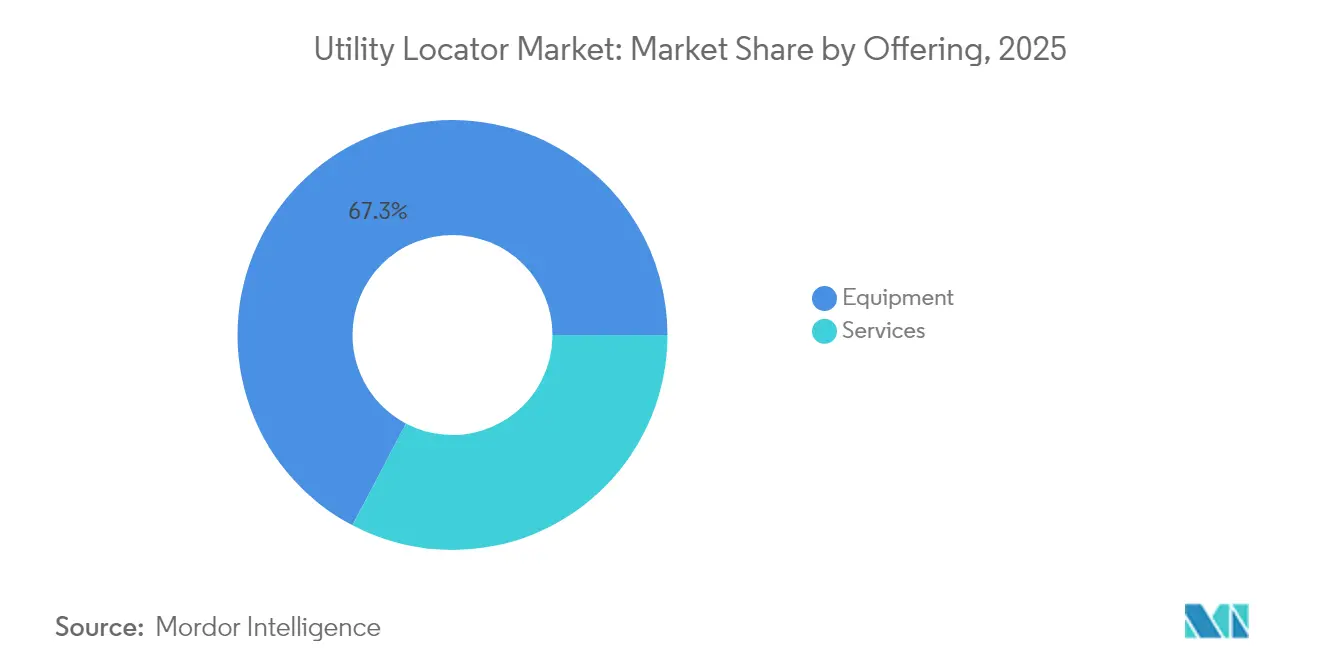
Services Gain Momentum Despite Equipment LeadEquipment contributed USD 652.81 million in 2025, translating into a 67.30% slice of the utility locator market. The installed base of electromagnetic transmitters, cable fault locators, and multichannel GPR rigs remains pivotal because contractors cannot perform field work without hardware. However, service revenue is accelerating at a 7.12% CAGR. Telecom carriers, water utilities, and city agencies increasingly outsource the entire locate workflow, favoring turnkey deliverables that blend on-site scanning with data curation and regulatory reports. The utility locator market size for services is projected to reach USD 479.12 million by 2031. Digital twin platforms, AI hit-rate dashboards, and guarantees against damage enhance contract value, enabling service providers to command premium pricing against capital-heavy equipment buyers.
Broader risk-transfer trends also lift services. Insurers now reward developers who use certified locators, steering demand toward third-party specialists. Equipment vendors react by bundling software and field support, shifting their model toward equipment-as-a-service. This hybrid pathway blurs the historical line between gear suppliers and service contractors, intensifying competition and fueling cross-border acquisitions that reshape the utility locator industry.



By Target:
Non-Metallic Detection RisesMetallic pipelines, cables, and conduits still dominated 53.40% of the target landscape in 2025, thanks to steel transmission lines and copper electricity feeders. This share represents USD 517.98 million of the utility locator market size. Yet plastic water mains and fiber conduits are proliferating, causing non-metallic detection revenue to climb 6.79% annually. Advancements in stepped-frequency GPR and pipe-in-pipe acoustic probes deliver reliable depth estimation of PVC and HDPE assets, narrowing historical accuracy gaps. Smart city regulations now compel municipalities to store data for all buried assets regardless of material, boosting the utility locator market.
As replacement cycles pivot toward corrosion-free plastics, locators must refine techniques such as ground-coupled antennas at dual polarizations or traceable wire inserts. Research published on multi-frequency GPR shows depth error reduction below 10 cm for dry soils, reaffirming the technology’s readiness. These technical leaps accelerate adoption for plastic gas laterals and empty duct banks, reinforcing momentum inside the utility locator industry.
By Technique:
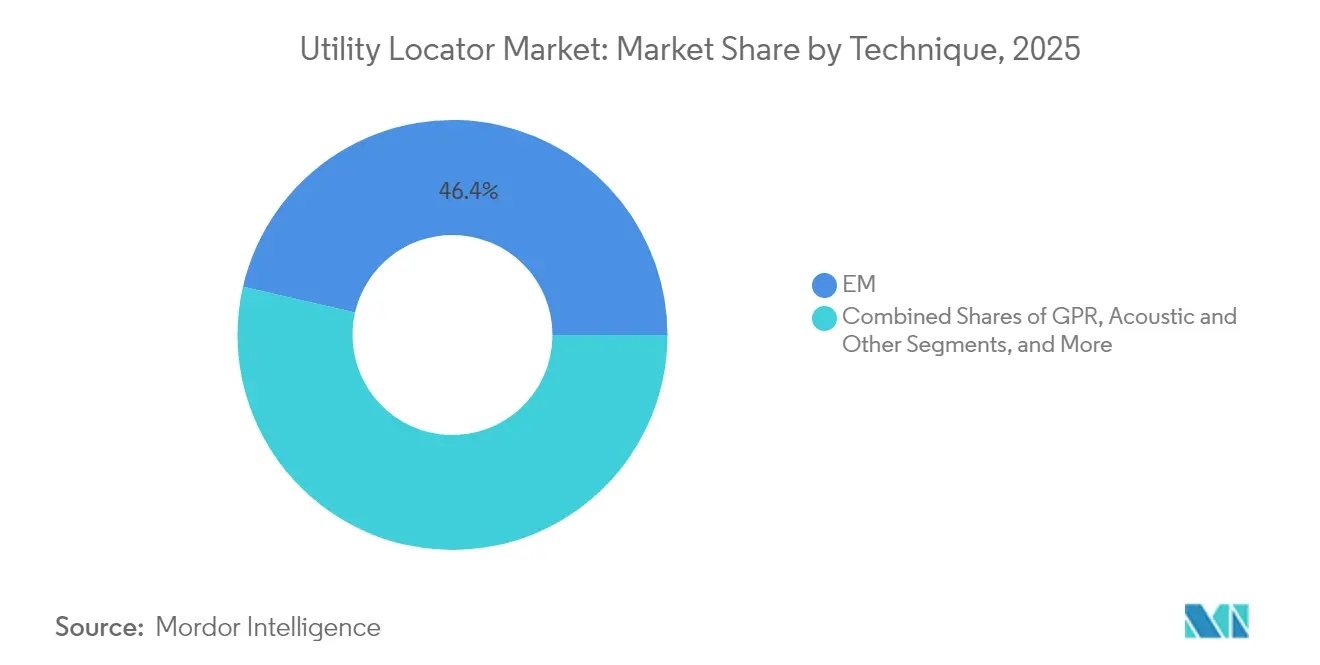
GPR Advances While EM Retains Core PositionElectromagnetic (EM) field detection held 46.40% revenue in 2025, equal to USD 450.08 million, due to its cost-effectiveness for metallic targets and ease of operator training. Nonetheless, utility locator market demand for high-definition subsurface imagery propels GPR revenue to a 6.52% CAGR, pushing its share toward 37% by 2031. AI-enabled software now creates live tomographic renders, removing the need for expert post-processing. Screening Eagle’s GS9000 update illustrates this feature, live-streaming depth slices to tablets for immediate interpretation.
EM remains indispensable for long linear searches on metallic lines where depth-to-length ratios are favorable. Combined EM+GPR workflows are therefore increasing, with integrated rigs capturing both signals in one pass. Vendors invest in cross-sensor fusion algorithms, feeding cloud engines that assign confidence scores to each detected object. This convergence drives recurring software licenses and positions data analytics as a fresh revenue pillar for the utility locator market.
By Application:
Telecom Surges to Challenge Oil and GasOil and gas pipelines accounted for 28.60% of 2025 revenue, translating into USD 277.42 million as operators comply with spill-prevention mandates. However, telecom and fiber projects expand at 7.46% annually on the back of 5G densification and broadband stimulus. Utility locator market share for telecom is expected to eclipse 25% by 2031. Fiber micro-trenching requires near-continuous locates along narrow slits just 2 inches wide, forcing contractors to deploy compact cart-based GPR and electromagnetic sondes.
Electric grid modernization adds steady work as transmission owners place cables underground to mitigate wildfire risk. Water and sewage agencies fund leak-reduction programs, pairing GPR with hydrophone surveys to pin down pipe breakpoints. Rail projects, though niche, demand high-accuracy locates at level crossings and tunnel sections. The resulting multi-sector pull secures volume growth while insulating revenues from single-industry downturns across the broader utility locator market.
Geography Analysis
North America Utility Locator Market
North America captured 34.70% of 2025 revenue, anchored by mandatory 811 compliance and large-scale replacement of legacy cast-iron gas mains. The United States alone processed more than 38 million one-call tickets, creating a robust baseline for the utility locator market. Wage pressures and a mature rental ecosystem sustain high equipment turnover, supporting premium EM and GPR sales even amid cost inflation.
APAC Utility Locator Market
Asia Pacific, propelled by China’s USD 551 billion underground investment plan, exhibits the fastest 7.46% CAGR through 2031. Megacity metro extensions, smart road corridors, and national fiber backbones demand mass deployment of multichannel GPR vans and drone-mounted sensors. India’s Smart Cities Mission adds further momentum through mandates for comprehensive subsurface records in 100+ urban centers. The region’s accelerating adoption narrows the revenue gap with North America, setting the stage for leadership shifts in the utility locator market.
Europe Utility Locator Market
Europe maintains balanced growth as utility owners digitize century-old asset records. The United Kingdom’s nationwide mapping initiative pushes contractors to achieve survey-grade accuracy, while Germany channels climate-adaptation funds into grid undergrounding. Urban radio-frequency noise, especially in older city cores, challenges EM performance, which in turn boosts GPR demand. Emerging Eastern European markets lean on EU cohesion grants to upgrade water networks, providing fresh service opportunities. Collectively, these programs reinforce a steady long-term outlook for the utility locator market in Europe.

Regulatory Landscape
Dig-safety compliance continues to tighten through one-call laws and positive-response requirements that shape locating workflows in practice. In Washington State, amendments to RCW 19.122 that took effect January 1, 2026 prohibit excavators from starting work until they receive positive response confirmation from all facility operators in the identified area, and the Washington Utilities and Transportation Commission oversees minimum standards and best management practices for one-number locator services. Separately, the North Carolina Underground Utility Safety and Damage Prevention Act (updated 2025) requires that new facilities installed by or on behalf of operators be electronically locatable using industry-accepted methods, reinforcing demand for detectable materials and compliant marking and locate processes.
Standards and mapping programs increasingly define what subsurface utility data quality looks like in procurement and project delivery. ASCE 38-22 (which replaced ASCE 38-02) is positioned as a technical framework for subsurface utility engineering and quality levels for utility location data, while programs such as California SB 1221 filings (initial utility mapping compliance filings completed by July 1, 2025 for PG&E and other major gas investor-owned utilities) raise expectations for public-facing pipeline replacement maps and clearer jurisdictional boundaries. Louisiana Senate Bill 390 (2026 Session) also signals a shift toward statewide digital utility mapping by directing the Public Service Commission to compile parish-by-parish digital utility maps with a minimum 85% accuracy rating, with completion targeted by December 31, 2032.
Value Chain Analysis
The value chain starts with component and subsystem suppliers, including antennas, GNSS modules, batteries, ruggedized electronics, and software, which supply OEMs that manufacture electromagnetic locators, GPR systems, and hybrid platforms. OEMs such as Radiodetection and Fluke increasingly bundle hardware with cloud analytics and data capture, while specialized mapping software providers (for example, ProStar PointMan and GPRS SiteMap) sit alongside equipment to produce digital deliverables for owners, designers, and contractors. Channel partners and dealers also remain important for training, rental, and service support, with downstream participants including one-call centers, facility operators, engineering firms delivering subsurface utility engineering outputs, and third-party locating contractors that execute field work and documentation.
Workflow and compliance requirements are shifting where value accrues, moving activity from standalone equipment sales toward integrated field intelligence and auditable records. Radiodetection integrated UTTO Locate Assurance analytics into its Locate Performance Management system (July 2025), and Fluke announced SmartTrace 2082 Series locators with connectivity to the PointMan mapping platform (March 2026), reflecting tighter coupling between detection and mapping. Partnerships are also extending the chain into active damage prevention, with RodRadar partnering with Xwatch Safety Solutions (July 2026) to link detection to automated excavator stop capability, moving locating from a mark-out activity toward machine-interlocked risk control where software integration and data integrity become differentiators.
Competitive Landscape
The competitive field blends established hardware makers with software-centric disruptors. Radiodetection, Subsite Electronics, Leica Geosystems, and Vivax-Metrotech leverage broad catalogs and dealer footprints to protect their share. Radiodetection’s partnership with Trimble Catalyst now provides centimeter-level positioning within its Precision Locator range. Subsite introduces semiautonomous GPR carts that self-calibrate between passes, reducing operator workload.
Investment capital continues to flow. Exodigo closed a USD 118 million round to refine AI-driven underground mapping that fuses sensor data into 3D point clouds. 4M Analytics reached 2,500 miles of mapped utilities and cut agency records research time by 95%. Service firms like United States Infrastructure Corporation attracted private-equity backing from Partners Group, signaling confidence in scalable locate outsourcing
Cost pressures trigger materials R&D, with Copperweld promoting bimetallic wires that curb copper consumption. Vermeer’s 2025 launch of the Verifier G3+ FLX locator adds fault-finding to its drill-rig customer base vermeer.com. The interplay of software analytics, sensor miniaturization, and integrated services intensifies competition, positioning data accuracy rather than hardware specs as the defining differentiator within the utility locator market.
Utility Locator Industry Leaders
Vivax-Metrotech
Emerson Electric
Geophysical Survey Systems, Inc
Radiodetection Ltd.
Guideline Geo
- *Disclaimer: Major Players sorted in no particular order
Utility Locator Market Companies Covered in this Report
- Radiodetection Ltd.
- Subsite Electronics
- Leica Geosystems
- Vivax-Metrotech
- Guideline Geo
- Sensors and Software Inc.
- Geophysical Survey Systems Inc.
- Emerson Electric Co.
- ProStar Holdings Inc.
- Irth Solutions
- Ridge Tool (RIDGID)
- Honeywell International Inc.
- Vermeer Corporation
- 4M Analytics
- GPRS Inc.
- Trimble Inc.
- Hexagon AB
- 3M Company
- Schonstedt Instrument Co.
- PipeHunter

Market Opportunities and Future Outlook
A key whitespace is converting locating outcomes into standardized, digital, design-ready utility intelligence that can stand up in multi-year capital programs. ASCE 38-22 provides the quality-level framework for subsurface utility engineering, and ASCE 75-22 focuses on recording and exchanging utility infrastructure data, creating a pull for platforms that can capture field observations, attach confidence and quality metadata, and deliver outputs compatible with BIM and digital-twin workflows. Public sector adoption provides an evidence anchor, with Minnesota Department of Transportation deploying an AI-driven utility intelligence platform across 12,000 miles of highway network (May 2026), and similar deployments increase demand for both advanced sensors and services that can maintain continuously updated subsurface inventories.
Technology-driven opportunity centers on reducing the skill and interpretation burden while raising accuracy for non-metallic and complex urban environments. Fluke launched SmartTrace 2082 Series underground locators integrating with the ProStar PointMan platform (March 2026), illustrating how locator hardware is positioned as a connected node in a broader mapping and compliance workflow rather than as a standalone tool. On the R&D side, Purdue University published work in January 2026 on quantifying uncertainty in GPR-derived pipe parameters, and academic results in June 2026 reported 95.6% positioning accuracy for urban underground pipelines using BIM-integrated graph optimization, which supports product roadmaps emphasizing confidence scoring, sensor fusion, and digital delivery requirements rather than incremental hardware-only performance gains.
Recent Industry Developments in Utility Locator Market
- May 2026: Emerson announced a contract with Oncor Electric Delivery Company LLC to implement AspenTech Digital Grid Management solutions aimed at optimizing real-time grid operations. While the engagement focuses on grid operations software, it reinforces utility-owner demand for higher quality, timely network data and operational visibility. That improves the value of accurate underground asset records that locating and mapping workflows help produce.
- March 2026: Geophysical Survey Systems, Inc. (GSSI) announced a collaboration with Topcon Positioning Systems to integrate GSSI ground penetrating radar with Topcon GNSS and mass-data workflow software. The integration supports survey-grade, georeferenced subsurface datasets and strengthens combined GPR plus positioning workflows used for design documentation and damage-prevention traceability.
- August 2025: Vivax-Metrotech opened a new RM48 million manufacturing facility in Penang, Malaysia, with 16 production lines to support global demand for utility locating technology. The expansion increases supply capacity and geographic redundancy, which helps shorten lead times and improve availability of locating equipment for large fiber, grid, and municipal programs.


Utility Locator Market Report Scope and Research Methodology
Market Definition and Coverage
For this study, the utility locator market covers tools and related services used to detect, trace, and verify the position of buried utilities before digging or maintenance, so asset damage and safety incidents are reduced. The market value reflects revenue from locator equipment and service work tied to locating activities.
Scope exclusions: It excludes broader civil surveying, full geospatial mapping programs, and general excavation work that is not specifically linked to locating and verification.
Segments Covered in This Report
- By Offering
- Equipment
- Services
- By Target
- Metallic Utilities
- Non-Metallic Utilities
- By Technique
- Electromagnetic Field (EM)
- Ground Penetrating Radar (GPR)
- Acoustic and Other
- By Application
- Oil and Gas
- Electricity
- Transportation and Rail
- Water and Sewage
- Telecommunications and Fiber
- Other Utilities
- By Geography
- North America
- United States
- Canada
- Mexico
- South America
- Brazil
- Argentina
- Rest of South America
- Europe
- Germany
- United Kingdom
- France
- Russia
- Spain
- Rest of Europe
- Asia Pacific
- China
- Japan
- India
- South Korea
- Rest of Asia Pacific
- Middle East
- Saudi Arabia
- United Arab Emirates
- Turkey
- Rest of Middle East
- Africa
- South Africa
- Egypt
- Rest of Africa
- North America
Data Sources, Market Sizing, and Validation
Desk Research
Desk work starts by setting the demand context around utility damage prevention and excavation activity, and then aligning it with what is typically sold as locator equipment and locating services. Public sources such as the US Department of Transportation pipeline safety statistics, one-call or dig-safety program publications, national telecom and broadband rollout updates, and government infrastructure spending releases help ground how these tools show up in real projects.
We also review customs and trade data where it is useful for signal checks on equipment movement, along with patents and technical papers that point to adoption of electromagnetic and ground penetrating radar approaches. Company filings, earnings decks, and reputable press coverage are used to understand pricing direction, product mix, and channel behavior, with selective support from paid subscriptions for company financials and patent databases. These examples are not exhaustive, and many other public and paid sources were referenced to collect data, validate assumptions, and clarify open points.
Primary Interviews and Surveys
Primary work is used to stress-test model assumptions that desk sources cannot fully answer, especially around average selling prices, service pricing, replacement cycles, and the share of projects using higher accuracy techniques. We speak with a mix of equipment suppliers, service contractors, utility owners, and engineering or construction stakeholders across major regions, then we re-check any outlier inputs through follow-up questions before finalizing the numbers.
Distribution of primary research fieldwork respondents
| Company type | Respondent position | Region |
|---|---|---|
| Top tier: 39% | CXOs: 19% | APAC: 45% |
| Mid tier: 41% | Functional/Unit leaders: 21% | EMEA: 29% |
| Smaller Players: 20% | Managers: 60% | Americas: 26% |
Market-Sizing & Forecasting
Sizing starts with a top-down build where infrastructure and utility maintenance activity is translated into a practical demand pool for locating work, then adjusted by adoption of locating practices and the mix of techniques used. To keep the result realistic, we corroborate totals using selective bottom-up approximations, such as sampled pricing by equipment type, channel checks on unit movement, and service revenue ranges shared by market participants.
Key inputs used in the model include indicators like excavation and construction intensity, utility safety and compliance activity, replacement and calibration cycles for locator devices, the split between metallic and non-metallic targeting, and the share of projects using electromagnetic versus ground penetrating radar. Pricing is handled through a simple ASP logic that separates new sales from replacements and considers discounting patterns seen in procurement cycles, before currency conversion is applied consistently for the sizing year.
For forecasting, scenario analysis is used so the outlook can reflect different paths for infrastructure funding, safety enforcement, and the pace of network and grid upgrades. Where bottom-up signals are incomplete in smaller regions, gaps are handled by using validated ratio-based assumptions tied back to project activity, then reviewed in primary calls.
Data Validation & Update Cycle
Validation is done through multiple checks so the final market value is not driven by one data stream. We compare the outputs against independent signals like regional construction momentum, trade and shipment direction for key equipment categories, and changes in service intensity described by contractors and utility owners.
Variance checks are run when a region or technique shows a jump that is not explained by the model inputs, and those items are sent back for analyst review and, when needed, re-contact with respondents. Reports are refreshed annually, with interim updates when there is a material event that can shift pricing, project timing, or adoption, and a final pre-delivery pass is completed so clients receive the most current view.
Mordor Intelligence's Utility Locator Market Sizing Compared With Other Published Estimates
Published market sizes for utility locators can look different even when they sound like the same topic, because the counting boundaries are not always aligned. The biggest drivers usually come from what is included as services versus equipment, which year is treated as the sizing anchor, and how prices are converted into a single currency.
In this study, the refresh cadence and currency timing are kept consistent with the sizing year, and ASPs are re-checked against fresh channel and contractor inputs before sign-off. This helps explain why Mordor Intelligence lands at a different 2026 value than estimates anchored in 2023 or 2025 pricing.
Benchmark comparison
| Source | Market Size | Gaps in Research Methodology |
|---|---|---|
| Mordor Intelligence | USD 1.03 B (2026) | |
| Global Consultancy A | USD 0.84 B (2023) | Uses an earlier anchor year, which can understate later ASP uplift and service attach rates, and the scope emphasis appears more equipment-led when compared across technique and offering splits. |
| Industry Research Group B | USD 0.96 B (2025) | Anchors the model closer to 2025 and extends the forecast window, which can shift the implied replacement cycle and regional mix, and it may apply different currency conversion timing that moves the headline value. |
The spread across sources is mainly tied to anchor-year choice, price handling, and how service revenue is counted alongside equipment. By keeping scope rules explicit and by linking pricing and adoption assumptions back to project activity signals, we end up with a market number that is easier to trace and repeat year to year.


Key Questions Answered in the Report
What is the current size of the utility locator market?
The utility locator market stands at USD 1,028.39 million in 2026 and is projected to climb to USD 1.38 billion by 2031.
Which region grows fastest for utility locator services?
Asia Pacific leads with a 7.46% CAGR through 2031, driven by large-scale infrastructure programs in China and India.
Why are services outpacing equipment sales?
Owners prefer turnkey, outcome-based contracts that transfer risk and leverage AI analytics, helping services grow at 7.12% CAGR.
How do fiber rollouts affect demand for utility locators?
Fiber deployment requires millimeter-precision locates to avoid costly strikes, pushing telecom-related locator revenue to a 7.46% CAGR.
What technologies are gaining share in non-metallic utility detection?
Ground penetrating radar with AI-based interpretation and acoustic tracing tools are emerging as key methods for plastic pipes and fiber conduits.
Are labor shortages limiting market growth?
Yes, the need for trained GPR and EM technicians remains acute, curbing capacity even as demand accelerates, though AI-assisted tools are easing the gap.
Page last updated on:


 Your data is secure and never sold or shared.


