Niobium Market Size and Share
Market Overview
| Study Period | 2020 - 2031 |
|---|---|
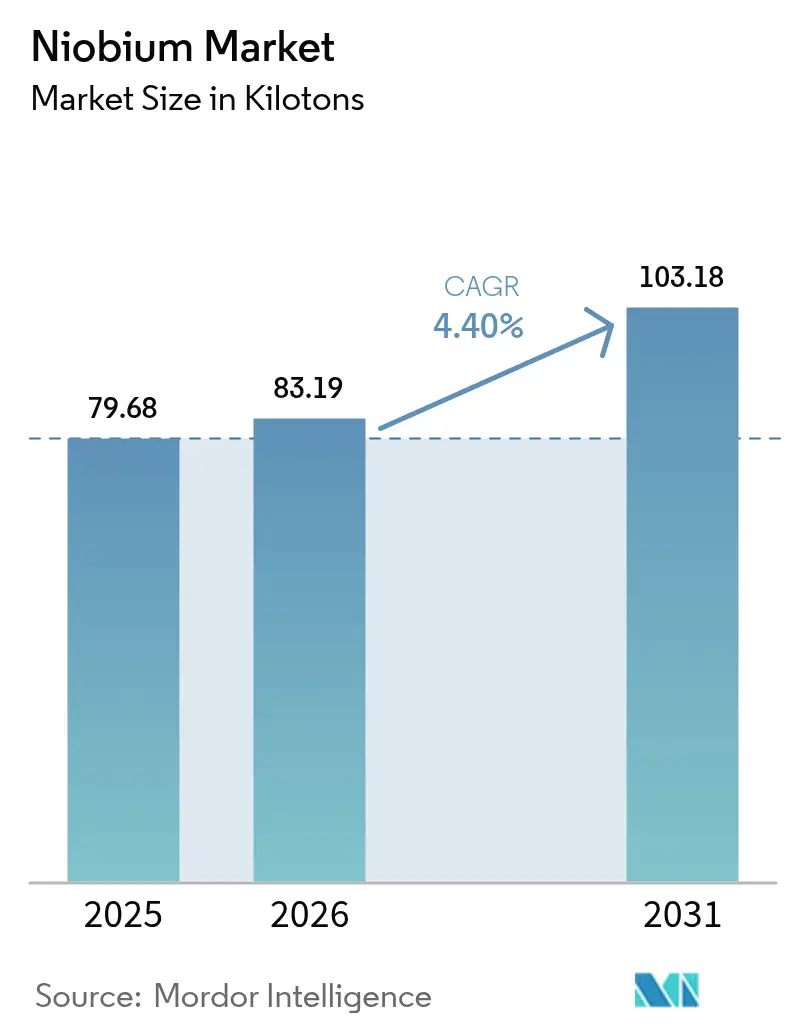
| Market Volume (2026) | 83.19 kilotons |
| Market Volume (2031) | 103.18 kilotons |
| Growth Rate (2026 - 2031) | 4.40% CAGR |
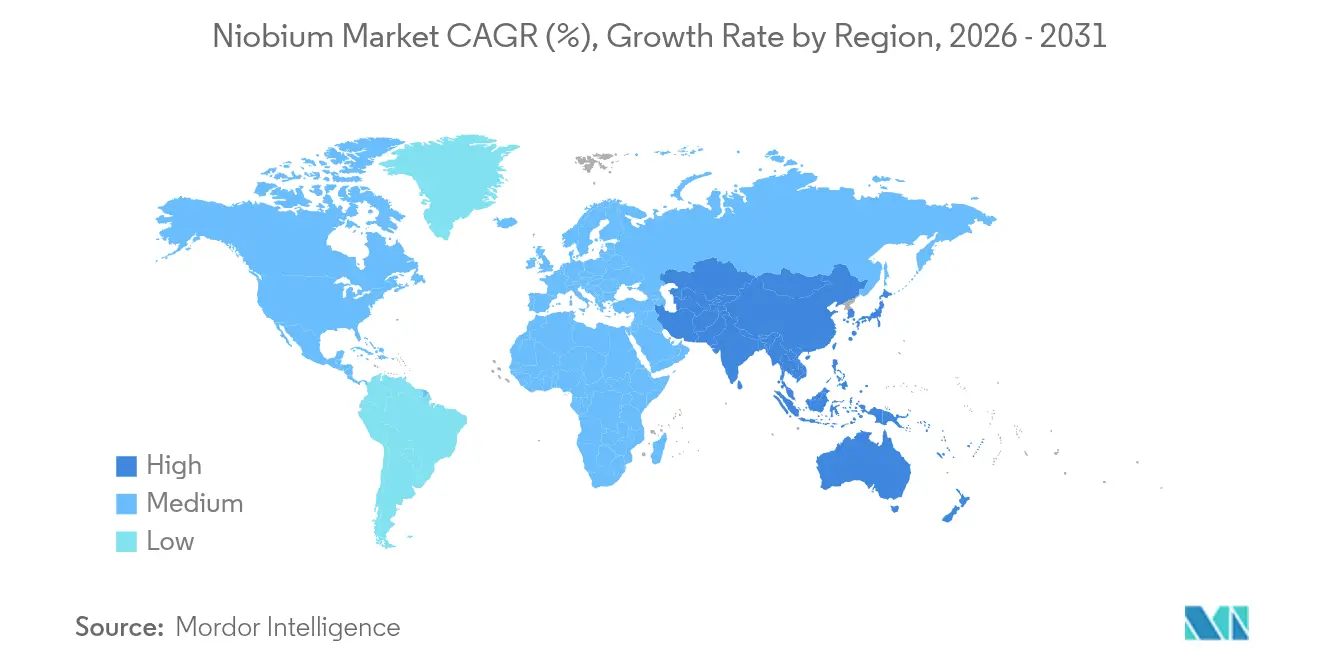
| Fastest Growing Market | Asia Pacific |
| Largest Market | Asia Pacific |
| Market Concentration | High |
Major Players *Disclaimer: Major Players sorted in no particular order Image © Mordor Intelligence. Reuse requires attribution under CC BY 4.0. | |
Niobium Market Analysis by Mordor Intelligence
The Niobium market size is expected to grow from 79.68 kilotons in 2025 to 83.19 kilotons in 2026 and is forecast to reach 103.18 kilotons by 2031 at 4.4% CAGR over 2026-2031. Sustained demand for high-strength low-alloy (HSLA) steel in construction and automotive manufacturing anchors this expansion because micro-additions of the element raise tensile strength by up to 30% while preserving weldability. Price stability between USD 45–50 per kilogram, maintained by a concentrated supply base led by Brazil, encourages long-term offtake agreements that lower procurement risk for large infrastructure projects. Rising interest in niobium-doped battery anodes, quantum-grade superconductors, and hydrogen-ready pipeline steels is broadening end-market diversity, cushioning the niobium market against potential slowdowns in the steel cycle. Supply-side diversification efforts in Canada and the United States aim to mitigate geopolitical risk tied to Brazil’s dominance and to reinforce domestic critical-minerals strategies.
Key Report Takeaways
- By occurrence, carbonatites captured a 95.85% share in 2025 and remain the fastest-growing deposit class with a 4.43% CAGR through 2031 in the niobium market.
- By type, ferroniobium commanded a 92.75% share in 2025; niobium oxide is poised for the strongest CAGR at 4.46% through 2031, within the niobium market.
- By application, steel accounted for 92.05% of the niobium market share in 2025 and is expanding at a 4.45% CAGR to 2031.
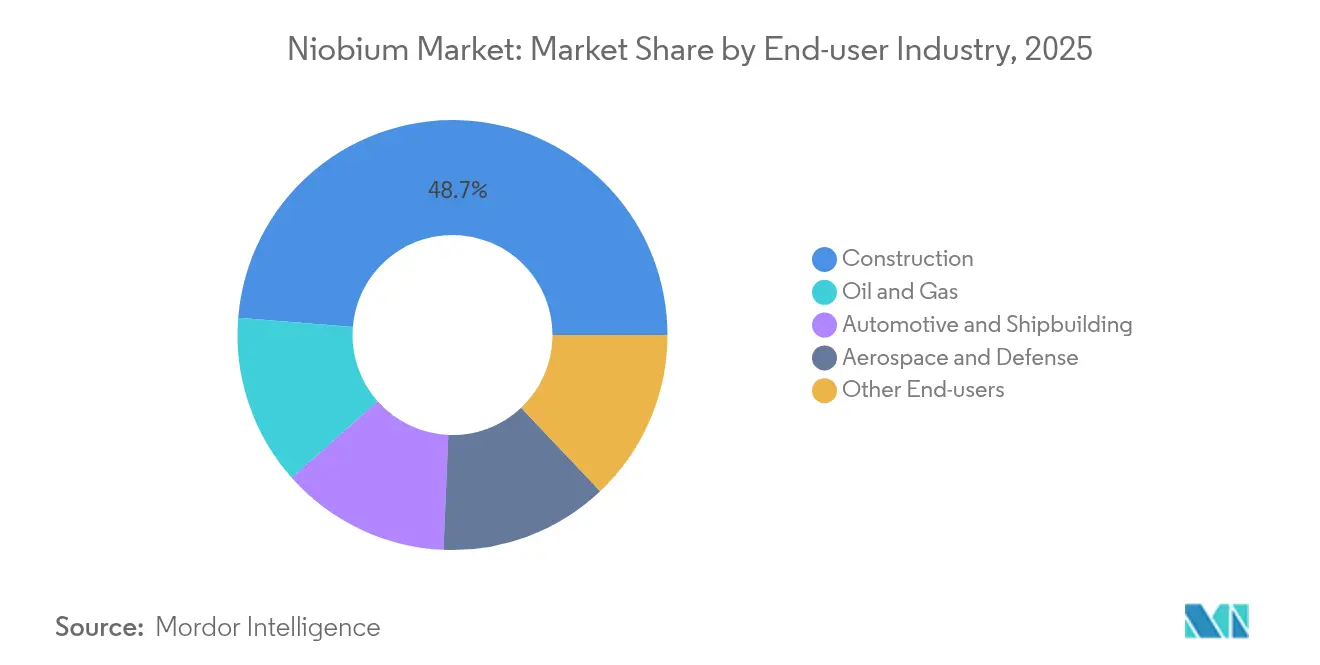
- By end-user industry, construction led with 48.72% revenue share in 2025, and shows the highest projected CAGR at 4.61% to 2031.
- By geography, Asia-Pacific dominated the niobium market with a 60.10% share in 2025 and is advancing at a 4.71% CAGR, outpacing all other regions.
Note: Market size and forecast figures in this report are generated using Mordor Intelligence’s proprietary estimation framework, updated with the latest available data and insights as of 2026.
Global Niobium Market Trends and Insights
Drivers Impact Analysis*
| Drivers | (~) % Impact on CAGR Forecast | Geographic Relevance | Impact Timeline |
|---|---|---|---|
| Rising HSLA steel adoption in construction | +1.2% | Asia-Pacific, North America | Medium term (2-4 years) |
| Lightweighting push in automotive and shipbuilding | +0.9% | North America, Europe, Asia-Pacific | Medium term (2-4 years) |
| Pipeline build-out for hydrogen and LNG transmission | +0.8% | Global | Long term (≥ 4 years) |
| Niobium-doped Li-ion batteries scale-up | +0.7% | Asia-Pacific; expanding globally | Long term (≥ 4 years) |
| Additive-manufactured Nb alloys for aerospace | +0.4% | North America, Europe | Long term (≥ 4 years) |
| Source: Mordor Intelligence | |||


Rising HSLA Steel Adoption in Construction
Building-code revisions now mandate higher strength-to-weight ratios for seismic resilience, and HSLA steels containing 0.02–0.05% niobium deliver 20–30% strength gains over conventional grades while cutting tonnage requirements. China’s 2024 seismic standards explicitly cite niobium-microalloyed steels for high-rise projects, and similar updates are under review in Indonesia and Mexico. Because material cost premiums remain 5–8% yet structural steel volumes fall by up to 20%, engineering firms are embedding niobium specifications across long-term infrastructure plans. As new urbanization waves in Asia and Africa accelerate, construction demand anchors more than 49% of overall niobium consumption, reinforcing a stable baseline for the niobium market. Regulatory momentum makes HSLA adoption essentially irreversible within a decade horizon.
Lightweighting Push in Automotive and Shipbuilding
Stricter fuel-economy targets and maritime emission limits foster aggressive mass-reduction strategies. Advanced high-strength steels incorporating niobium now appear in over 60% of premium-segment vehicles and are migrating into mass-market platforms as OEMs balance crashworthiness with battery-induced weight penalties. In shipbuilding, cryogenic-grade HSLA plate with niobium additions satisfies LNG-carrier requirements for fracture toughness at −162 °C, supporting fleet renewal across South Korea and Qatar. Commercial trucking and railcar builders likewise gravitate toward niobium-enhanced beam and chassis components, improving payload efficiency without major design overhauls. The cross-modal adoption cycle positions the niobium market for multi-industry synergies rather than single-sector dependency.
Pipeline Build-out for Hydrogen and LNG Transmission
Emerging hydrogen value chains need line-pipe grades that withstand hydrogen embrittlement at pressures beyond 100 bar. API X70 steels microalloyed with niobium exhibit superior crack-arrest properties, enabling pipeline operators in Germany and Texas to specify Nb-bearing chemistries for pilot networks. Parallel LNG infrastructure requires plate steels that stay ductile at cryogenic temperatures, another niche where niobium assists grain refinement. As hydrogen project capex surpasses USD 200 billion by 2030, offtake contracts increasingly bundle material standards that lock in incremental niobium demand across decades-long pipeline concessions, reinforcing the niobium market.
Niobium-doped Li-ion Batteries Scale-up
Anode formulations based on niobium-titanium oxide (NTO) achieve 80% charge in 10 minutes and exceed 10,000 cycles, addressing fleet-operator uptime concerns. CBMM’s USD 80 million expansion will raise niobium oxide capacity to 40,000 t by 2030, enough to support roughly 180,000 heavy-duty battery packs per year. Early deployments in mining haulage, port drayage trucks, and commuter railcars demonstrate field performance under harsh duty cycles. Because safety profiles surpass conventional graphite-based cells, insurance providers apply lower risk premiums, accelerating fleet conversion economics. Grid-storage developers now pilot NTO chemistries for frequency-response systems that cycle multiple times daily, broadening the niobium market beyond mobility alone.
Restraints Impact Analysis*
| Restraints | (~) % Impact on CAGR Forecast | Geographic Relevance | Impact Timeline |
|---|---|---|---|
| Supply concentration in Brazil and pricing power | −0.8% | Global | Short term (≤ 2 years) |
| Acute-exposure health and environmental concerns | −0.5% | Brazil, Canada, emerging producers | Medium term (2-4 years) |
| ESG traceability compliance costs | −0.3% | Global supply chains | Medium term (2-4 years) |
| Source: Mordor Intelligence | |||
Acute-exposure Health and Environmental Concerns
Niobium ores often coexist with thorium and uranium, necessitating strict radiological surveillance during mining. Regulatory authorities in Brazil now require groundwater baselines and isotopic mapping before license renewals, adding 15–25% to compliance costs[1]Health Council Secretariat, “Health-Based Reassessment of Administrative Occupational Exposure Limits for Tantalum,” Health Council of the Netherlands, gezondheidsraad.nl. Indigenous-territory debates further delay greenfield approvals, and similar community-engagement hurdles appear in Canada’s Ring of Fire region. While no chronic-toxicity cases have been documented at industrial exposure levels, public perception risks can influence capex decisions, tempering supply-side agility.
ESG Traceability Compliance Costs
The EU Battery Regulation and U.S. critical minerals bills compel full chain-of-custody documentation from mine to recycling plant. Blockchain-based solutions cost 3–5% of shipment value, squeezing margins for junior producers and small alloy processors. OEMs in automotive and electronics increasingly pass mandatory audit requirements down the tier structure, consolidating demand around suppliers capable of meeting verification standards. Although the initiatives enhance reputational resilience, they temporarily inflate operating expenses and lengthen procurement cycles.
*Our forecasts treat driver/restraint impacts as directional, not additive. The impact forecasts reflect baseline growth, mix effects, and variable interactions.
Segment Analysis
By Occurrence: Carbonatites Secure Global Dominance
Carbonatite-hosted deposits held 95.85% of the 2025 global supply and are set to expand at a 4.43% CAGR through 2031, underpinning the niobium market size growth trajectory. Brazil’s Araxá mine exemplifies low-strip ratios and coarse-grained pyrochlore that simplify beneficiation, yielding ferroniobium at competitive opex levels.
Exploration spending now targets undercover carbonatites in Greenland and Tanzania; however, no discovery approaches Araxá’s scale, reinforcing existing supply concentration. Predictable mineralogy and decades of metallurgical know-how translate into steady throughput, anchoring long-term delivery contracts and reinforcing the niobium market’s pricing stability. Strategic stockpilers in Japan and Germany continue to favor carbonatite feed due to consistent impurity profiles that streamline alloy-shop quality control.


By Type: Ferroniobium Retains Steel Primacy
Ferroniobium accounted for 92.75% of 2025 shipments and is forecast to post a 4.35% CAGR through 2031, mirroring global crude-steel demand patterns. The master alloy, usually containing 65% niobium, integrates seamlessly into basic-oxygen furnace practices, enabling melt-shop engineers to fine-tune grain size and precipitation kinetics. Niobium oxide, while representing a minor share today, is pacing up on the back of battery and dielectric-ceramic uptake; CBMM’s dedicated oxide line targets 40,000 tons annual capacity by 2030.
Vacuum-grade metal and specialty alloy powders feed aerospace engines, MRI magnets, and quantum devices, commanding premium unit values in spite of small tonnages. As additive manufacturing spreads, demand for spherical C-103 powder is likely to outpace bulk plate and bar, diversifying revenue streams for converters. Consequently, ferroniobium will remain the volume anchor, but high-purity derivatives will shape margin dynamics across the niobium industry.
By Application: Steel Consumption Dominates but Diversification Accelerates
Steel applications represented 92.05% of 2025 demand and will advance at a 4.45% CAGR, ensuring basal pull for the niobium market. Inclusion rates below 0.05% deliver disproportionate strength enhancements, maintaining niobium’s microalloy status and reinforcing lean material designs in bridges, high-rises, and energy pipelines.
Superconducting magnets in MRI scanners and particle accelerators rely on niobium-tin and niobium-titanium wire; upgrades to 1.8 K operating envelopes extend usage per system, counterbalancing maturation in hospital installations. Battery applications could vault from negligible to double-digit share by decade’s end if NTO cells achieve commercial parity with LFP chemistries, adding a high-value node to the niobium market size. Chemical-process equipment and medical implants round out niche segments, capitalizing on corrosion resistance and biocompatibility.
By End-user Industry: Construction Leads, Mobility Gains Momentum
Construction consumed 48.72% of niobium in 2025 and exhibits a 4.61% CAGR as megacity programs and seismic-resilient retrofits proliferate across Asia and Latin America. Lightweight vehicle mandates push automotive and shipbuilding to the forefront of incremental tonnage growth; mass adoption of advanced high-strength steel in EV platforms offsets density penalties from large battery packs, pushing per-vehicle niobium uptake from 75 g to 115 g on average. Aerospace and defense remain small in volume but vital in revenue, given price points for C-103 and novel refractory alloys demanded by hypersonic projects.
Oil and gas midstream investment in hydrogen and LNG corridors underwrites specialized pipe grades that further embed niobium microalloying in future energy infrastructure. Smaller niches such as electronics and medical devices benefit from niobium’s unique electronic structure and biocompatibility, underscoring an expanding end-user palette.
Geography Analysis
Asia-Pacific held 60.10% of 2025 global volume and is forecast to grow at a 4.71% CAGR to 2031, securing the largest regional slice of the niobium market. China’s gargantuan steel output and evolving seismic codes sustain bulk demand, while aerospace programs exploring niobium-silicon alloys extend uptake into next-generation propulsion systems.
North America’s growth hinges on dual themes: decarbonization of transport fleets and defense-driven hypersonic development. Tightened EPA fuel-economy rules and state-level zero-emission mandates push OEMs toward niobium-enriched steels for chassis mass reduction, counterbalancing heavier battery systems. Canada’s Niobec mine supplies roughly 8–10% of global output, but U.S. policymakers continue to view diversification via Elk Creek as a strategic imperative to curb reliance on Brazilian imports.
Europe targets net-zero targets by expanding hydrogen pipelines that demand niobium-microalloyed API X70 grades, and stringent vehicle CO₂ limits sustain high-strength steel penetration in automotive stamping. Germany’s auto clusters integrate ferroniobium additions to deliver lighter body-in-white assemblies, while Norway’s mineral strategy lists niobium as a priority for domestic exploration under revised permitting rules. The region also supports fundamental research into niobium-tin superconductors for CERN’s accelerator upgrades, sustaining a research-driven niche inside the broader niobium market.

Regulatory Landscape
Niobium is increasingly governed under critical-raw-material and responsible-sourcing frameworks that affect licensing, trade, and disclosure. The EU Critical Raw Materials Act (adopted March 2024) created a European Critical Raw Materials Board and formalized strategic partnership mechanisms with supplier countries, reinforcing due-diligence expectations for downstream users of ferroniobium, niobium oxide, and related derivatives.
On the supply side, Brazil is tightening compliance expectations alongside broader critical-minerals policy moves. In May 2026, Brazil's Chamber of Deputies approved Bill PL No 2780/2024 to establish a National Policy on Critical and Strategic Minerals, including provisions tied to R&D and mineral certification mechanisms (subject to further legislative steps). Separately, Brazil's move toward mandatory sustainability-related financial disclosures aligned with ISSB standards (IFRS S1 and S2) from 2026 for regulated issuers and financial institutions increases ESG reporting and traceability requirements across niobium supply chains. In the U.S., January 2026 executive actions on processed critical minerals added another layer of trade-policy uncertainty for import-dependent processors.
Competitive Landscape
The niobium market exhibits a tightly controlled supply chain. CMOC Group follows with its Catalão mine, while Magris Performance Materials operates Canada’s Niobec site, collectively shaping an oligopolistic landscape where coordinated capacity investments mitigate oversupply risk. Competitive intensity remains moderate: end-users rely on multi-year supply contracts to hedge against concentration risk, yet suppliers enjoy healthy margins due to the absence of meaningful substitutes. White-space opportunities exist in recycling, where niobium recovery from HSLA scrap is technically feasible but not yet scaled, and in specialty alloys for quantum computing, where purity thresholds exceed traditional vacuum-grade specifications. Overall, market participants emphasize collaborative research and development with downstream customers to entrench niobium’s role across emerging clean-energy and digital applications.
Niobium Industry Leaders
CMOC
CBMM
Changsha South Tantalum Niobium Co. Ltd
Magris Performance Materials
NioCorp Development Ltd
- *Disclaimer: Major Players sorted in no particular order

Market Opportunities and Future Outlook
Supply diversification and new conversion capacity are creating concrete whitespace outside the current concentrated producer base. In March 2026, Panda Hill Tanzania Limited signed a large-scale mining agreement with the Tanzanian government to develop the Panda Hill niobium project in the Mbeya region, with plans that include Africa's first ferroniobium smelter and a stated target of 100,000 tonnes of annual output. This provides a pathway for non-Brazilian material to enter global alloy and steel supply chains.
Downstream, battery materials are moving from demonstration to dedicated production assets and product portfolios. CBMM inaugurated an XNO active anode material facility in Araxa, Brazil with initial capacity of 2,000 tonnes per year, and in May 2026 showcased its NBXCELER niobium oxide technology portfolio for battery materials at CIBF 2026. In June 2026, CBMM also communicated a multi-year investment plan through 2030 (R$ 11 billion), with a large portion allocated to expanding production capacity for niobium-based products, reinforcing opportunities for higher-purity oxides and engineered battery inputs alongside the established ferroniobium volume base in steels.
Recent Industry Developments
- April 2026: NioCorp Development Ltd. announced a non-binding term sheet with Traxys North America LLC for the potential marketing and purchase of the remaining planned production from its Elk Creek Project, including ferroniobium and scandium products. The arrangement signals a route to customer access and commercial structuring ahead of full project financing, addressing a key hurdle for new North American supply.
- January 2026: NioCorp reported final assay results from its 2025 drilling campaign at the Elk Creek Critical Minerals Project to support technical updates for feasibility and financing workstreams. The data package strengthens the project development narrative by linking geology and metallurgy updates to debt-financing readiness for a primary U.S. niobium source.
- November 2024: Echion Technologies and CBMM inaugurated a niobium-based anode material production facility in Araxa, Brazil with an annual capacity of 2,000 tons of XNO material. The start-up adds dedicated conversion capacity for niobium battery anodes, broadening demand pull beyond steel and anchoring a scalable route for niobium into fast-charging energy storage supply chains.


Research Methodology Framework and Report Scope
Market Definition and Coverage
For this study, the niobium market covers the supply and consumption of niobium-bearing products that are traded and used in industrial applications, with volumes tracked in tons across key end uses and geographies.
Scope exclusions: We exclude downstream steel, electronics, and battery system values and count only niobium-containing materials, not the finished products made from them.
Segmentation Overview
- By Occurrence
- Carbonatites and Associates
- Columbite-Tantalite
- By Type
- Ferroniobium
- Niobium Oxide
- Niobium Metal
- Vacuum-grade Nb Alloys
- By Application
- Steel
- Super-alloys
- Superconducting Magnets and Capacitors
- Batteries
- Other Applications
- By End-user Industry
- Construction
- Automotive and Shipbuilding
- Aerospace and Defense
- Oil and Gas
- Other End-users
- By Geography
- Asia-Pacific
- China
- India
- Japan
- South Korea
- Rest of Asia-Pacific
- North America
- United States
- Canada
- Mexico
- Europe
- Germany
- United Kingdom
- Russia
- Italy
- Rest of Europe
- South America
- Brazil
- Argentina
- Rest of South America
- Middle-East and Africa
- Saudi Arabia
- South Africa
- Rest of Middle-East and Africa
- Asia-Pacific
Data Sources, Market Sizing, and Validation
Desk Research
Desk work starts by pinning down the physical flow of niobium, so the model stays tied to real mining, processing, and trade movement. Public sources such as the USGS mineral statistics, UN Comtrade trade codes, World Bank and IMF macro series, and customs or mining ministry releases help map production, import reliance, and apparent consumption patterns. We also review technical and policy literature from peer-reviewed journals and materials science publications to understand form factors like ferroniobium and oxides, plus how they move into steel and specialty uses.
To build practical assumptions, we add company annual reports, investor presentations, and reputable industry press for capacity updates, expansions, and supply disruptions. For harder-to-collect signals, we selectively use paid subscriptions focused on company financials and intelligence, patent databases, and shipment-level import-export tracking, which helps cross-check trade flows and spot unusual unit values. The sources noted here are illustrative only, and many other public references were also used to collect, validate, and clarify the data.
Primary Interviews and Surveys
Primary work confirms how material moves through the chain, and it helps test assumptions behind conversion factors, typical product mixes, and purchasing behavior. We speak with a mix of producers, processors, distributors, and large industrial buyers. We then re-check regional dynamics across APAC, EMEA, and the Americas so supply concentration and trade dependence are represented consistently. Where desk research is thin, interview input helps set realistic ranges for application shares, timing of new capacity, and how contract versus spot buying shows up in reported volumes.
Distribution of primary research fieldwork respondents
| Company type | Respondent position | Region |
|---|---|---|
| Top tier: 27% | CXOs: 12% | APAC: 43% |
| Mid tier: 57% | Functional/Unit leaders: 31% | EMEA: 37% |
| Smaller Players: 16% | Managers: 57% | Americas: 20% |
Market-Sizing & Forecasting
Sizing is built around a top-down reconstruction of the demand pool, where steel and specialty-use output, trade inflows and outflows, and apparent consumption signals are translated into niobium-bearing material volumes by form. Once that base is set, the totals are corroborated with selective bottom-up checks, including sampled producer capacity and utilization ranges, channel checks on typical shipment lots, and spot checks of average unit values in trade data. Assumptions are adjusted only when the evidence is consistent across these checks.
Inputs that matter in this market include ferroniobium versus oxide versus metal mix, conversion yields from concentrates to usable products, HSLA steel production trends, aerospace and superalloy output indicators, and regional import dependency patterns that can shift availability. For forecasting, we rely on scenario analysis tied to steel output growth and new capacity timing, and the scenario weights are refined through expert views on project ramp-up risks and likely adoption in higher-strength steels. When gaps exist by country or application, we scale from proxied indicators like related alloy demand and trade intensity, keeping the logic consistent so results remain reproducible.
Data Validation & Update Cycle
Outputs are triangulated by checking whether implied consumption aligns with trade balances, known supply concentration, and realistic conversion yields, then reworked when outliers do not fit the overall pattern. Variance checks are run across regions and forms so sudden jumps get flagged, followed by an internal review where assumptions and calculations are rechecked before sign-off. Reports are refreshed annually, and interim updates are made when a material event occurs, such as a major capacity change, export restriction, or sharp price move that can change buying behaviour. Before delivery, a final pass is completed so clients receive the most current view supported by the latest available inputs.
Mordor Intelligence's Niobium Market Size Measured Against Other Published Estimates
Published market sizes for niobium can look far apart because the scope is not consistent, especially on whether figures represent physical tons or a value estimate built from assumed prices. Differences also show up when one study treats intermediate products and finished goods as one combined pool, and when currency timing and contract pricing are handled differently.
Some external estimates are reported in USD and often bundle multiple product forms with a broad price assumption that can swing the total quickly. In Mordor Intelligence, the market is expressed in tons and stays limited to niobium materials such as ferroniobium, oxides, metal, and vacuum-grade alloys, with application splits validated through supply chain interviews and trade-flow checks.
Benchmark comparison
| Source | Market Size | Gaps in Research Methodology |
|---|---|---|
| Mordor Intelligence | USD 83.19 T (2026) | |
| Global Consultancy A | USD 1.91 B (2023) | Value-based sizing can inflate or compress totals depending on the price deck and product-mix assumptions, and the USD figure also makes cross-year comparisons sensitive to currency timing and contract price lags. |
| Industry Publisher B | USD 2.93 B (2024) | A broader definition of niobium products and a single blended ASP approach can pull in adjacent processed items, and the result depends heavily on how quickly price progression is applied in the forecast. |
The spread in the table mainly reflects unit choice and what gets counted as part of the market, not just different math. By keeping the model tied to physical tons and then validating key splits through interviews plus trade and production signals, the estimate stays traceable to clear steps that can be repeated when inputs change.


Key Questions Answered in the Report
What is the projected volume for the niobium market in 2031?
Forecasts point to 103.18 kilotons by 2031, reflecting a 4.40% CAGR from 2026.
Which region leads global consumption of niobium?
Asia-Pacific held 60.10% of 2025 demand due to China's large steel and infrastructure base.
Why is niobium critical for hydrogen pipelines?
Microalloyed steels containing niobium resist hydrogen-induced cracking, enabling safe high-pressure transmission.
How does ferroniobium differ from niobium oxide?
Ferroniobium is an iron-bearing master alloy for steel mills, while niobium oxide is a high-purity form used in fast-charging battery anodes.
Which end-user industry currently consumes the most niobium?
Construction accounts for 48.72% of demand, driven by seismic-resilient and high-rise projects that specify HSLA steels.
What supply risks affect the niobium market?
Brazil's 78% production share concentrates supply and exposes importers to geopolitical or logistical disruptions.
Page last updated on:


