US Private LTE And 5G Network Market Size and Share
Market Overview
| Study Period | 2020 - 2031 |
|---|---|
| Forecast Data Period | 2026 - 2031 |
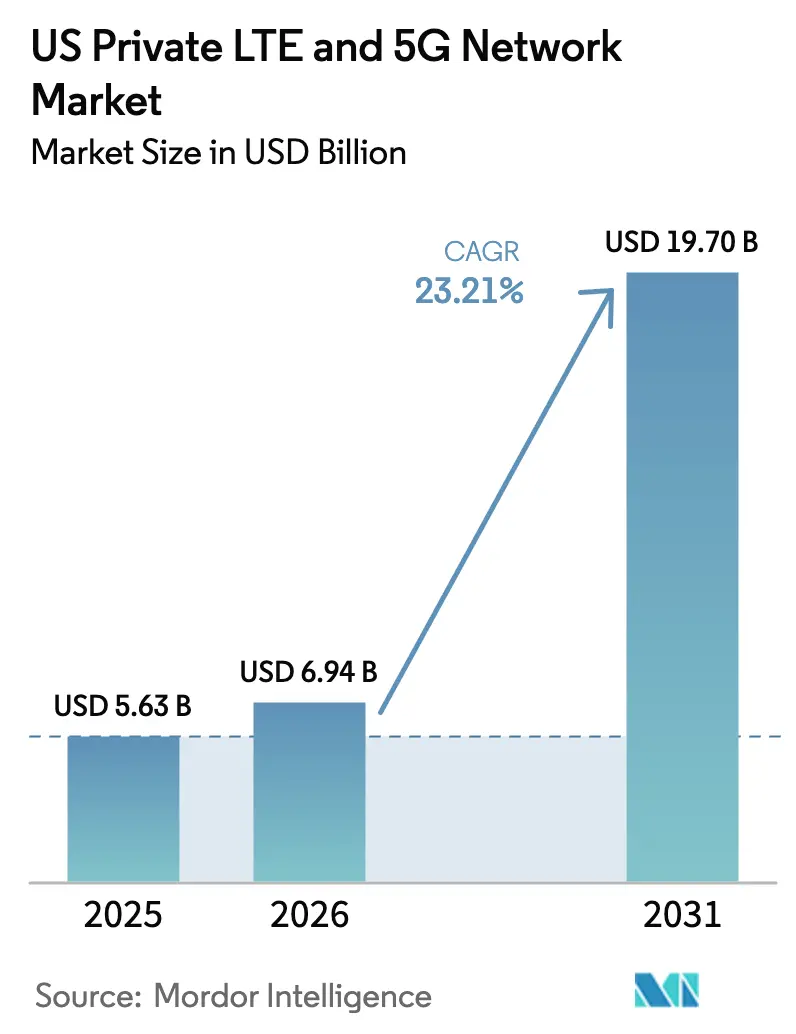
| Base Year Market Size (2025) | USD 5.63 Billion |
| Market Size (2026) | USD 6.94 Billion |
| Market Size (2031) | USD 19.7 Billion |
| Growth Rate (2026 - 2031) | 23.21% CAGR |
| Market Concentration | Medium |
Major Players *Disclaimer: Major Players sorted in no particular order Image © Mordor Intelligence. Reuse requires attribution under CC BY 4.0. | |
US Private LTE And 5G Network Market Analysis by Mordor Intelligence
The US private LTE and 5G network market size is expected to grow from USD 5.63 billion in 2025 to USD 6.94 billion in 2026 and is forecast to reach USD 19.7 billion by 2031 at 23.21% CAGR over 2026-2031. A combination of supportive spectrum regulation, industrial automation initiatives, and hyperscale cloud entry is sustaining brisk adoption. Enterprises view dedicated cellular as indispensable for deterministic latency, robust security, and predictable performance that public networks cannot guarantee. The Citizens Broadband Radio Service (CBRS) modernization in 2024 widened unencumbered access to an additional 72 million people, lowering deployment barriers for mid-market manufacturers.[1]Federal Communications Commission, “Notice of Proposed Rulemaking on 3.5 GHz Citizens Broadband Radio Service,” fcc.govMeanwhile, the Department of Defense’s emerging mid-band sharing pilots hint at fresh mid-band capacity, reinforcing spectrum confidence for defense and adjacent industries.[2]Department of Defense, “Emerging Mid-Band Spectrum Sharing Feasibility Assessment,” defense.gov
Key Report Takeaways
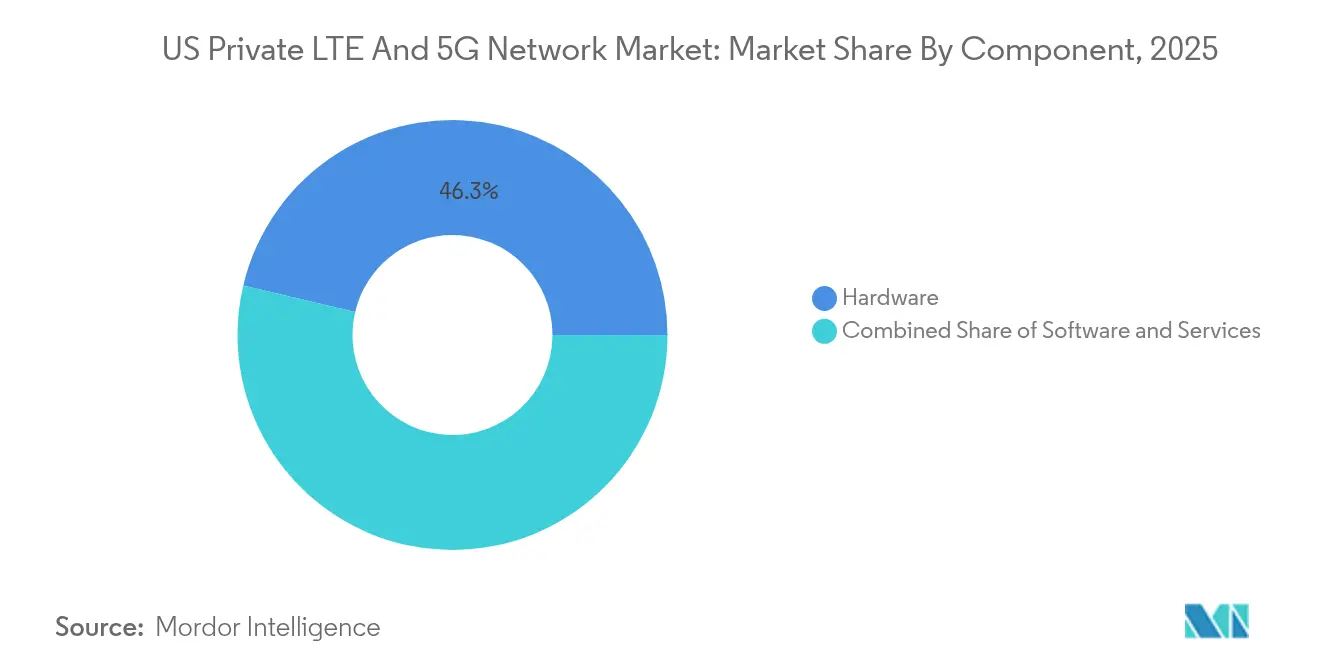
- By component, hardware led with 46.30% revenue share in 2025; services are projected to expand at a 25.65% CAGR through 2031.
- By frequency band, Sub-6 GHz captured 60.85% of the US private LTE and 5G network market share in 2025, while mmWave is forecast to grow at 29.8% CAGR to 2031.
- By spectrum licensing model, shared CBRS held 53.40% revenue share in 2025; licensed deployments are advancing at a 23.9% CAGR through 2031.
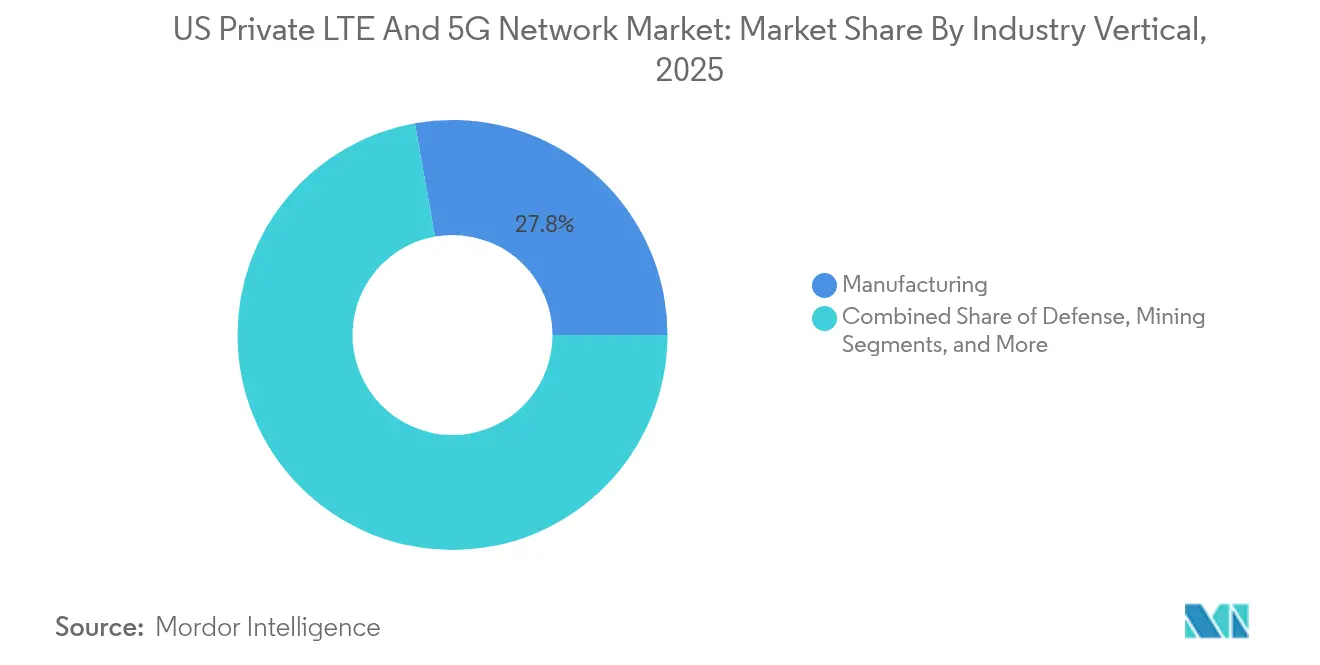
- By industry vertical, manufacturing led with 27.80% share of the US private LTE and 5G network market size in 2025; healthcare is poised for the fastest 28.4% CAGR through 2031.
- By deployment model, dedicated on-premises networks accounted for 48.40% of the US private LTE and 5G network market size in 2025, while Network-as-a-Service (NaaS) models are expanding at 32.1% CAGR.
Note: Market size and forecast figures in this report are generated using Mordor Intelligence’s proprietary estimation framework, updated with the latest available data and insights as of 2026.
US Private LTE And 5G Network Market Trends and Insights
Drivers Impact Analysis*
| Driver | (~) % Impact on CAGR Forecast | Geographic Relevance | Impact Timeline |
|---|---|---|---|
| CBRS spectrum liberalization and supportive FCC rule-makings | +4.2% | National, concentrated gains in manufacturing corridors | Medium term (2–4 years) |
| Industrial IoT and Industry 4.0 automation push | +6.8% | Global, early adoption in North America manufacturing | Long term (≥ 4 years) |
| Demand for mission-critical security, reliability and low latency | +5.1% | National, priority in defense and healthcare sectors | Short term (≤ 2 years) |
| Falling TCO of small-cell and NaaS deployment models | +3.9% | National, accelerated mid-market adoption | Medium term (2–4 years) |
| DoD 3.45 GHz sharing pilots accelerating defense uptake | +2.7% | National, military installations | Long term (≥ 4 years) |
| Hyperscaler edge-MEC marketplaces easing turnkey adoption | +4.1% | Global, cloud-native enterprises | Medium term (2–4 years) |
| Source: Mordor Intelligence | |||
CBRS Spectrum Liberalization and Supportive FCC Rule-Makings
Modernized CBRS rules published in 2024 curtailed Dynamic Protection Areas and aligned interference criteria with the 3.45 GHz band, reducing operational uncertainty for enterprises. Extended transmit-expire timers and clarified coexistence obligations raised network reliability, positioning CBRS as a commercially viable alternative to Wi-Fi for deterministic industrial workloads. The expansion of unencumbered service now allows private operators to serve 72 million more Americans, unlocking rural and suburban locations once constrained by federal incumbents. Infrastructure suppliers note heightened enterprise confidence as rule clarity translates into swifter procurement cycles. Together, these adjustments elevate CBRS economics and underpin the medium-term growth of the US private LTE and 5G network market.
Industrial IoT and Industry 4.0 Automation Push
Manufacturers pivot toward dedicated cellular to connect autonomous robots, real-time vision systems, and digital twins at plant scale. Toyota Material Handling’s Columbus facility shows a full Wi-Fi swap for Ericsson private 5G, enabling predictive maintenance and telematics across 200,000 sq ft.[3]Ericsson, “Zero Trust Security for Private 5G Networks,” ericsson.com John Deere, BMW, and Tesla are following similar paths to shrink wired links, restructure assembly layouts, and meet sub-10 ms latency needs. As production lines grow data-intensive, deterministic throughput emerges as a non-negotiable requirement, pulling cellular deeper into operational technology stacks. These experiences signal a long-term adoption curve that keeps the US private LTE and 5G network market on a double-digit trajectory.
Demand for Mission-Critical Security, Reliability and Low Latency
Zero-trust paradigms are migrating from IT to operational networks. OneLayer and Ericsson’s Zero Touch Zero Trust Network Access toolkit adds identity-aware micro-segmentation to private 5G. Hospitals now isolate patient monitors and imaging devices from public traffic, ensuring life-critical uptime during peak demand. Defense programs leverage network slicing to guarantee bandwidth for first responders without public congestion. The blend of SIM-based authentication, built-in encryption, and optional air-gap isolation addresses stringent compliance controls, pushing enterprises to favor private deployments despite premium costs. Short-term growth gains follow as latency-sensitive sectors leapfrog Wi-Fi upgrades with private cellular.
Small-cell densification, open-RAN radios, and cloud-native cores compress per-site capital outlays. Boldyn Networks’ Private 5G as a Service tiers convert six-figure hardware purchases into recurring fees aligned with performance levels. Research on neutral-host CBRS shows 1.44× downlink versus 4G macro while requiring fewer access points than Wi-Fi, shrinking both equipment count and energy draw. Managed service bundles offload RF planning and 24×7 operations to specialists, giving mid-size enterprises predictable budgets. These economics accelerate the US private LTE and 5G network market among firms previously priced out of dedicated cellular.
Restraints Impact Analysis*
| Restraint | (~) % Impact on CAGR Forecast | Geographic Relevance | Impact Timeline |
|---|---|---|---|
| High upfront CAPEX and complex integration | -3.8% | Global, pronounced mid-market impact | Short term (≤ 2 years) |
| Shortage of private-cellular design and ops talent | -2.9% | National, acute engineering gaps | Medium term (2–4 years) |
| CBRS interference-protection and incumbency uncertainty | -1.7% | National, with regional variations in federal operations | Short term (≤ 2 years) |
| Fragmented device certification for 5G-SA (n48/n258) | -2.1% | Global, with delayed ecosystem maturation | Medium term (2-4 years) |
| Source: Mordor Intelligence | |||
High Upfront CAPEX and Complex Integration
Turnkey private networks still cost USD 250,000–1 million, with operational expenses up to 50% higher than 4G footprints. Racks, edge servers, and redundant power raise floor-space and skills needs, while factory IT teams juggle MES, PLC, and cybersecurity integrations. Semiconductor price volatility, amplified by global foundry concentration, inflates radio bill-of-materials. Although NaaS smooths cashflow, CFOs remain cautious during early budgeting cycles, softening near-term uptake across the US private LTE and 5G network market.
Shortage of Private-Cellular Design and Ops Talent
Rapid roll-outs stretch a limited pool of RF planners, 5G core specialists, and OT-savvy security architects. Defense programs alone target about 800 base deployments, dwarfing available certified engineers. Integrators scramble to certify new hires on CBRS, 5G-SA, and O-RAN stacks. Until academia and industry scale training, project timelines risk delay and cost overruns, dampening the medium-term growth potential of the US private LTE and 5G network market.
*Our forecasts treat driver/restraint impacts as directional, not additive. The impact forecasts reflect baseline growth, mix effects, and variable interactions.
Segment Analysis
By Component: Services Surge Amid Hardware Dominance
Hardware retained a 46.30% revenue share in 2025, confirming radios, antennas, and on-premises cores as foundational spend categories of the US private LTE and 5G network market. The services segment, though smaller, is accelerating at a 25.65% CAGR as enterprises favor managed deployment, lifecycle optimization, and AI-driven troubleshooting. As a result, the US private LTE and 5G network market size for services is projected to rise from USD 1.67 billion in 2025 to USD 6.66 billion in 2031. Network-as-a-Service packages bundle spectrum coordination, security monitoring, and firmware maintenance, shifting cost structures from capex to opex and freeing IT staff for application innovation.
Software occupies the middle band of spending. Functions span slice orchestration, core network analytics, and application enablement frameworks that expose APIs to developers. AI-enabled closed-loop control reduces mean-time-to-repair by up to 40%, reinforcing service-centric growth dynamics. Providers such as Verizon and NVIDIA are embedding GPU-powered inference at cell-edge, giving manufacturers computer-vision quality control within microseconds. The services surge signals a long-term pivot toward experience-based contracts that integrate connectivity, computation, and security into a single consumable unit across the US private LTE and 5G network market.


By Frequency Band: Sub-6 GHz Leads, mmWave Scales New Peaks
Sub-6 GHz commanded 60.85% of 2025 revenue, thanks largely to CBRS spectrum that balances propagation and capacity for large-footprint factories. The segment’s established device ecosystem and lenient licensing streamline procurement. In contrast, mmWave, though nascent, is forecast to post 29.8% CAGR as stadiums, ports, and smart factories demand gigabit uplink and ultra-dense sensor grids. The US private LTE and 5G network market size for mmWave is expected to touch USD 3.82 billion by 2031, driven by 400 MHz-wide channels providing extreme capacity.
FCC rule harmonization with 3.45 GHz protections further cements Sub-6 GHz viability. Yet chip vendors are launching integrated RF front-ends that simplify dual-band radios, allowing enterprises to layer mmWave hotspots atop Sub-6 GHz coverage. Sports venues already stream multi-angle 8K video instantaneously, justifying the higher radio count. Autonomous mobile robots inside factories leverage mmWave for precision navigation while backhauling telemetry via Sub-6 GHz. Such hybrid designs will keep both bands relevant within the US private LTE and 5G network market.
By Spectrum Licensing Model: Shared CBRS Dominates but Licensed Gains Speed
Shared CBRS held 53.40% market share in 2025, cementing its place as the default on-ramp for mid-band private deployments. Spectrum Access Systems automates coordination, letting enterprises light up radios in days rather than months. Nevertheless, licensed spectrum usage is expanding at 23.9% CAGR as mission-critical operators prioritize guaranteed interference immunity. The US private LTE and 5G network market size for licensed projects is projected to grow from USD 1.28 billion in 2025 to USD 4.64 billion by 2031. Defense installations, utility substations, and tertiary hospitals frequently procure priority access licenses to ensure isolation during emergencies.
Unlicensed bands remain niche, serving pop-up sites and non-critical IoT. Yet regulatory uncertainty around potential CBRS reallocations nudges risk-averse organizations toward licensed leases. The Department of Defense’s feasibility review of 3.1–3.45 GHz sharing adds a strategic layer; should commercial auctions proceed, a fresh tranche of mid-band could rebalance economics toward licensed access, reshaping the US private LTE and 5G network market.
By Industry Vertical: Healthcare Outpaces Manufacturing Growth
Manufacturing secured 27.80% revenue share in 2025, reflecting its early embrace of Industry 4.0 robotics, AGVs, and real-time analytics. Factories report 15–20% uptime gains after migrating from Wi-Fi. Yet, healthcare now shows the strongest 28.4% CAGR to 2031. The US private LTE and 5G network market size attributed to hospitals and clinics is projected to expand from USD 0.72 billion in 2025 to USD 3.22 billion in 2031. Tele-ICU monitoring, AI-assisted diagnoses, and secure EHR synchronization demand deterministic throughput and zero-trust isolation, making private cellular a natural choice.
Energy, utilities, and mining contribute steady volumes, deploying ruggedized radios for hazardous and remote work zones. Mining firms pilot 5G-enabled autonomous haulage, cutting incident rates and boosting ore throughput. Transportation hubs use network slicing to separate passenger Wi-Fi from logistics telemetry. Such cross-sector traction broadens the revenue base and cushions vertical-specific downturns, supporting ongoing expansion of the US private LTE and 5G network market.
By Deployment Model: NaaS Redefines Adoption Curves
Dedicated on-premises builds retained 48.40% share in 2025, with large manufacturers and government agencies valuing full sovereignty over architecture and data paths nokia.com. However, Network-as-a-Service is scaling at a 32.1% CAGR. The US private LTE and 5G network market size for NaaS deployments is set to climb from USD 0.98 billion in 2025 to USD 5.21 billion by 2031. Service providers pre-stage cores in cloud regions, ship plug-and-play small-cells, and bundle spectrum leasing, slicing, and SLA enforcement into monthly fees.
Hybrid models add flexibility. Enterprises run latency-sensitive traffic on private slices while non-critical flows traverse public 5G. T-Mobile’s early hybrid pilots demonstrate 20–30% cost savings over pure private topologies. As zero-touch orchestration matures, even risk-averse sectors will weigh managed services to accelerate site launches. Collectively, these shifts make deployment choice a strategic, not merely financial, decision within the US private LTE and 5G network market.
Geography Analysis
Regional adoption profiles mirror industrial density and federal funding flows. Midwest and Southeast manufacturing corridors, spanning Indiana, South Carolina, and Alabama, host clustered deployments as automotive and heavy-equipment plants retrofit for Industry 4.0. Defense hubs in Virginia, California, and Texas dominate licensed mid-band demand, tied to Pentagon pilots covering roughly 800 installations. Coastal tech centers leverage hyperscaler edge zones to marry private 5G with AI services, accelerating smart-campus rollouts.
Federal spectrum pilots have eased CBRS restrictions across swaths of Iowa, Missouri, and Michigan, enabling rural factories to digitize workflows. NTIA data shows 67.5% of CBRS radios now installed in rural settings, validating private cellular as a bridge where public 5G remains patchy. Energy utilities in California and the Gulf Coast adopt private 5G for wildfire-safe grid telemetry and hurricane-hardy SCADA backhaul, respectively.
Urban smart-city initiatives add momentum. Jacksonville’s autonomous shuttle and Brownsville’s citywide IoT grid draw on turnkey 5G as a Service, improving public transportation and safety metrics. Stadiums from Buffalo to San Diego use ultra-dense small-cells to stream multi-angle 4K replays, enriching fan engagement while powering concession and security operations. These geography-specific successes reinforce a virtuous cycle of policy support, ecosystem investment, and proof-point replication across the US private LTE and 5G network market.
Competitive Landscape
The field retains moderate fragmentation yet exhibits gradual consolidation around incumbents with end-to-end portfolios. Nokia reported 890 private wireless wins worldwide, with North America representing 24% of its total in Q4 2024, according to Nokia. Ericsson logged record sales the same year and leads zero-trust security innovation, integrating identity-aware access controls into its dual-mode 5G core. Hyperscalers Amazon Web Services and Google Cloud now bundle private 5G with low-latency compute, collapsing boundaries between telecom and IT stacks.
Partnerships have become entry passes. Cisco teams with NEC for open-RAN deployments, while Verizon aligns with NVIDIA to embed GPU-accelerated analytics at the cell edge. White-space integrators focus on vertical-specific offerings: Boingo targets airports, Federated Wireless serves defense bases, and Boldyn Networks positions NaaS for mid-market clients. Patent momentum underscores rivalry; Qualcomm explores XR compute offload techniques, Samsung optimizes URLLC scheduler logic. Standardization via the O-RAN Alliance, which released 74 technical documents since mid-2024, widens interoperability and lowers vendor lock-in risk.
Overall, scale champions leverage integrated silicon, radio, and software roadmaps to squeeze costs and accelerate feature rollouts. Niche players differentiate through domain expertise, curated ecosystems, and tailored service tiers. This dynamic keeps buyer options open while driving steady maturation of the US private LTE and 5G network market.
US Private LTE And 5G Network Industry Leaders
Verizon Communications Inc.
Cisco Systems, Inc.
Nokia Corporation
AT&T
Ericsson
- *Disclaimer: Major Players sorted in no particular order

Recent Industry Developments
- June 2025: Verizon to deploy private 5G at 35 U.S. Air Force bases, extending to 84 by 2028.
- May 2025: T-Mobile and Palo Alto Networks launch SASE service combining 5G Advanced with Zero-Trust security.
- April 2025: Pentagon schedules largest-ever spectrum-sharing demonstration for Nov 2025.
- March 2025: OneLayer and Ericsson unveil Zero Touch Zero Trust Network Access for private 5G.


Research Methodology Framework and Report Scope
Market Definitions and Key Coverage
Our study treats the U.S. private LTE and 5G network market as all enterprise-owned or lease-model cellular networks, covering radio, core, edge, and management layers, built on 3GPP standards and operated over licensed, shared (CBRS/do-d spectrum), or unlicensed mid- and high-band frequencies.
Scope Exclusions: Public macro-operator 5G slices and Wi-Fi 6/7 campus LANs are excluded.
Segmentation Overview
- By Component
- Hardware
- Software
- Services
- By Frequency Band
- Sub-6 GHz
- mmWave (24/28 GHz)
- By Spectrum Licensing Model
- Licensed (3GPP bands, 600 MHz, C-band, etc.)
- Shared (CBRS 3.5 GHz, DoD 3.45 GHz)
- Unlicensed (5 GHz, 6 GHz)
- By Industry Vertical
- Manufacturing
- Energy and Utilities
- Healthcare
- Defense
- Mining
- Oil and Gas
- Transportation and Logistics
- Public Safety
- Retail
- Smart Cities
- Other Verticals
- By Deployment Model
- Dedicated On-premises
- Hybrid Public-Private
- Network-as-a-Service (NaaS)
Detailed Research Methodology and Data Validation
Primary Research
We interviewed spectrum policy attorneys, OT engineers in automotive and utilities, major system integrators, and specialized neutral-host providers across the Midwest, Gulf Coast, and Pacific regions. Their inputs verified adoption thresholds, typical device densities, and realistic average selling prices (ASP); they then filled gaps in shipment data and service uptake assumptions.
Desk Research
We began by sifting through publicly available, regulation-heavy sources such as FCC license databases, NTIA spectrum dashboards, CBRS Alliance adoption trackers, and 3GPP release notes to ground the technology landscape. Macro indicators, such as industrial production indexes, the U.S. Census Bureau's Annual Survey of Manufactures, and Bureau of Labor Statistics capex tables, helped size the potential demand pool.
Company 10-Ks, Form 477 filings, procurement portals, and news streams from Dow Jones Factiva supplemented cost curves, roll-out timelines, and use-case momentum. D&B Hoovers supplied revenue splits for key integrators, while select patent counts from Questel indicated innovation hotspots. The desk-research list is illustrative, not exhaustive.
Market-Sizing & Forecasting
A top-down demand-pool build-up anchored on the number of active industrial facilities, port terminals, hospitals, and public-safety districts was first completed. Those counts were matched with penetration rates drawn from the interviews. Select bottom-up checks, such as supplier roll-ups and channel ASP x unit samplings, tempered totals before finalization. Key variables in our model include CBRS PAL/GAA uptake, private mid-band license auction proceeds, annual ruggedized-IoT device shipments, industrial IoT capex ratios, and spectrum clearing timelines. Multivariate regression with scenario analysis captured interactions among CAPEX cycles, spectrum availability, and device price erosion, generating the baseline value and the outlook for the forecast period.
Data Validation & Update Cycle
Our analysts run variance and sanity checks against external spend estimates, shipment trackers, and public contract values, re-contacting sources when anomalies exceed preset bands. Every report is reviewed by a senior analyst, refreshed annually, and fast-tracked for interim updates after material policy or spectrum events.
Why Mordor's US Private LTE And 5G Network Baseline Commands Confidence
Published values often diverge because firms adopt different scope definitions, input variables, and refresh cadences.
External 2023 estimates span USD 0.54 billion to USD 3.90 billion, underscoring how omissions, such as LTE overlay revenue or services OPEX, skew results.
Benchmark comparison
| Market Size | Anonymized source | Primary gap driver |
|---|---|---|
| USD 5.63 B (2025) | Mordor Intelligence | - |
| USD 0.54 B (2023) | Regional Consultancy A | Counts only 5G hardware; excludes LTE and services |
| USD 3.90 B (2023) | Trade Journal B | Uses vendor revenue top-down and omits shared-spectrum deployments |
In summary, while other publishers offer snapshots tailored to narrower slices of the market, Mordor's inclusive scope, transparent variables, and multi-step validation deliver a dependable reference point that decision-makers can trace back to clear, reproducible inputs.


Key Questions Answered in the Report
How big is the US private LTE and 5G network market in 2026?
It stands at USD 6.94 billion, with a projected 23.21% CAGR through 2031.
Which industry vertical is growing fastest?
Healthcare leads with a 28.4% CAGR, supported by secure telemedicine, remote monitoring, and device connectivity demands.
Why are enterprises choosing private cellular over Wi-Fi?
Private LTE and 5G deliver deterministic latency, stronger security, and better mobility, enabling autonomous robotics and mission-critical applications.
What spectrum band dominates current deployments?
Sub-6 GHz, particularly CBRS, holds 60.85% revenue share due to favorable propagation and simplified licensing.
How are deployment models shifting?
Network-as-a-Service is the fastest-growing approach at 32.1% CAGR as firms trade capex for subscription-based managed services.
What restrains faster market growth?
High upfront capital needs and a shortage of specialized RF and security talent limit near-term deployment velocity despite strong demand.
Page last updated on:


