Private LTE Market Size and Share
Market Overview
| Study Period | 2020 - 2031 |
|---|---|
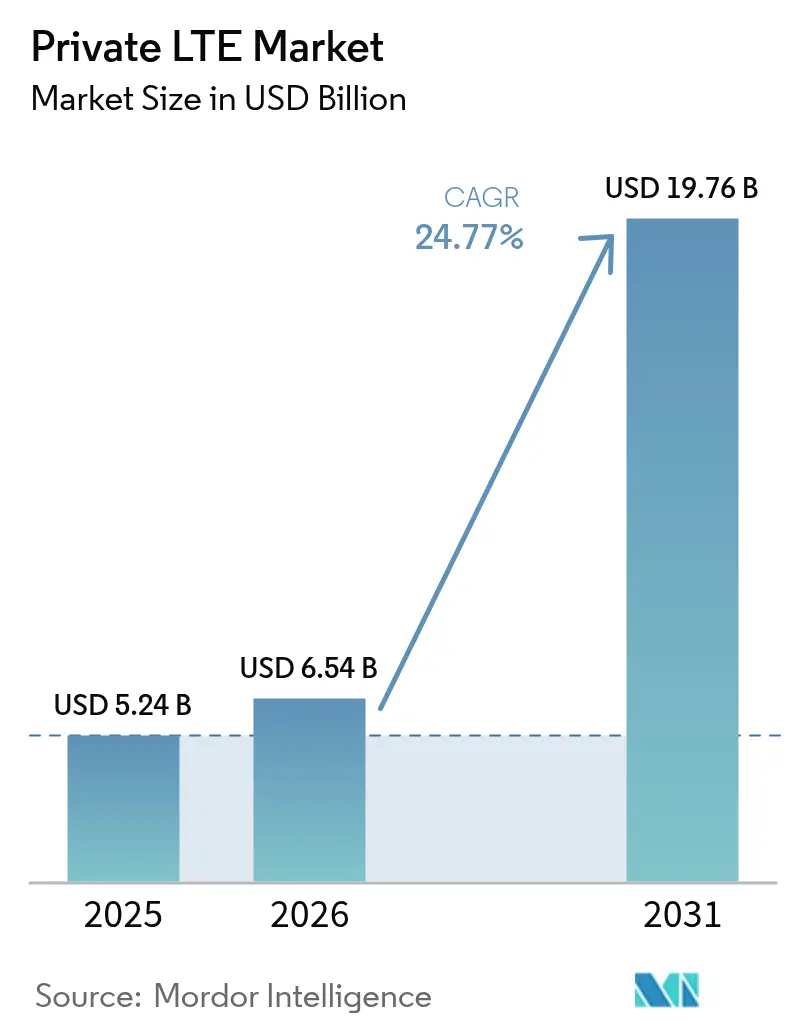
| Market Size (2026) | USD 6.54 Billion |
| Market Size (2031) | USD 19.76 Billion |
| Growth Rate (2026 - 2031) | 24.77% CAGR |
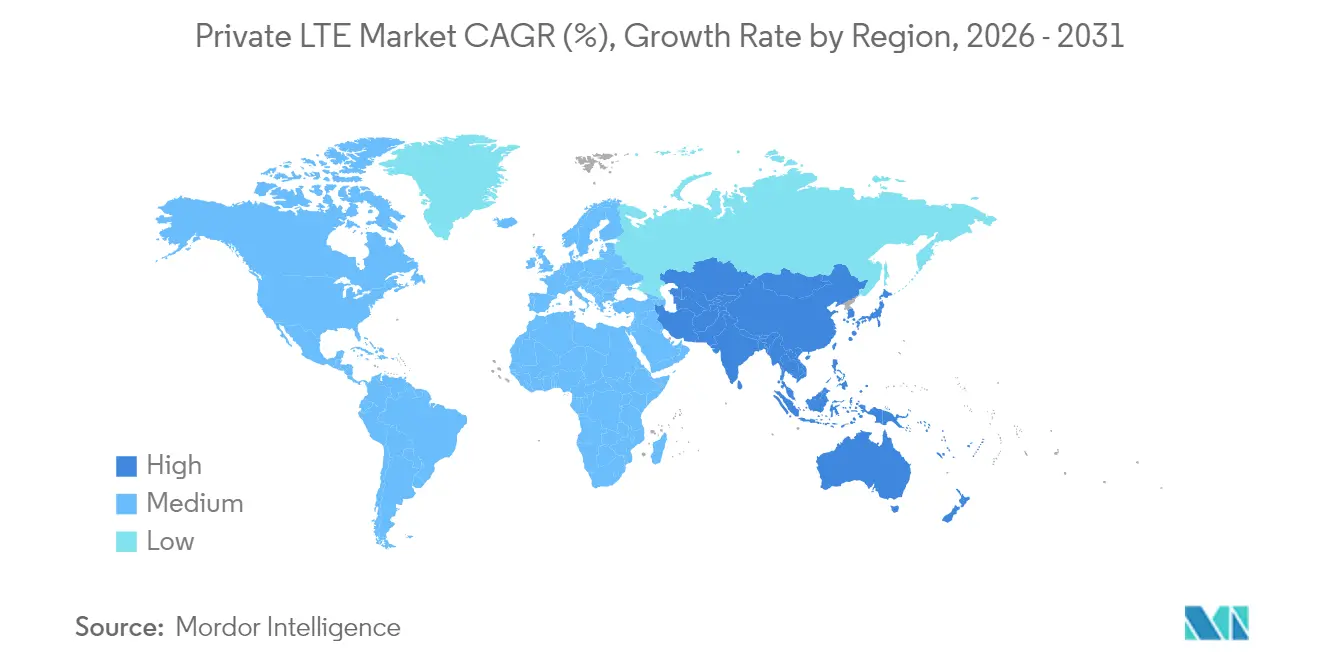
| Fastest Growing Market | Asia-Pacific |
| Largest Market | North America |
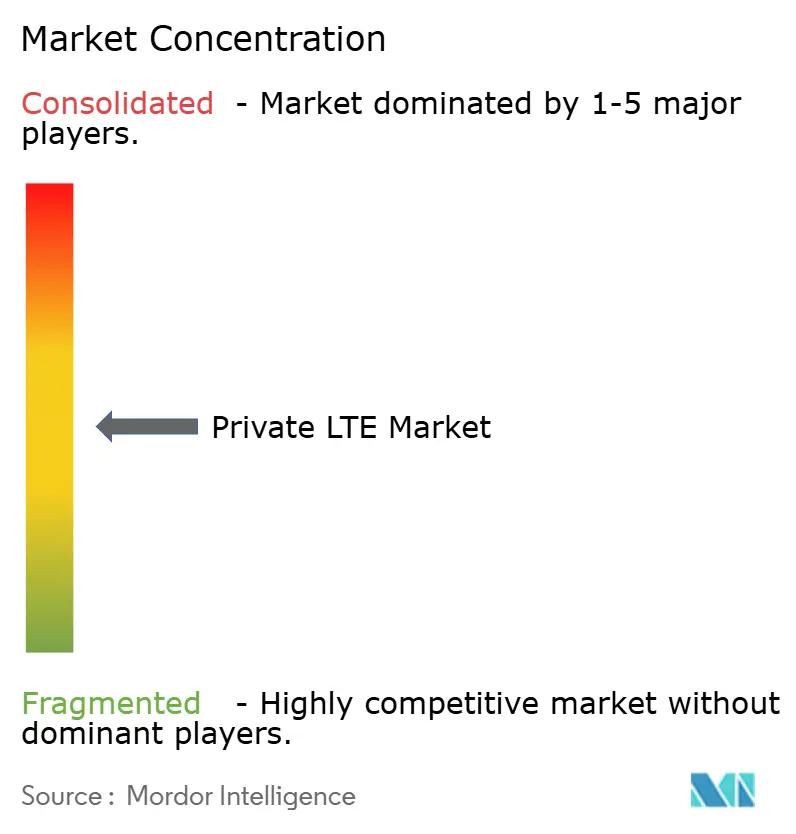
| Market Concentration | Medium |
Major Players *Disclaimer: Major Players sorted in no particular order Image © Mordor Intelligence. Reuse requires attribution under CC BY 4.0. | |
Private LTE Market Analysis by Mordor Intelligence
The private LTE market size is expected to grow from USD 5.24 billion in 2025 to USD 6.54 billion in 2026 and is forecast to reach USD 19.76 billion by 2031 at 24.77% CAGR over 2026-2031. Security-focused, deterministic performance is propelling adoption as enterprises digitize operations and place mission-critical workloads on dedicated cellular infrastructure.[1]Verizon Communications, “Verizon and NVIDIA work together to accelerate the edge,” verizon.com Early commercialization of shared spectrum, rapid progress on Industry 4.0 programs, and the rising need for ultra-reliable low-latency communications (URLLC) in harsh settings all reinforce growth. Industrial sites now favour private LTE over public alternatives because it delivers predictable coverage, streamlined quality-of-service management, and the option to retain full control of sensitive operational data. Edge computing integration is another accelerant, enabling local analytics on massive sensor streams without round-trip delays. Ecosystem innovation—in particular, open RAN, small-cell form factors, and CBRS device proliferation—is lowering entry barriers and widening the private LTE market addressable base.
Key Report Takeaways
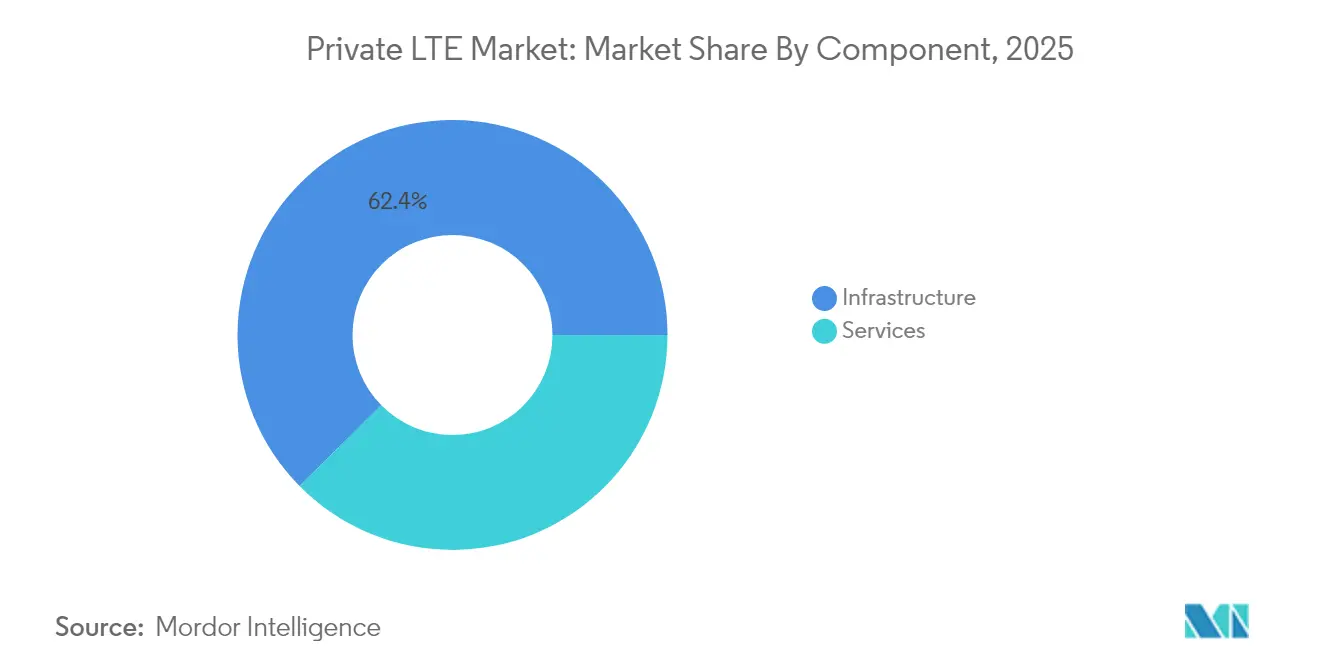
- By component, infrastructure led with 62.40% of the private LTE market share in 2025, while managed services are projected to register a 17.85% CAGR through 2031.
- By technology, TDD captured 54.30% revenue share in 2025; it is also advancing at a 16.55% CAGR to 2031.
- By deployment model, distributed architecture held 57.20% of the private LTE market size in 2025 and is forecast to grow at 16.1% CAGR between 2026-2031.
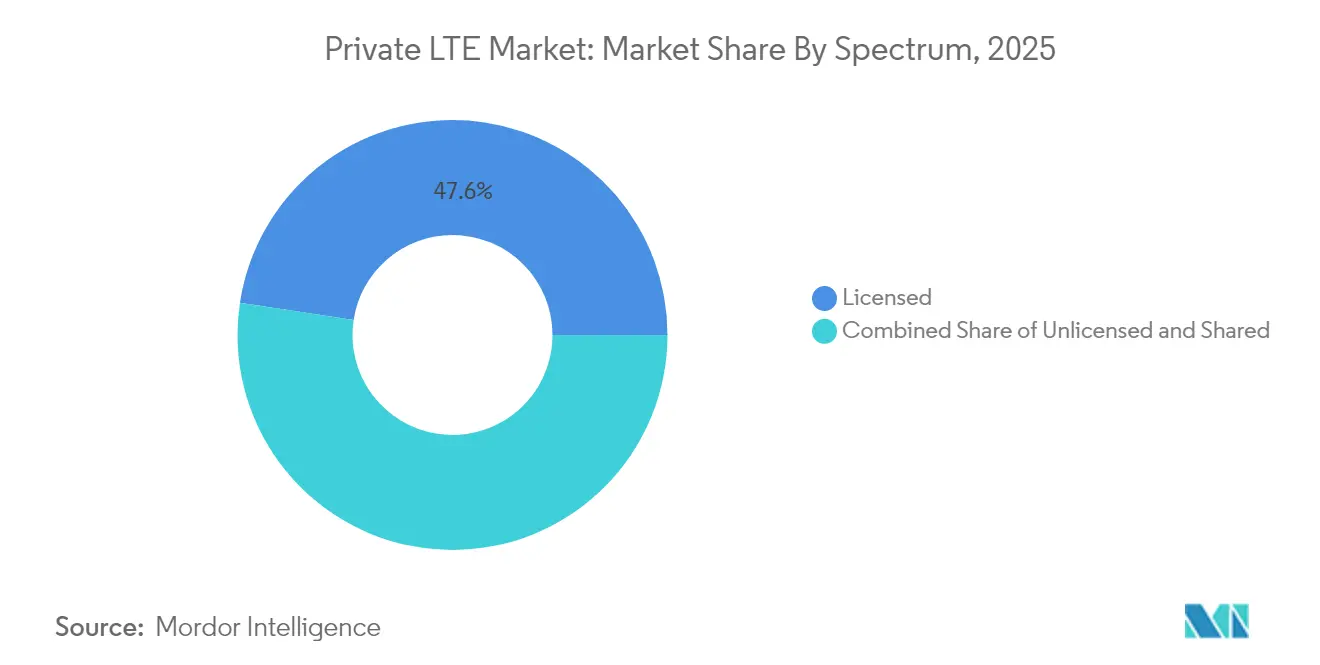
- By spectrum, licensed bands retained a 47.60% share in 2025, whereas shared CBRS spectrum is poised for the fastest 18.95% CAGR.
- By end-user industry, manufacturing accounted for 28.50% of the private LTE market size in 2025, while mining and oil and gas are expanding at a leading 25.10% CAGR.
- By geography, North America dominated with a 37.50% share in 2025; Asia-Pacific is the fastest-growing region at 12.6% CAGR.
Note: Market size and forecast figures in this report are generated using Mordor Intelligence’s proprietary estimation framework, updated with the latest available data and insights as of 2026.
Global Private LTE Market Trends and Insights
Drivers Impact Analysis*
| Driver | (~) % Impact on CAGR Forecast | Geographic Relevance | Impact Timeline |
|---|---|---|---|
| Spectrum liberalization and CBRS commercialization | +7.5% | North America, Europe, Japan, Australia | Medium term (2-4 years) |
| Industrial IoT and Industry 4.0 uptake | +6.2% | Global manufacturing hubs | Medium term (2-4 years) |
| Mission-critical URLLC demand in harsh sites | +5.3% | Mining regions, Oil and Gas fields | Short term (≤ 2 years) |
| Seamless migration path toward 5G SA | +3.8% | North America, Europe, advanced Asia-Pacific | Long term (≥ 4 years) |
| Source: Mordor Intelligence | |||
Spectrum Liberalization Unlocks Enterprise Deployment Surge
- Regulators are reallocating mid-band frequencies, giving enterprises unprecedented access to high-quality spectrum under frameworks such as CBRS. Around 370,000 CBRS devices had been deployed by end-2023, underscoring how shared bands reduce licensing hurdles and democratize network ownership.[2]OnGo Alliance, “CBRS Market Momentum,” ongoalliance.orgAffordable, interference-managed access has opened the private LTE market to mid-sized firms that previously lacked resources for exclusive licences. Beyond the United States, Germany, Japan, and Australia have issued local licences that let factories, ports, and utilities implement bespoke coverage footprints. The policy shift is expanding vendor ecosystems, stimulating small-cell innovation, and creating a pipeline of new industrial sites expected to deploy private LTE networks over the next three years.
Industrial IoT Drives Manufacturing Transformation
Smart-factory rollouts now hinge on reliable wireless backbones capable of sustaining thousands of sensors with latencies below 30 ms. Nearly 79% of early adopters said they achieved positive ROI within six months after installing private LTE to support automated guided vehicles, AR-assisted maintenance, and digital twins. Low-variance connectivity improves line-balance efficiency, which in turn drives predictive maintenance, quality analytics, and plant-wide energy optimisation. Manufacturers consistently discover incremental use cases, such as yard management and worker-safety wearables, once the initial network is live, creating a self-reinforcing adoption curve inside the private LTE market.
Mission-Critical Communications Enable Remote Operations
Mining pits, offshore rigs, and pipeline corridors operate beyond the reach of public macro networks. Private cellular provides autonomous haulage fleets, real-time gas monitoring, and geofencing alarms with the deterministic performance essential in USD 2 trillion mining value chains. Oil-refinery outages can cost USD 250,000 per hour; dedicated LTE links mitigate that risk by keeping control loops online during public network disruptions. The air-gapped architecture also addresses escalating cyber threats, giving chief security officers confidence to connect supervisory control and data acquisition (SCADA) assets.
Seamless Migration Path Toward 5G SA
Enterprises view private LTE as a stepping-stone toward full 5G standalone deployments. Equipment vendors are shipping software-upgradeable radios and cores, letting owners activate 5G NR when devices mature and spectrum awards become available. This forward compatibility de-risks today’s investment, keeping the private LTE market attractive even as 5G hype rises. Early adopters are piloting 5G slicing on top of existing LTE cores, proving that phased migration avoids forklift upgrades while still unlocking URLLC and time-sensitive networking for future automation roadmaps.
Restraints Impact Analysis*
| Restraint | (~) % Impact on CAGR Forecast | Geographic Relevance | Impact Timeline |
|---|---|---|---|
| High CAPEX and uncertain ROI | –8.2% | Global; acute in emerging markets | Short term (≤ 2 years) |
| Scarcity of integration talent | –5.4% | Global; pronounced in high-growth regions | Medium term (2-4 years) |
| Fragmented device-band support | –3.1% | Global; multi-vendor deployments | Medium term (2-4 years) |
| Budget cannibalisation by private 5G pilots | –2.3% | Advanced markets | Short term (≤ 2 years) |
| Source: Mordor Intelligence | |||
Capital Intensity Creates Adoption Barriers
Private LTE deployments involve radio and core equipment, resilient backhaul, site works and, in some regions, spectrum fees. Upfront costs often exceed internal hurdle rates, especially for mid-tier firms. Interest in network-as-a-service contracts is rising because OPEX subscriptions reduce capital shock and match spending to productivity gains. Quantifying intangible benefits such as cyber-hardening and downtime avoidance remains challenging, prolonging budget cycles. Open RAN hardware promises lower unit prices, yet integration overheads can erase savings for organisations lacking cellular expertise.
Integration Complexity Slows Implementation Velocity
Building a cellular network demands RF design, core configuration, SIM lifecycle management, and coexistence with existing Wi-Fi, PLC, or fibre systems. A global shortage of engineers versed in both IT and operational-technology disciplines delays go-lives, stretching average project timelines to beyond 12 months.[3]Kyndryl, “Bridging IT and OT Skills Gap,” kyndryl.com Enterprises counter this gap through managed-service contracts, though that can introduce vendor lock-in. Legacy industrial assets often lack native LTE modules, forcing gateways or retrofit radios that add cost and configuration overhead. Device-band fragmentation further complicates procurement as suppliers support only subsets of global private LTE bands.
*Our forecasts treat driver/restraint impacts as directional, not additive. The impact forecasts reflect baseline growth, mix effects, and variable interactions.
Segment Analysis
By Component: Services Outpace Infrastructure Growth
The infrastructure segment held 62.40% of the private LTE market in 2025, reflecting heavy spending on small cells, packet cores, and transport gear. Yet, services revenue is rising faster at a 17.85% CAGR because organisations lean on system integrators to sidestep internal skills shortages. Managed offerings bundle design, integration, and 24/7 operations, giving factories and utilities predictable budgets while accelerating time-to-value. Professional services demand remains high during greenfield projects, but recurring managed contracts are capturing a larger share of new bookings.
Radio access networks still account for the biggest slice of capital, though enterprises increasingly emphasise onsite core systems to enforce security policies. Transport backhaul upgrades are non-negotiable when connecting multiple plant zones to cloud dashboards. Vendors now promote “network-in-a-box” kits—pre-configured core plus small cells—capable of same-day activation. One such kit from Pente Networks maintained communications for emergency crews during the 2025 Los Angeles wildfires, highlighting how turnkey packaging broadens the private LTE market beyond technically-savvy buyers.


By Technology: TDD Dominance Reflects Spectrum Efficiency
Time-division duplexing captured 54.30% of revenue in 2025 and is projected to sustain the highest 16.55% CAGR. Asymmetric traffic in video surveillance and telemetry favours TDD’s dynamic allocation, maximising throughput within scarce mid-band channels. TDD also aligns with CBRS band allocations, reinforcing its position as the default in new private LTE market deployments.
Frequency-division duplexing retains a foothold in latency-sensitive control systems where strict separation of uplink and downlink is prized. However, modern schedulers reduce TDD jitter to sub-10 ms, narrowing the historical gap. Upcoming 5G releases will further refine TDD numerologies, assuring enterprises that today’s investment will remain relevant once they transition to 5G NR carrier aggregation.
By Deployment Model: Distributed Architecture Enables Edge Intelligence
Distributed topologies accounted for 57.20% of revenue in 2025, and the segment will expand at a 16.1% CAGR as firms push compute resources closer to OT endpoints. Locally-hosted user-plane functions keep production lines running during WAN outages—a critical safeguard for remote mines and offshore platforms. Edge-native private LTE networks also enable real-time visual inspection and AI inference with sub-20 ms round-trip latency.
Centralised C-RAN remains common on dense campuses where fibre backbones allow pooled baseband compute. Hybrid blueprints are emerging, empowered by open RAN splits that separate control and user planes. Cloud-native cores can now spin up on microservers placed beside machinery, while policy databases stay in central data centres. This flexibility lets multi-site manufacturers adapt architecture to each plant’s risk profile without buying discrete solutions for every site.
By Spectrum: Shared Bands Drive Democratised Access
Licensed holdings still represented 47.60% of revenue in 2025 because utilities, airports, and defence agencies value interference protection. Yet shared bands—led by CBRS—are expanding at a 18.95% CAGR, lifting barriers for enterprises that cannot justify multimillion-dollar exclusive licences. Roughly 370,000 authorised CBRS devices validate market readiness, with growth accelerating as integrators certify rugged tablets, sensors, and gateways.
Unlicensed options such as MulteFire attract budget-constrained warehouses, though interference and limited high-gain antenna choices cap performance. Dynamic-spectrum-access services are blurring category lines by brokering predictable bandwidth tiers within shared bands. Federated Wireless pushed the envelope in December 2024, unveiling enterprise-grade CBRS tiers that promise five-nines availability, drawing mission-critical workloads into the shared-spectrum fold.
By End-user Industry: Manufacturing Leads While Mining Accelerates
Manufacturing retained the highest 28.50% share of the private LTE market size in 2025, as smart-factory programs depend on deterministic wireless across expansive shop floors. Predictive quality, digital twins, and autonomous material handling hinge on consistent connectivity that Wi-Fi struggles to deliver at scale. Meanwhile, mining and oil/gas networks are expanding fastest at a 25.10% CAGR through 2031. Operators deploy mobile core trailers and ruggedised small cells to keep autonomous trucks, sensors, and worker tablets connected inside pits and along pipelines where public coverage is absent.
Energy utilities deploy private LTE for distribution-grid modernisation and wildfire-fault isolation. Logistics hubs employ it for yard management and high-value asset tracking. Healthcare groups pilot it for medical-device telemetry that demands both low latency and air-gapped security. Across all verticals, 39% of early adopters have already embedded AI analytics directly on their private networks to transform raw sensor data into actionable insights.
Geography Analysis
North America led with 37.50% of 2025 revenue thanks to the CBRS framework and a mature ecosystem of radio, device, and integrator partners. More than 4,700 private LTE and 5G networks were operational worldwide by end-2024, and a substantial share was in the United States. Local 5G pilots in manufacturing, healthcare, and utilities amplify demand, while hyperscaler edge zones make low-latency workload offload straightforward across major metros.
Asia-Pacific records the fastest 12.6% CAGR from 2026 to 2031. China deploys state-backed factory and mine networks, Japan issues local 5G licences in millimetre and mid-bands, and South Korea capitalises on its dense fibre backbone to host campus cores. India’s recent spectrum policy changes have unlocked trials in automotive and pharmaceutical plants. Australia already operates more than 50 private LTE systems, primarily to streamline remote-area iron ore and lithium extraction, and its market is forecast to hit AUD 695 million by 2027, according to ACMA.
Europe ranks second in deployment count, holding roughly 40% of global private installations by mid-2023, according to GSMA. Germany’s 3.7–3.8 GHz local licences spur manufacturing adoption; the United Kingdom’s Shared Access framework simplifies licences for ports and farms. The European 5G Observatory reports that 73% of pioneer bands were assigned by March 2024, forming a solid spectral foundation for industrial networks. Vodafone’s pledge to roll out open RAN on 2,500 sites is expected to reduce equipment costs across Continental Europe, indirectly benefiting enterprise buyers seeking turnkey private LTE projects.

Competitive Landscape
The private LTE market shows moderate concentration. Incumbent vendors—Nokia, Ericsson, and Huawei—retain a stronghold through end-to-end portfolios and global support organisations. Nokia alone served more than 710 private-wireless customers by end-2023, including 159 on 5G cores. Meanwhile, focused suppliers such as Celona and Accelleran capture greenfield campuses with agile, enterprise-centric packaging.
Open RAN disrupts established procurement patterns by encouraging multi-vendor splits. AT and T’s USD 14 billion plan to route 70% of traffic over open platforms within five years validates scale economics and will stimulate similar shifts inside the private LTE market. Strategic alliances multiply: Verizon pairs with NVIDIA for edge-AI bundles; system integrators partner with hyperscalers to pre-integrate cloud analytics and SIM management. Competitive differentiation is tilting toward vertical-specific blueprints rather than radio wattage or core throughput. Vendors that embed security, analytics, and lifecycle automation into single-pane dashboards are winning deals where IT and OT teams converge.
Service providers also expand beyond connectivity resale into fully managed network-as-a-service contracts. Because private LTE ownership entails SIM orchestration, RF optimisation and patch cadence, enterprises often prefer partners that assume operational risk. Consequently, rivals compete on depth of field engineers, cybersecurity certifications and rapid device-onboarding tools rather than on hardware alone. As ecosystems diversify, the private LTE market is expected to remain dynamic, with periodic share reshuffles driven by spectrum releases, open architecture maturation and the pace of industrial digitalisation.
Private LTE Industry Leaders
Nokia Corporation
Huawei Technologies Co., Ltd.
NEC Corporation
Ericsson
Qualcomm
- *Disclaimer: Major Players sorted in no particular order

Recent Industry Developments
- May 2025: Verizon and NVIDIA launched a joint solution enabling AI applications to run over private 5G networks with Mobile Edge Compute, bringing real-time intelligence to enterprise facilities.
- March 2025: Palo Alto Networks unveiled Prisma SASE 5G, an AI-powered zero-trust platform tailored for private LTE and IIoT devices.
- March 2025: GSMA issued a whitepaper highlighting flexible deployment models that are propelling private 5G uptake.
- January 2025: AT and T committed USD 14 billion to migrate 70% of network traffic onto open platforms over five years, catalysing open RAN adoption


Research Methodology Framework and Report Scope
Market Definitions and Key Coverage
Our study defines the private LTE market as global revenue that enterprises or public agencies earn from dedicated Long-Term Evolution networks they wholly own or control. Revenue streams span radio and core infrastructure, enablement software, integration projects, and managed connectivity delivered over licensed, shared, or unlicensed spectrum.
Scope Exclusions: Public macro-cell subscriptions, Wi-Fi estates, and proprietary narrow-band systems are outside this analysis.
Segmentation Overview
- By Component
- Infrastructure
- Radio Access (RAN)
- Core (EPC/5GC)
- Backhaul and Transport
- Services
- Professional Services
- Managed Services
- Infrastructure
- By Technology
- Frequency-Division Duplexing (FDD)
- Time-Division Duplexing (TDD)
- By Deployment Model
- Centralised (C-RAN)
- Distributed
- By Spectrum
- Licensed
- Unlicensed (MulteFire, 5 GHz)
- Shared (CBRS, LAA)
- By End-user Industry
- Manufacturing
- Energy and Utilities
- Mining and Oil and Gas
- Transportation and Logistics
- Public Safety and Defense
- Healthcare
- Enterprise / Campuses
- Others
- By Geography
- North America
- United States
- Canada
- South America
- Brazil
- Argentina
- Rest of South America
- Europe
- Germany
- United Kingdom
- France
- Italy
- Spain
- Rest of Europe
- Asia Pacific
- China
- Japan
- India
- South Korea
- Rest of Asia Pacific
- Middle East and Africa
- Middle East
- United Arab Emirates
- Saudi Arabia
- Qatar
- Israel
- Rest of Middle East
- Africa
- South Africa
- Nigeria
- Rest of Africa
- Middle East
- North America
Detailed Research Methodology and Data Validation
Primary Research
Telecom engineers, spectrum advisers, factory-automation heads, and regulators across North America, Europe, and Asia-Pacific shared practical numbers on small-cell pricing, license fees, and deployment timelines, letting us tighten every desk-derived assumption.
Desk Research
We began by pulling spectrum awards, device certificates, and private-network filings from the International Telecommunication Union, the FCC, Ofcom, and the Global mobile Suppliers Association, giving us a live count of deployments. Company 10-Ks, investor decks, and respected trade press then filled pricing and adoption gaps across sectors.
Next, our analysts drew shipment figures from D&B Hoovers, scanned contract news on Dow Jones Factiva, and tapped Marklines for industrial IoT rollouts, anchoring base-year volumes and average selling prices. These sources illustrate the breadth of evidence; numerous additional datasets informed checks and clarification.
Market-Sizing & Forecasting
Mordor analysts launch a top-down demand pool that rebuilds enterprise connectivity spend by vertical, adjusts the share migrating to private LTE, and normalizes currency. Selective bottom-up roll-ups, sampled small-cell shipments, core licenses, and managed service contracts corroborate totals. Key model drivers include CBRS device activations, average small-cell ASPs, Industry 4.0 retrofit counts, spectrum-liberalization dates, and regional manufacturing value added. A multivariate regression projects each driver five years forward, while scenario analysis captures a faster swing toward private 5G.
Data Validation & Update Cycle
Automated variance flags, peer review rounds, and a senior sign-off precede release. We refresh numbers every year and push interim updates after major spectrum moves or landmark contracts so clients receive the freshest baseline.
Why Mordor's Private LTE Baseline Earns Boardroom Confidence
Published estimates often diverge because firms mix pilot revenue with production networks, freeze price curves, or apply uneven currency rates.
According to Mordor Intelligence, fully operational private LTE networks will generate USD 5.24 billion in 2025, and we update that view annually.
Benchmark comparison
| Market Size | Anonymized source | Primary gap driver |
|---|---|---|
| USD 5.24 B (2025) | Mordor Intelligence | - |
| USD 5.85 B (2024) | Global Consultancy A | Hardware only; services ignored |
| USD 6.26 B (2024) | Industry Association B | Includes carrier-managed APNs |
| USD 6.81 B (2025) | Regional Consultancy C | Static ASPs; no FX alignment |
These contrasts show that our disciplined scope choices, mixed modeling approach, and yearly refresh keep Mordor's numbers transparent, traceable, and dependable for planning.


Key Questions Answered in the Report
What is a private LTE network and how does it differ from public cellular service?
A private LTE network is a dedicated cellular system owned or fully controlled by an enterprise, giving the operator full authority over coverage, quality-of-service and security policies, unlike public mobile networks that serve many unrelated users.
How large is the private LTE market today and how fast is it growing?
The private LTE market is valued at USD 6.54 billion in 2026 and is projected to reach USD 19.76 billion by 2031, expanding at a 24.77% CAGR over 2026-2031.
Which industries are adopting private LTE the fastest?
Manufacturing holds the largest 28.50% share, but mining and oil/gas form the quickest-growing segment with a 25.10% CAGR because they need ultra-reliable connectivity in remote, hazardous locations.
Why is shared spectrum such as CBRS important for private LTE deployments?
Shared mid-band frameworks like CBRS lower licensing costs and administrative hurdles, enabling mid-sized enterprises to deploy carrier-grade wireless networks without purchasing expensive exclusive spectrum.
How does edge computing enhance the value of private LTE networks?
By allowing data to be processed on-site rather than backhauled to distant data centres, edge computing cuts latency and supports real-time AI, computer-vision inspection and other time-sensitive Industry 4.0 workloads.
What are the main challenges enterprises face when implementing private LTE?
High upfront capital expenditure, shortages of integration talent and fragmented device-band support prolong deployment timelines and can blur near-term return-on-investment projections.
Page last updated on:


