Market Overview
| Study Period | 2020 - 2031 |
|---|---|
| Forecast Data Period | 2026 - 2031 |
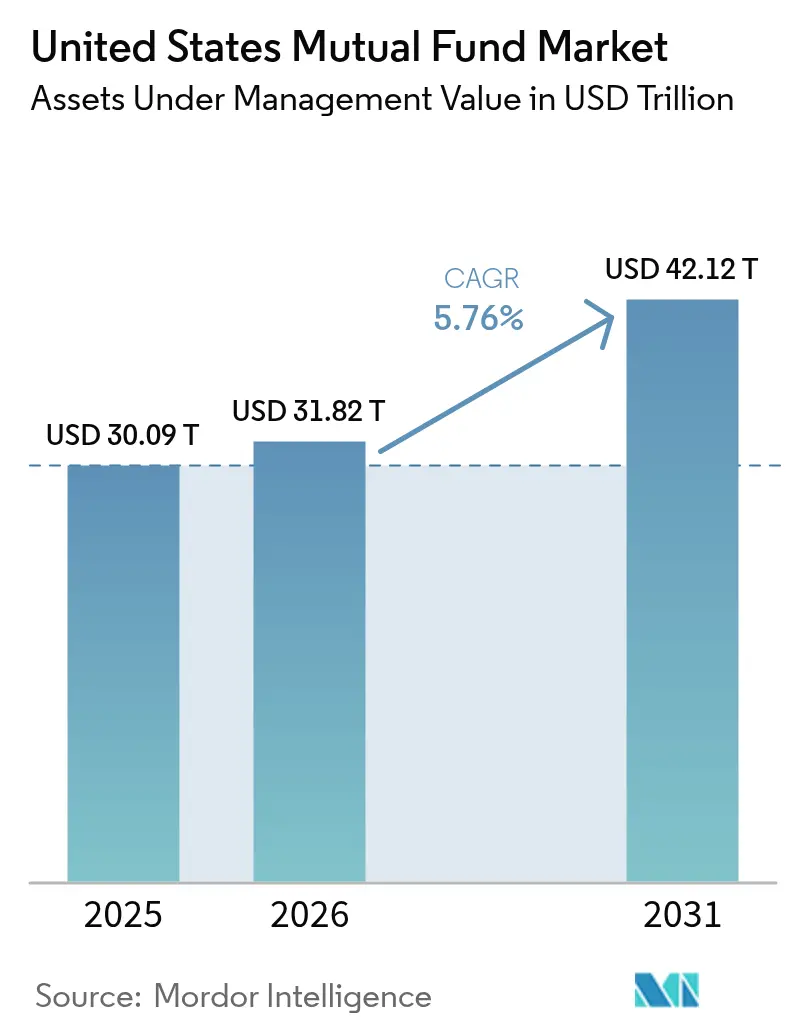
| Base Year Market Size (2025) | USD 30.09 Trillion |
| Market Size (2026) | USD 31.82 Trillion |
| Market Size (2031) | USD 42.12 Trillion |
| Growth Rate (2026 - 2031) | 5.76% CAGR |
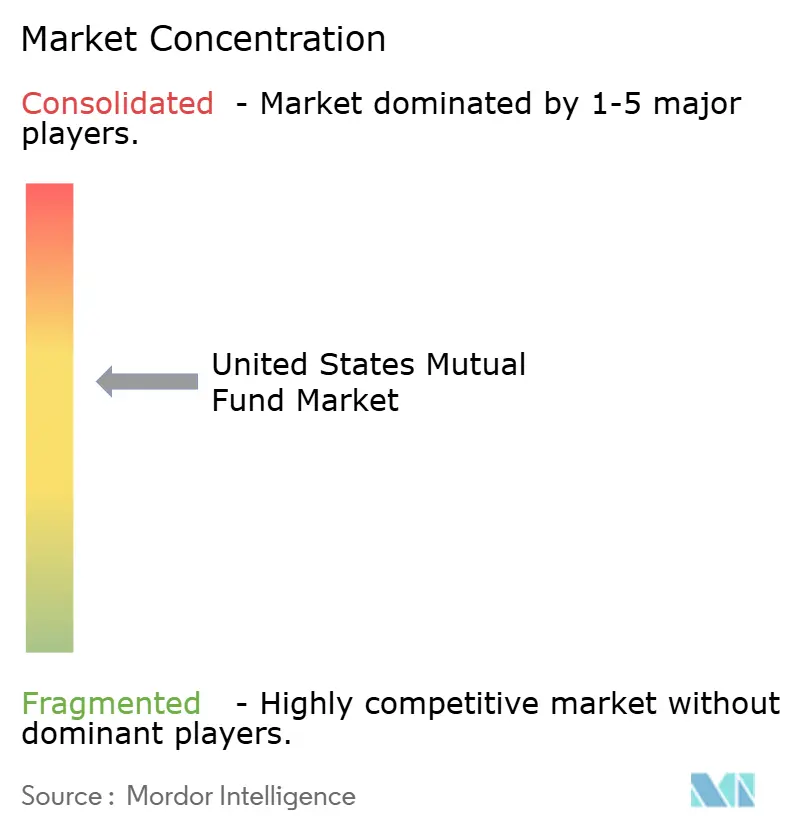
| Market Concentration | Medium |
Major Players *Disclaimer: Major Players sorted in no particular order Image © Mordor Intelligence. Reuse requires attribution under CC BY 4.0. | |
United States Mutual Fund Market Analysis by Mordor Intelligence
The United States Mutual Fund Market size in terms of assets under management value is expected to increase from USD 30.09 trillion in 2025 to USD 31.82 trillion in 2026 and reach USD 42.12 trillion by 2031, growing at a CAGR of 5.76% over 2026-2031.
Household adoption continues to set the pace for the United States mutual fund market, with 56.4% of United States households holding mutual fund or registered investment company shares in 2024, up from 54.4% in 2023, a shift that keeps retirement channels at the center of new inflows. Long-term mutual funds saw sizable outflows in 2025 while ETFs absorbed strong inflows, yet forward growth stabilizes on expanding index adoption, steady fee compression, and regulatory structures that elevate low-cost, transparent options in qualified plans. The United States mutual fund market also reflects policy-driven reallocation within cash vehicles, as 2023 SEC money market reforms steered institutional liquidity from prime funds toward government strategies under revised liquidity and fee provisions. These policy and structural changes are shaping an environment where target-date defaults, scale-driven cost advantages, and platform-agnostic access matter more than individual product pushes in the United States mutual fund market.
Key Report Takeaways
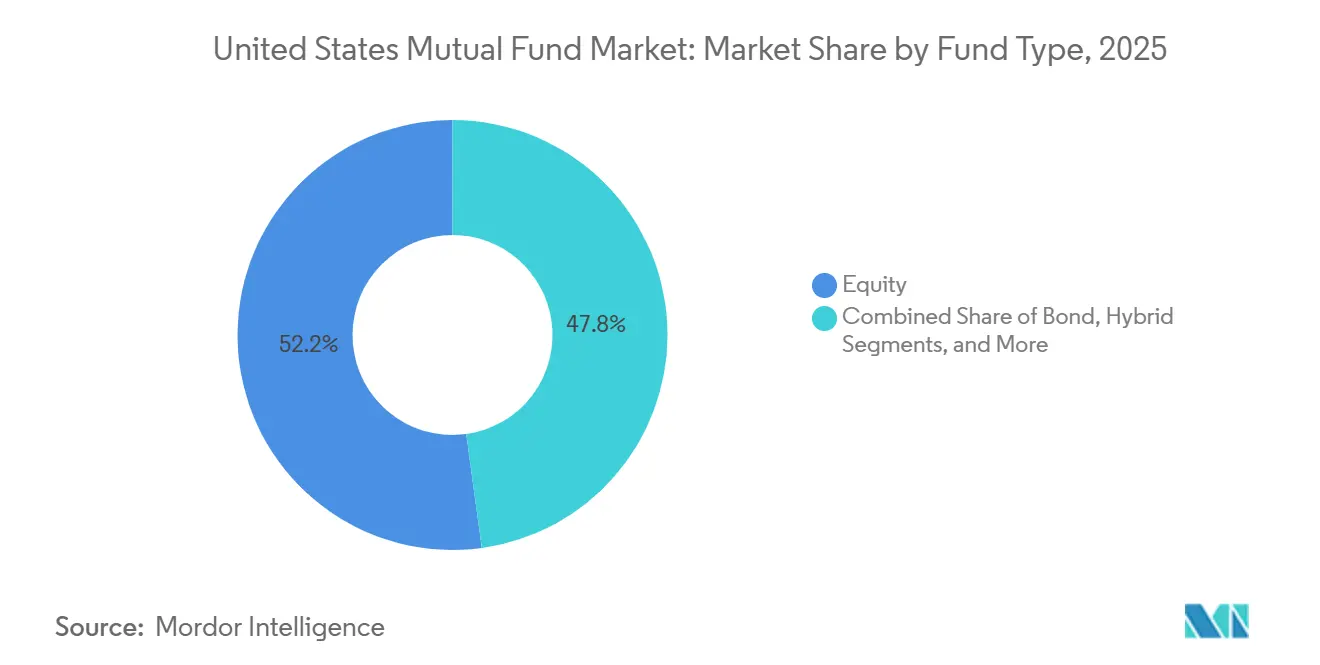
- By fund type, equity led with 52.18% of the United States mutual fund market share in 2025, while other funds are projected to grow fastest at a 8.17% CAGR through 2031.
- By investor type, retail held 88.27% of the United States mutual fund market share in 2025 and is projected at a 6.02% CAGR through 2031.
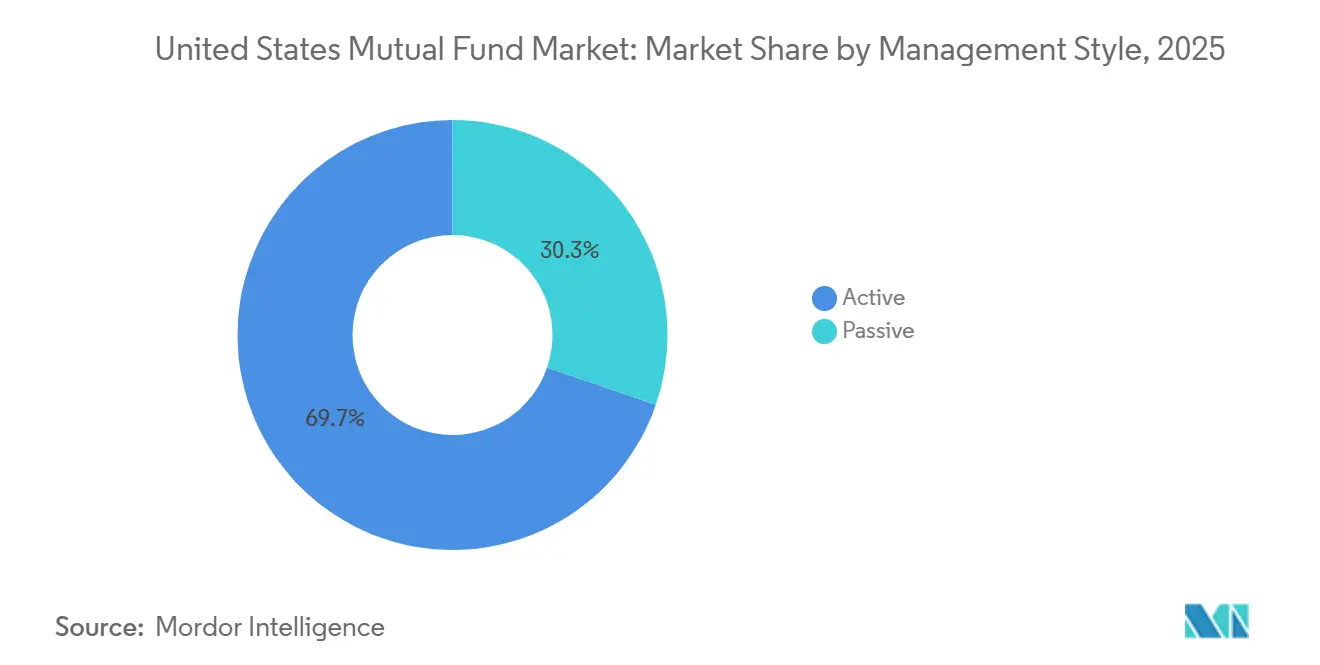
- By management style, active strategies held 69.74% of the United States mutual fund market share in 2025, while passive strategies are forecast to expand at a 7.12% CAGR through 2031.
- By distribution channel, securities firms retained 60.36% of the United States mutual fund market share in 2025, while online trading platforms are projected to grow at an 8.18% CAGR through 2031.
Note: Market size and forecast figures in this report are generated using Mordor Intelligence’s proprietary estimation framework, updated with the latest available data and insights as of 2026.
United States Mutual Fund Market Trends and Insights
Drivers Impact Analysis*
| Driver | (~) % Impact on CAGR Forecast | Geographic Relevance | Impact Timeline |
|---|---|---|---|
| SECURE 2.0 auto-enrollment and auto-escalation in new 401(k)/403(b) plans from 2025 catalyze default flows into target-date and core mutual funds | +1.2% | National, with early gains in large metropolitan retirement markets (New York, Chicago, San Francisco Bay Area, Dallas-Fort Worth) | Short term (≤ 2 years) |
| Heightened fiduciary standards for retirement advice (DoL 2024 rule, Reg BI momentum) accelerate migration to low-cost, transparent mutual fund lineups | +0.9% | National, concentrated in RIA-heavy markets (Northeast corridor, Pacific Northwest, Texas metro areas) | Medium term (2-4 years) |
| Structural cash migration toward government money market funds via brokerage sweeps and institutional treasury policies sustains the MMF AUM base | +0.7% | National, institutional flows concentrated in financial centers (New York, Boston, Charlotte) | Long term (≥ 4 years) |
| Index mutual funds' continued share gains in retirement channels (fee compression, default usage) support passive mutual fund growth | +1.4% | National, with above-average penetration in tech-worker-dominated markets (Silicon Valley, Seattle, Austin) | Medium term (2-4 years) |
| 529-to-Roth IRA rollover pathway (SECURE 2.0) increases longer-term retail engagement with mutual funds | +0.3% | National, higher early adoption in high-income, education-focused states (Massachusetts, New Jersey, Virginia, California) | Long term (≥ 4 years) |
| Digitization of distribution (fund supermarkets, online platforms, RIA marketplaces) reduces friction and broadens retail access to mutual funds | +1.1% | National, accelerated in millennial/Gen-Z investor cohorts across all regions | Short term (≤ 2 years) |
| Source: Mordor Intelligence | |||
SECURE 2.0 Auto-Enrollment and Auto-Escalation Catalyze Default Flows
The SECURE 2.0 provisions, effective for plan years beginning in 2025, make automatic enrollment a core feature for new 401(k) and 403(b) plans, which channels new participants into qualified default investment alternatives that are typically target-date mutual funds in smaller and mid-sized plans. Default contribution rates, annual auto-escalation, and employer-plan expansion together create steady, rules-based contributions that compound inside diversified mutual fund sleeves aligned to participant age cohorts. This reshapes the near-term demand profile of the United States mutual fund market because a larger base of participants now enters plans through defaults that prioritize low-cost and transparent options. Defined contribution assets already anchor retail participation, and higher participation rates magnify the flow-through to target-date funds and core index building blocks in the United States mutual fund market. Fiduciary guidance around defaults and plan oversight reinforces the need for consistent, scalable building blocks in QDIAs, which favors established complexes with broad passive and active toolkits. As new cohorts enter plans under auto-enrollment, the weight of these flows becomes a durable support to the United States mutual fund market growth over the forecast period.
Heightened Fiduciary Standards Accelerate Migration to Low-Cost Lineups
The Department of Labor’s Retirement Security Rule, finalized in April 2024, tightened the definition of fiduciary investment advice, which elevates scrutiny on rollover recommendations and fee reasonableness in plan menus and advice practices. In parallel, the SEC’s Regulation Best Interest and the Commission’s 2026 examination priorities keep cost, conflicts, and process at the center of retail advice oversight, which steers advisors and plan sponsors toward lower-cost mutual fund share classes and index-aligned solutions. This compliance environment rewards managers who can deliver plain-vanilla exposures at scale while preserving target-date and core fixed income solutions that satisfy fiduciary prudence tests in retirement channels. The practical effect is a continued migration from high-fee share classes to institutional and R6 classes in plans, along with an expanding toolkit of low-fee options on advisor platforms that streamline fiduciary documentation. These forces are structurally supportive of the United States mutual fund market because they align cost discipline, transparency, and default usage in ways that reinforce persistent asset retention in retirement accounts.
Structural Cash Migration Toward Government Money Market Funds Sustains MMF AUM
SEC reforms adopted in 2023 imposed liquidity fees for institutional prime and tax-exempt money market funds when daily redemptions exceeded 5% of net assets and raised liquid-asset minimums for all money funds, which together reduced the appeal of institutional prime funds and redirected assets to government money market strategies. Industry data tracked a large swing from prime institutional funds into government vehicles in 2024, which is consistent with the new rules set and the operational certainty that government funds provide to corporate treasurers and sweep programs. Government money market funds now benefit from bank treasury use, brokerage sweeps, and liquidity-coverage frameworks that treat these holdings as high-quality liquid assets in many institutional contexts. Even as rates evolve in the next cycle, the policy design and operational preferences that shifted flows toward government funds are expected to remain in place, which supports baseline stability for the cash segment of the United States mutual fund market. As a result, cash allocations inside brokerage and institutional accounts are likely to remain anchored in government MMFs, dampening volatility in a quarter of total assets across the United States mutual fund market.
Index Mutual Funds’ Share Gains in Retirement Channels Support Passive Growth
Index mutual funds and ETFs crossed a symbolic mark in early 2026, as passive assets exceeded active assets in combined long-term fund categories, driven by consistent cost advantages and fiduciary preferences for transparent tracking in plans and advisory models [1]Investment Company Institute, “Release: Active and Index Investing, January 2026,” Investment Company Institute, ici.org. The strongest adoption remains in domestic equity, though index penetration in world equity has also reached a substantial share, which reflects the diversification priorities of both plan sponsors and RIAs constructing model portfolios. Fee reductions announced by leaders like Vanguard reinforce the competitive position of major indexing suites and support the continued cost glide path that underpins passive share gains in the United States mutual fund market [2]Vanguard, “Vanguard To Deliver More Than Half a Billion in Expected Savings To Investors Since 2025,” Vanguard, corporate.vanguard.com. Target-date defaults, which rely heavily on index sleeves for equity and core fixed income, extend this dynamic by delivering low all-in costs across participant cohorts in plans of all sizes. Together, these patterns make passive flows a central driver of incremental growth in the United States mutual fund market through the forecast period.
Restraints Impact Analysis*
| Restraint | (~) % Impact on CAGR Forecast | Geographic Relevance | Impact Timeline |
|---|---|---|---|
| Accelerating mutual fund-to-ETF conversions siphons assets and flows from mutual funds | -0.8% | National, concentrated in RIA-dominated markets and institutional channels | Short term (≤ 2 years) |
| Collective Investment Trusts overtake mutual funds in DC target-date vehicles, eroding mutual funds’ retirement plan share | -1.1% | National, strongest in large and mega DC plans (>USD 50M assets) | Medium term (2-4 years) |
| SEC 2023 money market reforms diminish prime MMF appeal and sponsor supply | -0.4% | National, institutional flows concentrated in financial centers | Medium term (2-4 years) |
| Tax inefficiency in taxable accounts disadvantages active mutual funds versus ETFs | -0.5% | National, most pronounced in high-net-worth taxable accounts | Long term (≥ 4 years) |
| Source: Mordor Intelligence | |||
Accelerating Mutual Fund-to-ETF Conversions Siphon Assets
A record wave of mutual fund-to-ETF conversions in 2025 demonstrated advisor and investor preference for tax efficiency, intraday liquidity, and lower fees inside ETF wrappers supported by in-kind creation and redemption mechanics[3]Tidal Financial Group, “The Great Migration: Wall Street’s Wave of Mutual Fund to ETF Conversions,” Tidal Financial Group, tidalfinancialgroup.com. Several large managers executed or announced conversions and share-class innovations that make the ETF vehicle available without sacrificing track records, including exemptive relief for ETF share classes within existing funds. Empirical work by the Federal Reserve has linked the growth of ETF ownership to lower underlying stock price volatility and narrower bid-ask spreads, which supports the structural appeal of the ETF format to advisors building model portfolios. Conversions are often accompanied by fee cuts, which intensify competitive pressure on legacy mutual funds and accelerate migration in the United States mutual fund market. As more managers pursue either full conversions or multi-share-class structures, net flows continue to tilt toward ETFs, which weighs on long-term mutual fund totals even as retirement plan use of mutual funds remains resilient.
Collective Investment Trusts Erode Mutual Funds’ Retirement Plan Franchise
Collective investment trusts surpassed mutual funds in target-date fund assets in 2024, an inflection driven by lower costs, institutional trustee oversight, and flexible pricing for large plan sponsors seeking fee compression and fiduciary defensibility. Industry groups report broader adoption expectations for CITs across plan sizes, which points to further erosion of mutual fund share inside retirement menus as sponsors seek to minimize all-in plan costs. Mutual fund sponsors have responded with CIT versions of flagship strategies and share-class price cuts, yet fee differentials remain a prominent driver in large and mega plans. These trends pressure active mutual fund lineups most, while passive mutual fund options remain competitive in smaller plans that lack scale for negotiated CIT pricing. As this transition persists, the United States mutual fund market will rely even more on index-based defaults, small and mid-plan segments, and multi-vehicle strategies to preserve retirement presence.
*Our forecasts treat driver/restraint impacts as directional, not additive. The impact forecasts reflect baseline growth, mix effects, and variable interactions.
Segment Analysis
By Fund Type: Equity Dominance Gives Way to Alternatives
Equity funds commanded 52.18% of the United States mutual fund market share in 2025, while other funds are projected to grow fastest at a 8.17% CAGR during 2026-2031. Money market totals were elevated by policy and institutional preferences for government vehicles after 2023 reforms, a baseline that moderates the pace of outflows if yields compress. Long-term mutual fund outflows in 2025 contrasted with stabilizing conditions ahead, as retirement default dynamics and fee reductions offset some active equity pressure in the United States mutual fund market. Equity index suites retain material cost advantages over active peers, which shapes the core building blocks in model portfolios and target-date glide paths.
Within equity, advisor models continue to pair broad-market index cores with selective active satellites in areas where research intensity may add value, while fixed income sees a more balanced active-index mix because credit selection and duration positioning can justify moderate active fees. Money market funds hold a durable role inside brokerage sweep and institutional liquidity programs despite potential rate normalization, which supports a large cash base in the United States mutual fund market. Bond allocations benefit from demand for intermediate taxable and municipal exposure as savers look for durable income with limited volatility. In this setting, the United States mutual fund industry faces a measured shift from equity-led growth toward a more balanced asset mix as income needs rise. Managers with scaled core bond index options and credible active fixed income franchises are positioned to capture the rotation over the forecast period.


By Investor Type: Retail Supremacy Masks Institutional Opportunism
Retail households controlled 88.27% of assets in 2025, and a great portion of their long-term mutual fund holdings sat in retirement accounts, which ties aggregate participation to plan defaults, employer matching, and fiduciary oversight. These features make retail flows systematic and persistent, especially where auto-enrollment places new savers into target-date mutual funds aligned to age cohorts. Retail growth is projected at a 6.02% CAGR through 2031, while institutional flows display greater tactical flexibility across cash and short-duration bond funds inside the United States mutual fund market. Regulators continue to emphasize fiduciary process and cost control in retail advice, which reinforces the cost-sensitive patterns visible in plan menus and RIA models.
Distinct behaviors persist by channel and objective. Institutional users treat government MMFs as overnight liquidity tools and rotate duration based on rate paths and corporate cash cycles. Retail cohorts diversify slowly through defaults and lifestyle solutions like target-date funds, which sustain multi-decade relationships for recordkeepers and large fund families in the United States mutual fund market. Advisors and plan sponsors maintain a preference for standardized, low-cost building blocks that simplify monitoring and documentation under ERISA and Reg BI expectations. Over time, these patterns support the stability of retail assets while leaving tactical opportunity and liquidity management to institutional accounts that move between cash and short-duration fixed income exposures.
By Management Style: Passive’s Structural Ascent
Active strategies held 69.74% of assets in 2025, but index funds and ETFs surpassed active in combined long-term assets by January 2026, a turning point supported by years of fee compression and fiduciary preferences for transparent, benchmark-tracking exposures. The United States mutual fund market size for index strategies within long-term funds reached a majority share in early 2026, reflecting the pull of low-cost equity sleeves in target-date and model portfolios. Passive growth is projected at a 7.12% CAGR through 2031, supported by index penetration in domestic and world equity and by scaled platforms that pass cost savings through to investors. Active fixed income remains relevant where security selection and risk positioning can add value, but fee benchmarks continue to narrow the pricing corridor. As platform providers align menus with fiduciary guidance, passive cores and selective active satellites define the portfolio construction center of gravity in the United States mutual fund market.
Across styles, large complexes apply scale to reduce expense ratios and broaden share class access, which compounds the competitive gap with mid-tier managers. Index equity leads on cost and adoption, while bond categories remain mixed across active and passive due to credit and duration decisions. Target-date series embed passive equity and bond sleeves to anchor costs, which sustains passive growth in retirement channels. The United States mutual fund market benefits as participants accrue compounding benefits from lower fees over long saving horizons. Continued fee innovation and vehicle flexibility also keep advice platforms aligned with cost and transparency expectations.
By Distribution Channel: Online Platforms Disrupt Securities Firm Hegemony
Securities firms retained a 60.36% share in 2025, but online trading platforms posted the fastest projected growth rate at 8.18% through 2031 as mobile-first access, no-transaction-fee fund shelves, and fractional trading improve reach for younger investors. This push reduces intermediation costs and expands access to institutional-class shares on fund supermarkets and advisor marketplaces across the United States mutual fund market. Regulatory standards put additional pressure on conflicted compensation models, which further encourage transparent pricing and platform-agnostic distribution. The expansion of digital voting choice programs and advice tools also highlights how distribution is blending access, governance, and planning inside unified client experiences. These shifts keep the United States mutual fund market focused on experience, price, and access rather than legacy load-sharing economics.
Banks and trust platforms continue to serve captive wealth management clients and retirement plan sponsors, yet online platforms scale faster by offering transparent costs, rapid onboarding, and algorithm-driven personalization. Advisors draw on institutional platforms inside custodians to source index cores and selected active funds aligned with fiduciary documentation. Securities firms respond by emphasizing comprehensive planning and bundling, although fee compression and rule interpretations sustain headwinds. As younger cohorts build wealth, the convenience of mobile access and platform-level advice keeps digital channels on a steeper growth path in the United States mutual fund market. This widens the distribution mix and raises the bar on client experience across all channels.
Geography Analysis
Regional patterns in the United States reflect where employer-sponsored plans are prevalent, where advisory practices are dense, and where financial centers anchor cash management for institutions. Money market funds represented 24% of total assets at the start of 2025, which underscores the role of financial hubs and brokerage sweep programs in cash allocations across the United States mutual fund market. The United States mutual fund market size in cash and short-duration strategies remains supported by bank treasury and corporate cash needs, even as rates evolve. Retirement-focused metros with high plan coverage provide a steady base of contributions through auto-enrollment and target-date defaults. These dynamics stabilize flows and magnify the influence of fiduciary rules at the local level.
Tech-centric regions with younger investor bases show strong adoption of index building blocks and digital distribution, which together favor large passive suites and platform access. Traditional financial centers concentrate institutional cash and government MMF holdings, which keeps the cash segment a meaningful share of the United States mutual fund market. Regions with robust plan coverage and recordkeeping footprints also anchor relationships for target-date defaults, which consolidate flows at scaled managers with multi-vehicle offerings. Oversight from federal regulators on advice standards and money market rules applies uniformly, yet the effects are most visible where plan assets and institutional cash pools are largest. These patterns contribute to a diversified but concentrated regional footprint.
The United States mutual fund market size tied to money market allocations provides an anchor across coastal and financial-center regions, while growth corridors benefit from new plan formation and migration-driven wealth accumulation. In all regions, index adoption inside retirement defaults and advisor models continues to rise, which supports passive expansion through the forecast period. As plan sponsors and advisors standardize on low-cost menus, differences across metros narrow in cost terms, and distribution advantages shift from proprietary channels to digital and platform breadth. These trends keep the United States mutual fund market balanced between cash stability in financial centers and retirement-led growth in emerging wealth regions. The outcome is a durable base for compounding assets across the national landscape.
Competitive Landscape
The United States mutual fund market remains moderately concentrated, with the top ten managers benefiting from scale in distribution, recordkeeping integrations, and expense ratio leverage that is difficult for smaller firms to match. Passive leaders have compressed fees to low single-digit basis points in core equity and broad-market fixed income, which increases pressure on active franchises to justify pricing and deliver consistency in risk-adjusted returns. Target-date fund complexes continue to compete on glide-path design, cost, and operational capabilities across mutual fund and CIT variants, while ETF platforms expand to preserve client relationships as vehicle preferences evolve. The largest complexes sustain their advantage by providing index cores, active satellites, and retirement vehicles in parallel, which aligns with advisor and plan-sponsor demands inside the United States mutual fund market.
Strategic moves reflect this multi-vehicle imperative. Vanguard’s broad fee reductions since 2025 highlight how investor ownership and scale translate into continued price leadership that resonates across retail and retirement channels. Goldman Sachs executed multiple mutual fund-to-ETF conversions in 2025 to align product structures with advisor preferences for tax-efficient wrappers and trading flexibility, positioning its active ETF lineup for ongoing growth. Dimensional secured SEC approval to offer ETF share classes within existing mutual funds, signaling the evolution toward unified portfolios that can distribute in both mutual fund and ETF formats. These steps help leading managers defend relationships as flows pivot among mutual funds, ETFs, and CITs in the United States mutual fund market.
Operational investments also define differentiation. Vanguard expanded investor choice in proxy voting for index funds and continued to add tools around digital advice, while T. Rowe Price broadened private markets capabilities alongside its target-date franchise to maintain client breadth. Recordkeeping platforms and plan services remain critical moats that preserve multi-decade relationships through auto-enrollment defaults and payroll integration for leading providers in the United States mutual fund market. As regulation and client expectations center on cost, transparency, and access, firms with scaled, multi-vehicle toolkits are best positioned to capture forecast growth.
United States Mutual Fund Industry Leaders
State Street Global Advisors
Fidelity Investments
Capital Group (American Funds)
BlackRock
Vanguard
- *Disclaimer: Major Players sorted in no particular order

Recent Industry Developments
- February 2026: Vanguard announced the addition of 17 new investment funds to its Vanguard Investor Choice program, expanding eligibility to approximately 2 million new investors and increasing total eligible investors to 22 million with over USD 3.6 trillion in assets, marking the fifth expansion of the world's largest proxy voting choice program and underscoring Vanguard's commitment to empowering individual investors in United States equity index funds with proportionate voting rights, a governance innovation that differentiates Vanguard from competitors offering only fund-board-level proxy voting.
- December 2025: Goldman Sachs Asset Management converted four mutual funds, managing USD 1.5 billion in Assets Under Supervision (AUS), into actively managed Exchange-Traded Funds (ETFs). This transition enhances tax efficiency, trading flexibility, transparency, and cost-effectiveness. The funds, now named Goldman Sachs Enhanced United States Equity ETF (GUSE), Goldman Sachs Growth Opportunities ETF (GSGO), Goldman Sachs Value Opportunities ETF (GVLE), and Goldman Sachs Technology Opportunities ETF (GTOP), target diverse investment opportunities.
- November 2025: Vanguard introduced three active equity ETFs: Vanguard Wellington U.S. Value Active ETF (VUSV), Vanguard Wellington U.S. Growth Active ETF (VUSG), and Vanguard Wellington Dividend Growth Active ETF (VDIG). Managed by Wellington Management, these ETFs offer long-term allocations with proven strategies, cost efficiency, and transparency.
- October 2025: Akre Capital completed the conversion of the Akre Focus Fund into the Akre Focus ETF. Managed by the same investment team, the ETF adheres to Akre Capital's “Three-Legged Stool” strategy, offering shareholders a more cost-effective, tax-efficient, and transparent investment vehicle.


Research Methodology Framework and Report Scope
Market Definitions and Key Coverage
Our study defines the US mutual funds market as the total assets under management held by Securities and Exchange Commission-registered open-ended mutual funds that pool money from retail and institutional investors and invest in equities, bonds, hybrid strategies, and money market instruments. Exchange-traded funds, closed-end funds, and collective investment trusts fall outside this frame.
Scope exclusion: Assets parked in variable annuity subaccounts, unit investment trusts, and separately managed accounts are not considered.
Segmentation Overview
- By Fund Type
- Equity
- Bond
- Hybrid
- Money Market
- Others
- By Investor Type
- Retail
- Institutional
- By Management Style
- Active
- Passive
- By Distribution Channel
- Online Trading Platform
- Banks
- Securities Firm
- Others
Detailed Research Methodology and Data Validation
Primary Research
We validate the desk work through interviews with portfolio managers, fund accountants, independent trustees, and platform executives across New York, Boston, Chicago, and Charlotte. Their views on channel-specific demand, passive uptake, and pricing help us stress-test every assumption before forecasts are frozen.
Desk Research
Our analysts begin with monthly holdings, flow, and expense data released by the Investment Company Institute, Federal Reserve Z.1 tables, SEC form N-CEN filings, and Bureau of Economic Analysis savings series, which set the baseline for asset swings and contribution rates. We then layer insights from SIFMA outlooks, CFA Institute journals, audited fund reports, and comment letters to grasp fee pressure, product launches, and regulatory shifts. Paid databases add depth; D&B Hoovers flags sponsor financial moves while Dow Jones Factiva tracks distribution alliances and policy headlines. Patent searches on Questel occasionally spotlight fintech tools affecting operating costs. The sources noted are illustrative, not exhaustive.
Market-Sizing & Forecasting
A top-down build starts with quarterly ICI totals, which are reconciled with audited sponsor balance sheets. Targeted bottom-up checks, such as sampling share price multiplied by shares outstanding for large equity funds, catch outliers. Key drivers in our model include household retirement contributions, passive fund penetration, average expense ratios, short-term rates, S&P 500 total returns, and taxable bond issuance. Multivariate regression projects these variables through 2030, and scenario analysis frames upside and downside paths when macro volatility spikes.
Data Validation & Update Cycle
Outputs pass a three-step review that compares model totals with Federal Reserve flow tables and public AUM milestones. Variances above two percentage points trigger a rerun. Mordor analysts refresh the model each year, with interim updates after material rule changes or market shocks.
Why Mordor's US Mutual Fund Industry Size & Share Analysis Baseline is Dependable
Published estimates often diverge because firms mix asset buckets, choose different index years, or refresh at unequal speeds. Our disciplined scope choices and yearly update cadence narrow such drift.
Key gap drivers include whether money market assets are rolled in, if exchange-traded funds are blended with mutual funds, and whether revenue rather than AUM is being sized. Currency translation points and straight-line growth assumptions also widen gaps elsewhere.
Benchmark comparison
| Market Size | Anonymized source | Primary gap driver |
|---|---|---|
| USD 30.09 Tn (2025) | Mordor Intelligence | - |
| USD 34.58 Tn (2024) | Regional Consultancy A | Includes ETFs and projects straight-line growth from 2021 highs |
| USD 29.11 Tn (Jan 2025) | Industry Association B | Point-in-time snapshot; excludes hybrid feeder funds |
| USD 34.4 Bn (2024) | Independent Research C | Measures fee revenue not assets, inflating percentage growth impressions |
The comparison shows our figure sitting between point-in-time tallies and revenue-only estimates. As a result, decision makers receive a balanced, transparent baseline anchored to traceable variables and steps.


Key Questions Answered in the Report
What is the current size and projected growth of the United States mutual fund market?
The United States mutual fund market size is USD 31.82 trillion in 2026 and is projected to reach USD 42.12 trillion by 2031 at a 5.76% CAGR.
Which product segments lead and which grow fastest in the United States mutual fund market?
Equity funds led with a 52.18% share in 2025, while other funds are forecast to grow fastest at a 8.17% CAGR through 2031.
How do SECURE 2.0 and fiduciary rules affect the United States mutual fund market?
Auto-enrollment and stricter advice standards push assets into low-cost defaults and institutional share classes, which support index-led growth and sustained retirement flows.
How are ETFs and CITs changing asset flows in the United States mutual fund market?
ETF conversions and share-class innovations shift taxable flows toward ETFs for tax efficiency, while CITs have overtaken mutual funds in target-date assets for large plans due to lower fees.
What is the outlook for passive versus active strategies in the United States mutual fund market?
Passive reached a majority of long-term assets in January 2026 and is projected to grow at a 7.12% CAGR, while active remains relevant in select fixed income and niche equity roles.
Which distribution models are gaining share in the United States mutual fund market?
Online platforms and fund supermarkets are growing fastest due to mobile access, transparent fees, and institutional-class availability, while securities firms remain the largest channel.
Page last updated on:


