North America Herbicide Market Size and Share
Market Overview
| Study Period | 2018 - 2031 |
|---|---|
| Forecast Data Period | 2026 - 2031 |
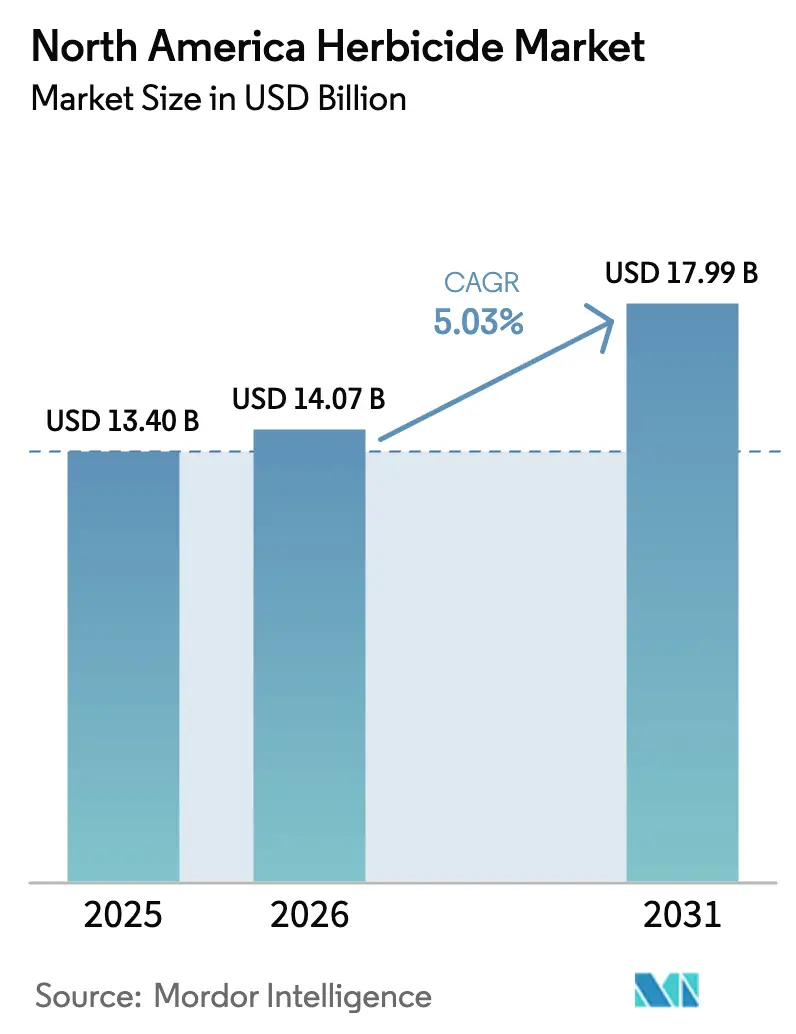
| Base Year Market Size (2025) | USD 13.40 Billion |
| Market Size (2026) | USD 14.07 Billion |
| Market Size (2031) | USD 17.99 Billion |
| Growth Rate (2026 - 2031) | 5.03% CAGR |
| Market Concentration | High |
Major Players *Disclaimer: Major Players sorted in no particular order Image © Mordor Intelligence. Reuse requires attribution under CC BY 4.0. | |
North America Herbicide Market Analysis by Mordor Intelligence
The North America herbicide market size is expected to grow from USD 13.40 billion in 2025 to USD 14.07 billion in 2026 and is forecast to reach USD 17.99 billion by 2031 at 5.03% CAGR over 2026-2031. Robust demand stems from precision-agriculture adoption, stacked mode-of-action (MOA) chemistries that counter weed resistance, and continuing consolidation among the top five suppliers. The United States accounts for 85.4% of the market value in 2024, reflecting 320 million harvested acres that require cost-effective chemical weed control. Canada is the fastest-growing national segment, as longer growing seasons and streamlined pesticide approvals accelerate herbicide uptake. Supply-chain dependence on Chinese technical-grade active ingredients, coupled with state-level glyphosate restrictions, injects cost volatility yet simultaneously pushes innovation toward alternative chemistries and smart-spray systems.
Key Report Takeaways
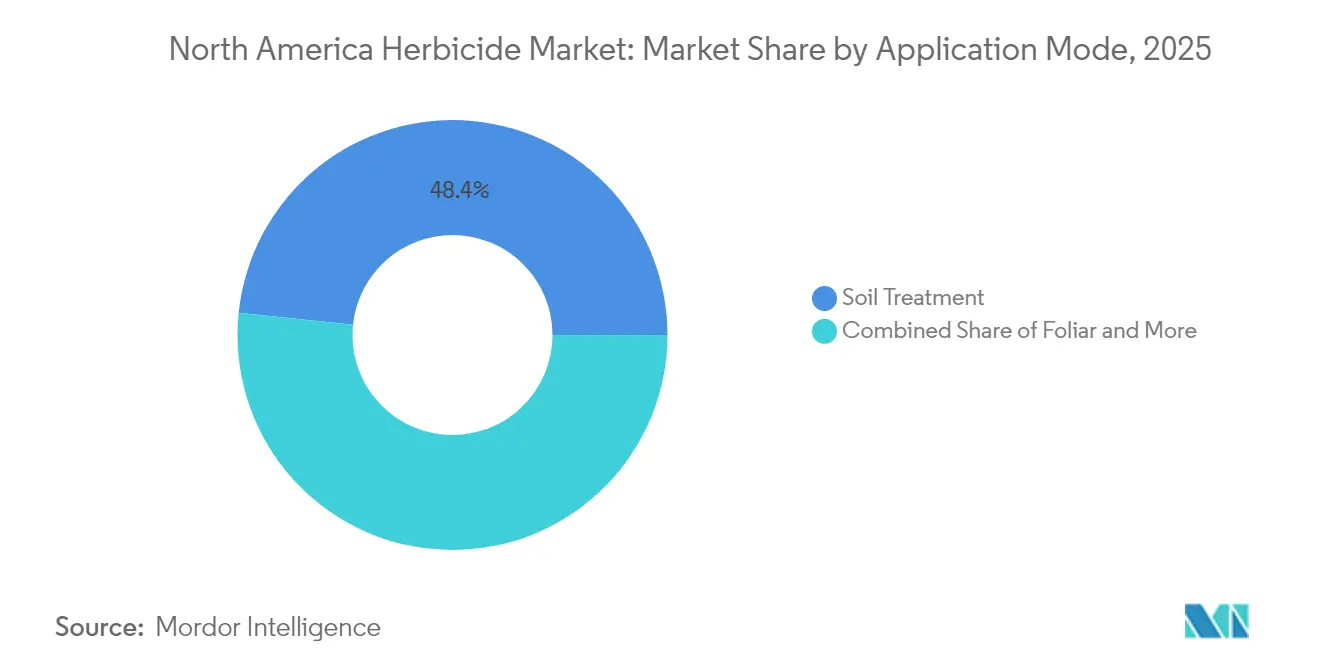
- By application mode, soil treatment captured 48.35% of the North America herbicide market share in 2025 while advancing at a 5.18% CAGR through 2031.
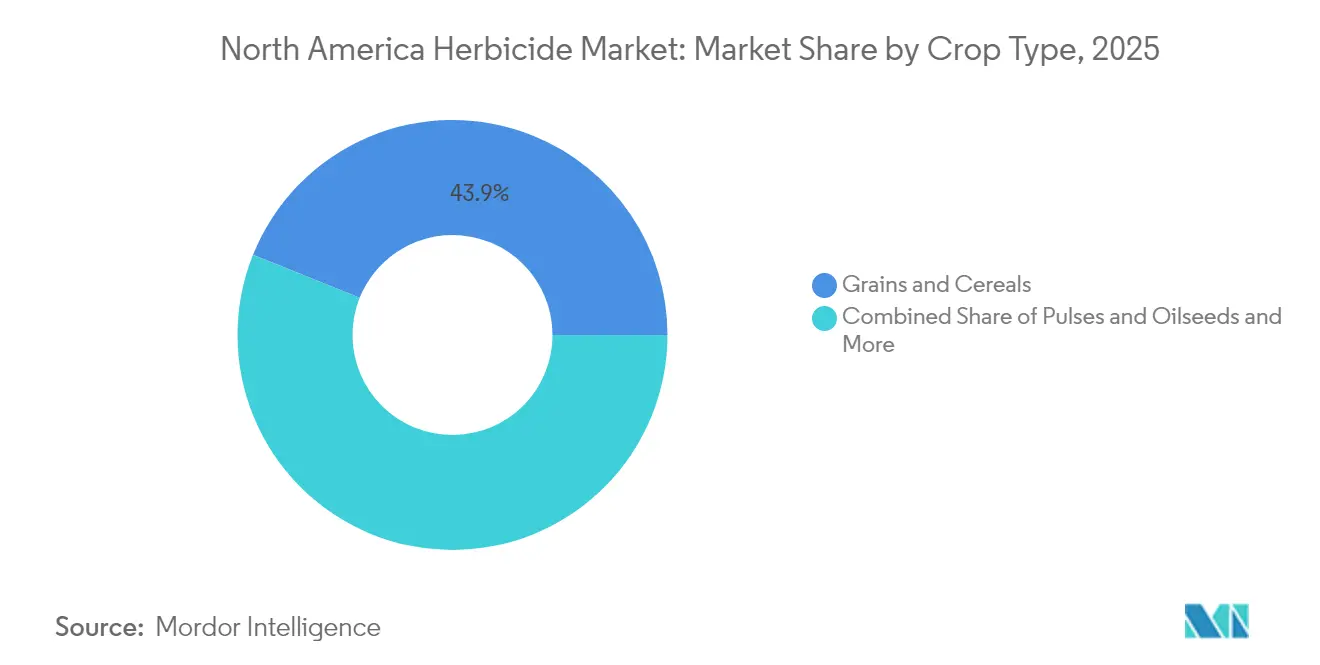
- By crop type, grains and cereals accounted for a 43.92% share of the North America herbicide market size in 2025 and are projected to expand at a 5.21% CAGR.
- By country, the United States held 85.05% revenue share in 2025, while Canada is set to register the fastest 6.21% CAGR through 2031.
Note: Market size and forecast figures in this report are generated using Mordor Intelligence’s proprietary estimation framework, updated with the latest available data and insights as of 2026.
North America Herbicide Market Trends and Insights
Drivers Impact Analysis*
| Driver | (~) % Impact on CAGR Forecast | Geographic Relevance | Impact Timeline |
|---|---|---|---|
| Persistent weed-resistance push for multi-MOA and stacked formulations | +1.2% | North America, concentrated in Midwest corn belt | Medium term (2-4 years) |
| Expansion of conservation/no-till acreage boosting chemical weed control | +0.8% | US Great Plains, Canadian Prairies | Long term (≥4 years) |
| Rapid adoption of GPS/AI smart-spray platforms raising herbicide ROI | +1.0% | US Corn Belt, expanding to Canada and Mexico | Short term (≤2 years) |
| Drought-driven chemigation retrofits across U.S. West and Mexico | +0.6% | Western US, Northern Mexico | Medium term (2-4 years) |
| Growth of pastureland herbicide programs to unlock forage ROI | +0.4% | US Southeast, Texas, Canadian grasslands | Long term (≥4 years) |
| Rise of subscription-based digital agronomy bundles with herbicide tie-ins | +0.7% | Technology-forward regions: Iowa, Illinois, Ontario | Short term (≤2 years) |
| Source: Mordor Intelligence | |||
Persistent Weed Resistance Drives Multi-MOA Innovation
More than 70 million acres now host weeds resistant to multiple herbicide groups, compelling growers to adopt stacked MOA formulations that are 15–25% more expensive yet protect yield potential. Industry research and development investment exceeded USD 1.2 billion in 2025 in pursuit of novel chemistries, although no new MOA has cleared registration since 2005. Premium pricing sustains revenue growth for the North America herbicide market, incentivizing discovery alliances between crop-protection giants and biotechnology start-ups.
Conservation Tillage Expansion Amplifies Chemical Dependence
No-till and reduced-till practices covered 105.2 million acres in 2024, accounting for a 35% share of US cropland.[1]USDA National Agricultural Statistics Service, “Conservation Tillage Survey,” nass.usda.gov Eliminating multiple mechanical passes conserves soil moisture and lowers fuel expense but increases reliance on chemical weed control by up to 60%. The trend accelerates in drought-prone regions where soil conservation becomes critical for maintaining crop yields, particularly across the Great Plains, where precipitation patterns have become increasingly erratic. Conservation programs, such as the USDA's Conservation Reserve Program, provide additional incentives, with participants required to maintain herbicide-based weed control on 24 million enrolled acres.[2]Source: USDA Farm Service Agency, “Conservation Reserve Program,” fsa.usda.gov
Smart-Spray Technology Transforms Application Economics
Computer-vision sprayers such as John Deere See and Spray cut herbicide volumes by 59% across 1.2 million treated acres while maintaining weed-kill levels. Capital payback often occurs within three seasons, catalyzing 25% adoption among large farms in 2025. Precision performance elevates return on investment for premium active ingredients and accelerates digital-agriculture partnerships. Early adopters report payback periods of 2-3 years on USD 150,000 system investments, driving rapid expansion across corn and soybean production regions where labor costs continue escalating.
Chemigation Infrastructure Responds to Water Scarcity
Irrigation systems retrofitted for chemigation grew 18% in 2024, particularly across California, Nebraska, and Texas, where drought pressure is acute.[3]Source: USDA Natural Resources Conservation Service, “Chemigation Guidelines,” nrcs.usda.gov Injecting herbicides through pivots enhances soil incorporation, reduces labor, and synchronizes chemical and water delivery, reinforcing the North America herbicide market trajectory. Regulatory frameworks governing chemigation have evolved to address environmental concerns, with the EPA requiring backflow prevention devices and injection system safeguards that add USD 5,000-15,000 to installation costs but ensure groundwater protection.
Restraints Impact Analysis*
| Restraint | (~) % Impact on CAGR Forecast | Geographic Relevance | Impact Timeline |
|---|---|---|---|
| Accelerating state-level glyphosate restrictions and litigation risk | -0.9% | US states: California, New York, and Hawaii | Short term (≤2 years) |
| Premiums for organically grown produce shrinking conventional acres | -0.3% | US West Coast, Northeast organic clusters | Medium term (2-4 years) |
| EPA/PMRA drift-mitigation rules raising application costs | -0.5% | US and Canada, dicamba-sensitive regions | Short term (≤2 years) |
| Supply-chain exposure to Chinese technical-grade AI imports | -0.4% | North America-wide vulnerability | Medium term (2-4 years) |
| Source: Mordor Intelligence | |||
Glyphosate Restrictions Create Regulatory Fragmentation
State-level glyphosate restrictions have accelerated following California's Proposition 65 listing and mounting litigation costs, with 12 states implementing various use limitations or labeling requirements by 2024. These regulatory patchworks create compliance complexity for national agricultural retailers and increase distribution costs as companies must maintain separate inventory streams for different jurisdictions. Bayer's USD 10.9 billion glyphosate litigation settlement has not eliminated future liability risks, as new lawsuits continue emerging and some states consider outright bans on glyphosate use in sensitive areas.
Organic Agriculture Expansion Reduces Herbicide Demand
Certified organic acreage reached 5.4 million acres in North America by 2024, growing at 5-7% annually as consumer demand for organic products maintains premium pricing despite economic headwinds. While organic farming represents only 1.6% of total cropland, its concentration in high-value specialty crops creates a disproportionate impact on herbicide demand in the fruit and vegetable segments. Organic price premiums of 20-40% for many crops provide sufficient economic incentive for conversion despite higher labor costs and yield variability associated with mechanical weed control.
*Our forecasts treat driver/restraint impacts as directional, not additive. The impact forecasts reflect baseline growth, mix effects, and variable interactions.
Segment Analysis
By Application Mode: Soil Treatment Methods Extend Leadership
Soil treatment applications accounted for 48.35% of the North America herbicide market share in 2025, with a 5.18% CAGR outlook. Chemigation upgrades let growers deliver pre-emergent actives through irrigation, trimming labor, and improving uniformity. This compatibility with water-scarce regions scales adoption across Western irrigated acres and supports premium pricing for residual chemistries integral to conservation systems.
Foliar applications remain essential for in-season control of resistant weeds and represent the second-largest revenue contributor. Post-emergence programs increasingly rely on multiple MOA mixes and precision optics that limit off-target drift. Fumigation is confined to high-value specialty acreage after the Environmental Protection Agency withdraws several soil sterilants, curbing volume, although retaining lucrative margins. Integration with digital maps elevates variable-rate soil treatments, reinforcing the North America herbicide market size over the forecast period.


By Crop Type: Grains and Cereals Dominate Despite Resistance
Grains and cereals held a 43.92% share of the North America herbicide market size in 2025 and will expand at a 5.21% CAGR as corn, soybean, and wheat areas intensify weed-science protocols. Escalating resistant Palmer amaranth and waterhemp infestations drive demand for premium pre-mixes, elevating revenue even where total volumes stabilize.
Commercial crops such as cotton and sugarbeet require sophisticated chemical rotations that exceed USD 100 per acre in some systems, sustaining high per-acre values. Fruit and vegetable producers adopt herbicides as labor shortages raise mechanical control costs, particularly in California. Turf and ornamental segments grow steadily on municipal and commercial maintenance contracts, though urban restrictions challenge volume in certain metropolitan areas.
Geography Analysis
The United States anchors the North America herbicide market with 85.05% of market value, underpinned by 320 million harvested acres. Corn Belt states together consume 40% of national herbicide volumes as continuous corn-soybean rotations create persistent weed pressure. Western states exhibit the fastest chemigation uptake in response to water scarcity, reflecting the synergy between irrigation retrofits and pre-emergent herbicide activation. California specialty crops command per-acre herbicide spending several times higher than field crops, buoying revenue even as acreage growth slows.
Canada contributes an expanding share, driven by longer frost-free periods that push agricultural frontiers northward. Conservation tillage prevalence is higher here than in the United States, intensifying dependence on chemical weed management. Health Canada’s Pest Management Regulatory Agency (PMRA) expedites access to new actives, giving Canadian growers early-mover advantages that translate into premium product adoption.
Mexico’s modernization agenda funds precision farming incentives and imports of the latest-generation herbicides under North American trade provisions. Fragmented distribution networks and limited credit access constrain immediate uptake, yet rising export-oriented vegetable production demands robust weed control. Harmonization initiatives aim to streamline registrations and cut time-to-market for new chemistries, unlocking additional upside for the North America herbicide market.
Competitive Landscape
North America's herbicide space displays moderate concentration, with major players like Bayer, Syngenta, Corteva, BASF, and Nufarm accounting for a significant portion of regional sales. Bayer deepened vertical integration by acquiring KWS cereals, combining herbicide traits with proprietary germplasm. Syngenta made substantial investments in Louisiana biologicals production to complement chemical offerings with microbial actives, reflecting portfolio diversification.
Technology alliances determine competitive edge. BASF partnered with John Deere to link See and Spray optics with its portfolio, demonstrating chemical-tech convergence that reduces application volumes while preserving efficacy. Corteva expanded Granular analytics, steering growers toward in-house formulations through agronomic algorithms. Patent filings suggest renewed emphasis on microencapsulation and safener research to boost selectivity.
Supply risk management is another focal point. Corteva's capacity expansion in Canada reduces exposure to Asian intermediates while aligning production with fast-growing Prairie demand. FMC's acquisition of Nutrien's western Canada distribution enhances downstream access, mirroring a wider strategy to control last-mile delivery and advisory services.
North America Herbicide Industry Leaders
BASF SE
Bayer AG
Corteva Agriscience
Nufarm Ltd
Syngenta Group
- *Disclaimer: Major Players sorted in no particular order

Recent Industry Developments
- August 2025: Bayer has initiated the registration process of a new herbicide, Icafolin, with a novel mode of action for corn and soybean weed control in North America. The product aims to address resistance issues and expand options for growers, with launch anticipated later this decade.
- March 2025: Nufarm United States obtained EPA registration for two herbicides: Weedar XHL and Weedmaster XHL. The formulations provide improved handling, lower volatility, and better compatibility for controlling weeds in cereal grains, pastures, and non-crop areas. The products will be available for the 2025 growing season.
- January 2025: FMC U.S. has introduced Keenali Complete and Keenali GR herbicides, powered by Dodhylex (tetflupyrolimet), targeting rice weed control. Keenali Complete (2027) offers dual modes of action for the Mid-South, while Keenali GR (2028) provides selective preemergent control for California growers.


North America Herbicide Market Report Scope
The North America Herbicide Market Report is Segmented by Application Mode (Chemigation, Foliar, Fumigation, and Soil Treatment), Crop Type (Commercial Crops, Fruits and Vegetables, Grains and Cereals, Pulses and Oilseeds, and Turf and Ornamental), and Geography (United States, Canada, Mexico, and Rest of North America). The Market Forecasts are Provided in Terms of Value (USD) and Volume (Metric Tons).
| Chemigation |
| Foliar |
| Fumigation |
| Soil Treatment |
| Commercial Crops |
| Fruits and Vegetables |
| Grains and Cereals |
| Pulses and Oilseeds |
| Turf and Ornamental |
| Canada |
| Mexico |
| United States |
| Rest of North America |
| Application Mode | Chemigation |
| Foliar | |
| Fumigation | |
| Soil Treatment | |
| Crop Type | Commercial Crops |
| Fruits and Vegetables | |
| Grains and Cereals | |
| Pulses and Oilseeds | |
| Turf and Ornamental | |
| Country | Canada |
| Mexico | |
| United States | |
| Rest of North America |


Market Definition
- Function - Herbicides are chemicals used to control or prevent weeds from preventing crop growth and yield loss.
- Application Mode - Foliar, Seed Treatment, Soil Treatment, Chemigation, and Fumigation are the different type of application modes through which crop protection chemicals are applied to the crops.
- Crop Type - This represents the consumption of crop protection chemicals by Cereals, Pulses, Oilseeds, Fruits, Vegetables, Turf, and Ornamental crops.
| Keyword | Definition |
|---|---|
| IWM | Integrated weed management (IWM) is an approach to incorporate multiple weed control techniques throughout the growing season to give producers the best opportunity to control problematic weeds. |
| Host | Hosts are the plants that form relationships with beneficial microorganisms and help them colonize. |
| Pathogen | A disease-causing organism. |
| Herbigation | Herbigation is an effective method of applying herbicides through irrigation systems. |
| Maximum residue levels (MRL) | Maximum Residue Limit (MRL) is the maximum allowed limit of pesticide residue in food or feed obtained from plants and animals. |
| IoT | The Internet of Things (IoT) is a network of interconnected devices that connect and exchange data with other IoT devices and the cloud. |
| Herbicide-tolerant varieties (HTVs) | Herbicide-tolerant varieties are plant species that have been genetically engineered to be resistant to herbicides used on crops. |
| Chemigation | Chemigation is a method of applying pesticides to crops through an irrigation system. |
| Crop Protection | Crop protection is a method of protecting crop yields from different pests, including insects, weeds, plant diseases, and others that cause damage to agricultural crops. |
| Seed Treatment | Seed treatment helps to disinfect seeds or seedlings from seed-borne or soil-borne pests. Crop protection chemicals, such as fungicides, insecticides, or nematicides, are commonly used for seed treatment. |
| Fumigation | Fumigation is the application of crop protection chemicals in gaseous form to control pests. |
| Bait | A bait is a food or other material used to lure a pest and kill it through various methods, including poisoning. |
| Contact Fungicide | Contact pesticides prevent crop contamination and combat fungal pathogens. They act on pests (fungi) only when they come in contact with the pests. |
| Systemic Fungicide | A systemic fungicide is a compound taken up by a plant and then translocated within the plant, thus protecting the plant from attack by pathogens. |
| Mass Drug Administration (MDA) | Mass drug administration is the strategy to control or eliminate many neglected tropical diseases. |
| Mollusks | Mollusks are pests that feed on crops, causing crop damage and yield loss. Mollusks include octopi, squid, snails, and slugs. |
| Pre-emergence Herbicide | Preemergence herbicides are a form of chemical weed control that prevents germinated weed seedlings from becoming established. |
| Post-emergence Herbicide | Postemergence herbicides are applied to the agricultural field to control weeds after emergence (germination) of seeds or seedlings. |
| Active Ingredients | Active ingredients are the chemicals in pesticide products that kill, control, or repel pests. |
| United States Department of Agriculture (USDA) | The Department of Agriculture provides leadership on food, agriculture, natural resources, and related issues. |
| Weed Science Society of America (WSSA) | The WSSA, a non-profit professional society, promotes research, education, and extension outreach activities related to weeds. |
| Suspension concentrate | Suspension concentrate (SC) is one of the formulations of crop protection chemicals with solid active ingredients dispersed in water. |
| Wettable powder | A wettable powder (WP) is a powder formulation that forms a suspension when mixed with water prior to spraying. |
| Emulsifiable concentrate | Emulsifiable concentrate (EC) is a concentrated liquid formulation of pesticide that needs to be diluted with water to create a spray solution. |
| Plant-parasitic nematodes | Parasitic Nematodes feed on the roots of crops, causing damage to the roots. These damages allow for easy plant infestation by soil-borne pathogens, which results in crop or yield loss. |
| Australian Weeds Strategy (AWS) | The Australian Weeds Strategy, owned by the Environment and Invasives Committee, provides national guidance on weed management. |
| Weed Science Society of Japan (WSSJ) | WSSJ aims to contribute to the prevention of weed damage and the utilization of weed value by providing the chance for research presentation and information exchange. |


Research Methodology
Mordor Intelligence follows a four-step methodology in all our reports.
- Step-1: Identify Key Variables: In order to build a robust forecasting methodology, the variables and factors identified in Step-1 are tested against available historical market numbers. Through an iterative process, the variables required for market forecast are set and the model is built on the basis of these variables.
- Step-2: Build a Market Model: Market-size estimations for the forecast years are in nominal terms. Inflation is not a part of the pricing, and the average selling price (ASP) is kept constant throughout the forecast period.
- Step-3: Validate and Finalize: In this important step, all market numbers, variables and analyst calls are validated through an extensive network of primary research experts from the market studied. The respondents are selected across levels and functions to generate a holistic picture of the market studied.
- Step-4: Research Outputs: Syndicated Reports, Custom Consulting Assignments, Databases & Subscription Platforms


