Market Overview
| Study Period | 2020 - 2031 |
|---|---|
| Forecast Data Period | 2026 - 2031 |
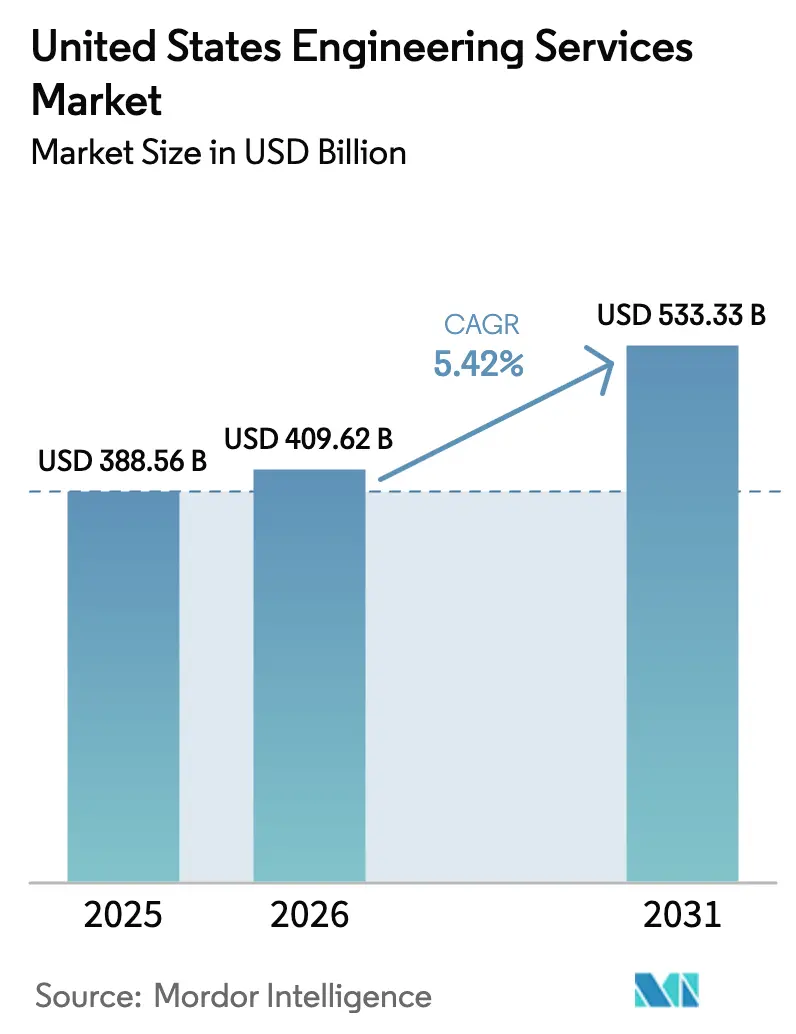
| Base Year Market Size (2025) | USD 388.56 Billion |
| Market Size (2026) | USD 409.62 Billion |
| Market Size (2031) | USD 533.33 Billion |
| Growth Rate (2026 - 2031) | 5.42% CAGR |
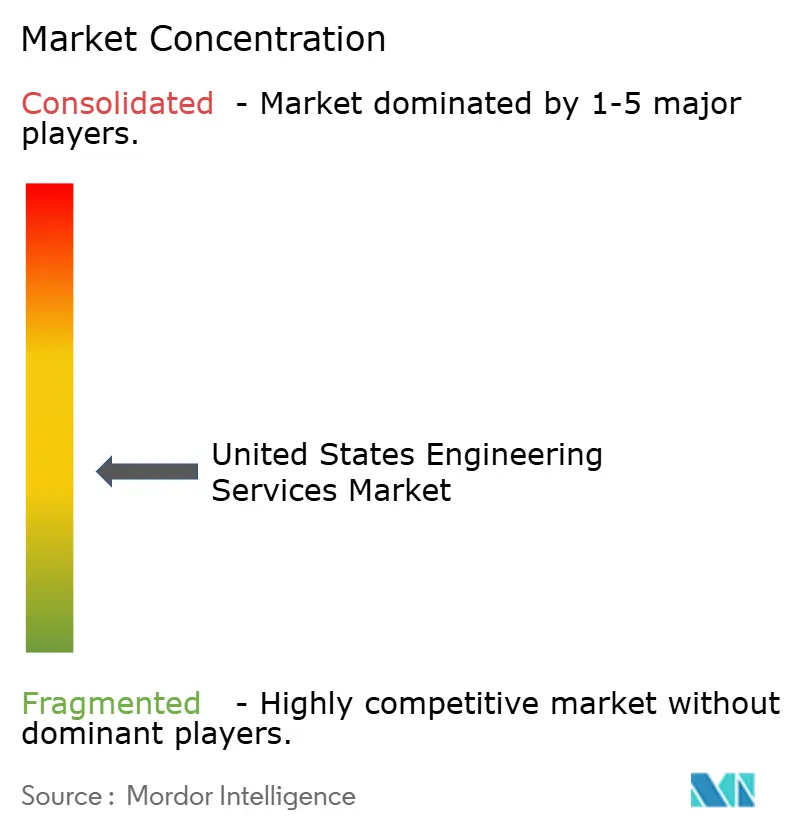
| Market Concentration | Medium |
Major Players*Disclaimer: Major Players sorted in no particular order Image © Mordor Intelligence. Reuse requires attribution under CC BY 4.0. | |
United States Engineering Services Market Analysis by Mordor Intelligence
The United States engineering services market size was valued at USD 387.42 billion in 2025 and estimated to grow from USD 409.62 billion in 2026 to reach USD 533.33 billion by 2031, at a CAGR of 5.42% during the forecast period 2026-2031. The upswing is anchored in federal funding for transportation and broadband projects, domestic semiconductor and battery gigafactory build-outs, and the rapid diffusion of digital engineering workflows that lower rework ratios. These factors are converging with heightened demand for climate-resilient infrastructure, stricter state energy codes, and a record backlog of renewable interconnection studies. Mid-tier specialists are thriving by targeting seismic retrofits, cleanroom layouts, and cybersecurity-hardened control systems, while large firms scale program-management offerings to capture multi-billion-dollar federal contracts. Skilled-labour shortages are inflating wage bills, yet firms that automate code-compliance checks and clash detection are defending margins. Over the outlook period, the United States engineering services market will keep expanding at a steady mid-single-digit pace, conditional on the industry’s ability to recruit talent, navigate protracted environmental reviews, and embed AI-enabled digital twins that compress delivery schedules.
Key Report Takeaways
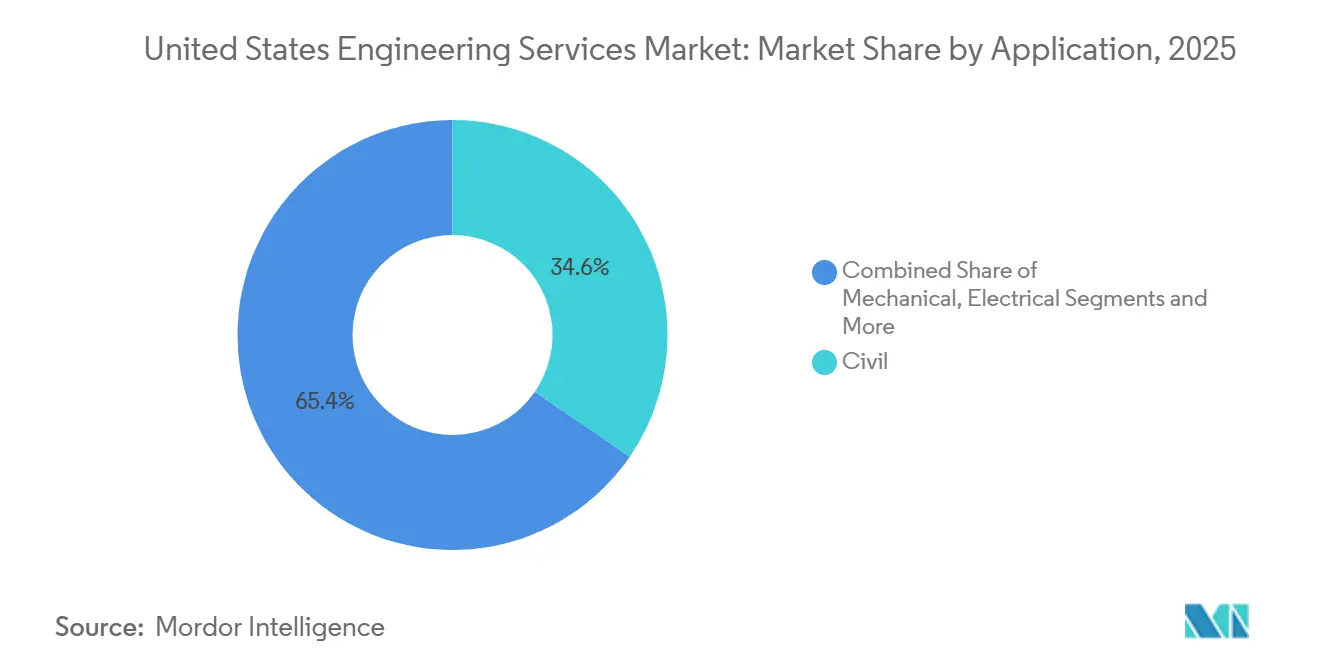
- By application, civil engineering led with 34.59% of the United States engineering services market share in 2025, while software and systems engineering is advancing at a 5.89% CAGR through 2031.
- By service type, consulting and design accounted for 38.11% of the United States engineering services market size in 2025, and automation and digital engineering are projected to expand at a 5.67% CAGR to 2031.
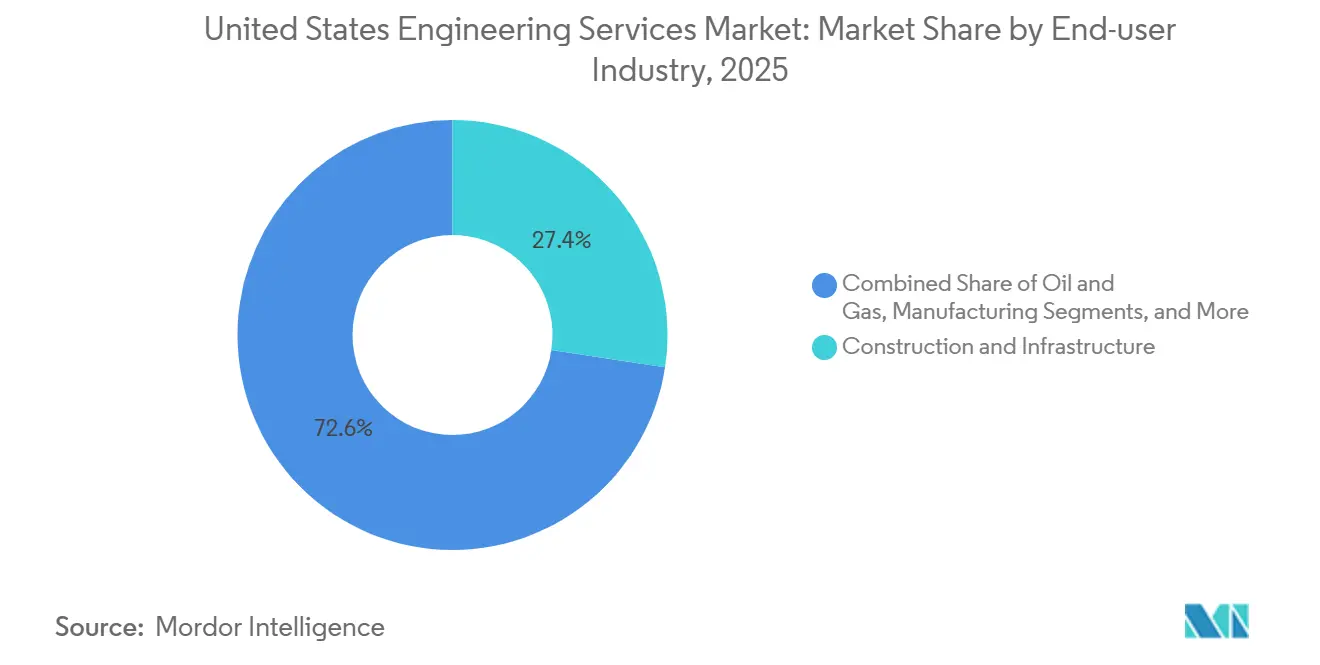
- By end-user industry, construction and infrastructure represented 27.39% of 2025 spending, whereas renewable energy projects are forecast to post a 6.21% CAGR over 2026-2031.
- By engagement model, outsourced EPCM captured a 53.73% share in 2025, and public-private partnership frameworks are on track to grow at a 6.49% CAGR through 2031.
Note: Market size and forecast figures in this report are generated using Mordor Intelligence’s proprietary estimation framework, updated with the latest available data and insights as of 2026.
United States Engineering Services Market Trends and Insights
Drivers Impact Analysis*
| Driver | (~) % Impact on CAGR Forecast | Geographic Relevance | Impact Timeline |
|---|---|---|---|
| Federal Infrastructure Funding under IIJA | +1.20% | National, with early gains in Northeast and Midwest for bridge and transit projects | Medium term (2-4 years) |
| Accelerating Semiconductor Fabs and Battery Gigafactory Construction | +0.90% | Concentrated in Arizona, Texas, Ohio, and Southeast states receiving CHIPS Act awards | Short term (≤ 2 years) |
| Near-shoring Advanced Manufacturing Lines | +0.60% | Midwest and South, particularly automotive and electronics clusters | Medium term (2-4 years) |
| Record Utility-Scale Renewable Interconnection Backlog | +0.80% | West and South, driven by solar and wind project queues | Long term (≥ 4 years) |
| Defense Modernization Programs Requiring Specialized Engineering | +0.50% | National, with concentrations near DoD installations and aerospace hubs | Long term (≥ 4 years) |
| AI-Enabled Digital Twin Adoption Reducing Re-work | +0.70% | National, led by large-scale infrastructure and industrial projects | Short term (≤ 2 years) |
| Climate-Resilience Retrofits of Aging Infrastructure | +0.40% | Coastal states and flood-prone regions in South and Northeast | Medium term (2-4 years) |
| Stricter Building Energy Codes Driving MEP Redesigns | +0.50% | California, New York, Washington, and other states with aggressive decarbonization targets | Medium term (2-4 years) |
| Source: Mordor Intelligence | |||
Federal Infrastructure Funding Under IIJA
The Infrastructure Investment and Jobs Act unlocked USD 550 billion in fresh allocations through 2026, including USD 110 billion for roads and bridges, USD 66 billion for rail, and USD 65 billion for broadband.[1]U.S. Department of Transportation, “President Biden Announces Historic Infrastructure Investment,” transportation.gov Design firms are securing front-end planning and construction-management fees as states move stalwart projects like the Brent Spence Bridge replacement and the Gateway Tunnel into procurement. Buy-America clauses are stretching design schedules by up to a year as engineers validate domestic steel and cement supply chains, expanding billable coordination hours. Joint ventures between small and large EPCMs are proliferating to meet bonding thresholds, fragmenting fee pools yet widening participation. Over the medium term, consistent appropriations and streamlined grant disbursement will keep civil and structural backlogs robust.
Accelerating Semiconductor Fabs and Battery Gigafactory Construction
The CHIPS and Science Act’s USD 52.7 billion incentive package has catalysed 23 announced fabs between 2024 and 2026.[2]U.S. Department of Commerce, “CHIPS for America Announces Preliminary Terms,” commerce.gov Each facility demands vibration-isolated foundations, ultra-pure water loops, and process exhaust systems, enlarging the addressable scope for mechanical, electrical, and chemical engineers. Battery gigafactories in Georgia, Tennessee, and Michigan are likewise driving cleanroom and high-voltage substation design mandates. Firms are deploying modular templates that standardize tool hook-ups, yet site-specific seismic and environmental constraints preserve the need for bespoke engineering, sustaining premium fee rates.
AI-Enabled Digital Twin Adoption Reducing Re-work
Digital twin platforms blending Building Information Modelling with live sensor feeds are cutting field rework by 15-25% on pilot projects.[3]U.S. Army Corps of Engineers, “Digital Twin Technology Reduces Rework,” usace.army.mil The technology flags design clashes, optimizes sequencing, and simulates performance before commissioning, shortening delivery timelines and lowering lifecycle costs. Firms offering integrated digital twins command fee premiums near 10-15%, though the upfront outlay for licenses, cloud storage, and data-science talent limits adoption to practices surpassing USD 100 million in annual revenue. Smaller firms rely on white-label tools, but interoperability gaps with legacy CAD restrict usage to greenfield builds.
Record Utility-Scale Renewable Interconnection Backlog
As of December 2025, 2,600 gigawatts of solar, wind, and storage awaited grid interconnection, triple the 2020 tally. Engineering practices are busy with power-flow studies, substation upgrades, and transmission layouts, yet three-to-five-year utility review cycles defer many projects’ notice-to-proceed dates. FERC Order 2023 aims to streamline cluster studies, but uneven regional implementation means power-system specialists enjoy 20-30% annual revenue growth while civil scopes tied to actual construction remain lumpy. Through 2031, clearing the queue will open a long runway for grid-focused engineering demand.
Restraints Impact Analysis*
| Restraint | (~) % Impact on CAGR Forecast | Geographic Relevance | Impact Timeline |
|---|---|---|---|
| Volatile Steel and Concrete Input-Cost Pass-Through Risk | -0.30% | National, with acute exposure in Midwest and South industrial projects | Short term (≤ 2 years) |
| Lengthy NEPA and State Environmental Reviews | -0.60% | National, particularly for projects crossing federal lands or requiring Army Corps permits | Long term (≥ 4 years) |
| Persistent Skilled-Labor Shortages Inflating Billing Rates | -0.80% | National, with severe constraints in coastal metros and energy hubs | Medium term (2-4 years) |
| State-by-State Engineering Licensing Variances | -0.20% | National, complicating multi-state project staffing | Long term (≥ 4 years) |
| Rising Professional Liability Insurance Premiums | -0.40% | National, with steeper increases for firms serving high-risk sectors like oil and gas | Medium term (2-4 years) |
| Source: Mordor Intelligence | |||
Persistent Skilled-Labor Shortages Inflating Billing Rates
Forty percent of licensed engineers are over 55, and ABET enrolments fell 3% annually from 2022-2025. Firms are raising entry-level pay by 8-12% a year, compressing margins on fixed-price contracts. Outsourcing low-complexity drafting to India and the Philippines offsets only a portion of labour pressure, as U.S.-based professional seals remain mandatory. Automation tools that autogenerate code-compliant layouts promise relief, yet most regulators accept them only for warehousing and light-industrial typologies, limiting near-term impact.
Lengthy NEPA and State Environmental Reviews
Full environmental impact statements averaged 4.5 years between 2020-2024, and combined federal-state reviews can extend timelines to eight years on large infrastructure jobs. Engineering firms finance design hours for the entire interval, tying up working capital and exposing them to scope creep when mitigation dictates redesign. The Fiscal Responsibility Act of 2023 imposed a two-year cap for certain projects, but agency staffing gaps and litigation risks hinder compliance. Embedding environmental specialists early adds foresight but front-loads cost, lowering returns on projects that later stall.
*Our forecasts treat driver/restraint impacts as directional, not additive. The impact forecasts reflect baseline growth, mix effects, and variable interactions.
Segment Analysis
By Application: Civil Engineering Anchors the Infrastructure Renaissance
Civil engineering accounted for 34.59% of the United States engineering services market size in 2025, fuelled by bridge rehabilitation, highway widening, and storm-water upgrades funded under the IIJA. Software and systems engineering is on track for a 5.89% CAGR through 2031 as utilities modernize distribution grids and manufacturers retrofit plants with industrial IoT platforms. Mechanical engineering demand is climbing in parallel with data-center liquid-cooling designs handling 50 kW rack densities, while electrical engineering scopes are expanding with phasor measurement units and automated feeder switches that underpin grid reliability. Environmental engineering continues to capture mandates for PFAS remediation and wetland mitigation, whereas structural specialists gain from seismic-retrofit rules on the West Coast.
The preference for software and systems solutions mirrors owner concern over operational-technology cyber threats, especially across critical infrastructure. Contracts now bundle software coding with OT hardening, creating steady retainer revenue for firms versed in zero-trust architectures. Civil engineering will stay dominant until at least 2028 while IIJA allocations flow, yet growth could taper without fresh congressional surface-transport authorizations at elevated levels. Overall, application diversity cushions the United States engineering services market from cyclical swings in any single discipline.


By Service Type: Consulting and Design Dominate as Digital Maturity Accelerates
Consulting and design services captured 38.11% of the 2025 United States engineering services market share as owners required detailed front-end packages to pin down scope and cost before mobilizing capital. Automation and digital engineering is projected to post a 5.67% CAGR through 2031, reflecting BIM Level 2 mandates and digital-twin adoption that compress commissioning cycles. Process and plant engineering rides the semiconductor and battery-plant wave, demanding piping and instrumentation diagrams and hazardous-area classifications ahead of equipment orders. Product engineering remains concentrated within aerospace and defense, where finite-element and thermal modelling validate designs prior to fabrication.
Asset-management scopes are rising as aging bridges and substations need condition assessments and lifecycle modelling. Construction-management demand stays steady, with owners choosing between construction-manager-at-risk and design-build depending on complexity. The United States engineering services market size tied to automation services will advance as clash-detection and 4D scheduling tools become mainstream, reducing the waste that the Associated General Contractors of America pegs at 5-10% of construction budgets. Firms embedding such tools within fixed-fee proposals effectively monetize technology previously borne by owners, sustaining margin resilience.
By End-User Industry: Construction Anchors, Renewables Surge
Construction and infrastructure clients represented 27.39% of the 2025 United States engineering services market size, buoyed by public funds for roads, water mains, and transit expansions. Renewable energy projects are the fastest-growing end-user, expected to climb at a 6.21% CAGR through 2031 on the back of Inflation Reduction Act tax credits and corporate clean-power procurements. Oil and gas remains stable as LNG export terminals and carbon-capture retrofits proceed, while manufacturing spend is growing with near-shored vehicle and electronics lines in the Midwest and South. Utilities are commissioning grid-hardening and water-treatment expansions, and data-center operators drive electrical and mechanical design for 100-MW hyperscale campuses serving AI workloads.
Transportation entities airports, ports, rail continue modernizing terminals to absorb freight growth, and healthcare systems invest in seismic retrofits and emergency-department expansions to maintain accreditation. Defense and aerospace customers procure specialized engineering for hypersonic test ranges and satellite ground stations. The United States engineering services market benefits from renewable energy’s rise, as integrated civil-electrical-environmental packages carry higher fee intensity than traditional segmented scopes.
By Engagement Model: Outsourced EPCM Prevails, PPPs Expand
Outsourced EPCM captured 53.73% of the 2025 United States engineering services market share as owners transferred design and construction risk via lumpsum or GMP contracts. Public-private partnership frameworks are poised for a 6.49% CAGR across 2026-2031, allowing states to modernize toll roads, ports, and parking structures without enlarging debt loads. In-house engineering teams are declining, with owners retaining only project controls while outsourcing detail design and field engineering.
The dominance of EPCM is acute in process-intensive industries such as semiconductors, where single-point accountability is invaluable. PPP growth is concentrated in states with enabling legislation granting private operators 30-50-year concessions; engineering firms capture both upfront design fees and recurring asset-management revenue. The United States engineering services market size attached to PPPs will expand as municipalities confront deferred-maintenance backlogs and limited bonding capacity. Firms that master concession modelling and risk allocation will gain a structural advantage over design-only competitors.
Geography Analysis
The South generated the largest share of United States engineering services market revenue in 2025, propelled by population influx, highway widenings, and LNG and semiconductor investments in Texas, Florida, and the Carolinas. Texas alone represented nearly 15% of national billings thanks to LNG terminal expansions, CHIPS Act-funded fabs in Austin and Dallas, and state-financed road capacity boosts. The West is the fastest-growing region through 2031, led by utility-scale solar and battery-storage projects in California, Arizona, and Nevada alongside seismic-retrofit mandates for bridges and buildings. The Northeast benefits from Amtrak’s Gateway Tunnel and broader Northeast Corridor upgrades, while the Midwest gains from Great Lakes port improvements and electric-vehicle battery-plant construction in Ohio and Michigan.
Regional divergence stems from differing funding mechanisms, regulatory climates, and industrial compositions. The South leverages toll-road financing and PPPs, shortening project cycles compared with the bond-dependent Northeast, where union labour agreements lengthen timelines. The West’s aggressive renewable portfolio standards create a steady pipeline of interconnection studies and transmission upgrades, whereas the Midwest’s manufacturing resurgence drives demand for industrial facility engineering. Firms responding with localized offices and state-specific licensing agility gain market access; top practices maintain 20-30 offices nationwide to serve distributed clients.
Climate resilience is a rising differentiator. Coastal states in the South and Northeast commission flood-control structures, pump stations, and elevation projects to meet updated FEMA maps. Western states invest in wildfire-resilient transmission line designs and water-supply diversification to address drought. These location-specific needs fragment the United States engineering services market, rewarding firms that cultivate specialized knowledge in flood, drought, and wildfire adaptation alongside environmental permitting expertise.
Competitive Landscape
The United States engineering services market is moderately fragmented, with the ten largest firms holding roughly 35% of revenue and hundreds of regional specialists sharing the rest. Large publicly traded companies such as AECOM, Jacobs, and Fluor compete on global delivery networks, integrated financing, and long-standing federal and Fortune 500 relationships. Mid-tier firms like HDR, Burns and McDonnell, and Tetra Tech excel in water resources, power generation, or environmental remediation, earning higher margins on niche scopes where client switching costs are elevated. Smaller practices leverage local client intimacy and lower overhead to win municipal and state transportation work where incumbency advantages are muted.
Strategic activity centers on acquiring digital-engineering know-how, entering high-growth verticals such as data centers and renewables, and forming joint ventures to pursue mega-scale EPCM and PPP mandates. AECOM’s 2024 purchase of a digital-twin software house illustrates the push to embed proprietary technology and secure recurring software revenue. White-space opportunities are emerging in operational-technology cybersecurity, coastal climate adaptation, and modular construction engineering that cuts onsite labour. Disruptive software vendors offering AI-driven code-checking and generative design threaten to commoditize routine tasks, compelling incumbents to migrate toward advisory, program-management, and asset-management services that hinge on human judgment.
Talent scarcity remains a competitive fault line. Firms with structured graduate pipelines, mentorship programs, and remote-work flexibility are outpacing peers on retention. Hourly billing rates for licensed engineers rose 8-12% in 2025, pressuring margin-thin operators that lack automation. Meanwhile, escalating professional-liability premiums for high-risk sectors like LNG and petrochemicals encourage scale, favouring nationwide firms that can spread premiums across diversified portfolios.
United States Engineering Services Industry Leaders
AECOM
Jacobs Engineering Group
Bechtel Corporation
Fluor Corporation
KBR Inc.
- *Disclaimer: Major Players sorted in no particular order

Recent Industry Developments
- January 2026: AECOM secured a USD 1.2 billion U.S. Army Corps of Engineers contract for Mississippi River Basin flood-risk management program-management and engineering services.
- December 2025: Jacobs acquired a data-center engineering specialist for USD 450 million, adding 600 MEP engineers focused on hyperscale campuses.
- November 2025: Bechtel won a USD 2.8 billion EPCM mandate to design and oversee a 300 mm wafer fab in Arizona, with completion slated for 2028.
- October 2025: Burns and McDonnell completed a USD 1.5 billion 1,000-MW battery-energy-storage facility in Texas.


United States Engineering Services Market Report Scope
The United States Engineering Services Market Report is Segmented by Application (Civil, Mechanical, Electrical, Environmental, Chemical, Structural, Software and Systems), Service Type (Consulting and Design, Process and Plant Engineering, Product Engineering and Prototyping, Automation and Digital Engineering, Asset Management and O&M, Construction Management), End-user Industry (Construction and Infrastructure, Oil and Gas, Manufacturing, Utilities, Transportation, Telecommunications and Data Centers, Healthcare Facilities, Defense and Aerospace, Renewable Energy Projects), Engagement Model (In-house, Outsourced EPCM, Public-Private Partnership Frameworks), and Geography (Northeast, Midwest, South, West). The Market Forecasts are Provided in Terms of Value (USD).
By Application
| Civil |
| Mechanical |
| Electrical |
| Environmental |
| Chemical |
| Structural |
| Software and Systems |
By Service Type
| Consulting and Design |
| Process and Plant Engineering |
| Product Engineering and Prototyping |
| Automation and Digital Engineering |
| Asset Management and O&M |
| Construction Management |
By End-user Industry
| Construction and Infrastructure |
| Oil and Gas |
| Manufacturing |
| Utilities (Power, Water) |
| Transportation (Rail, Airports, Ports) |
| Telecommunications and Data Centers |
| Healthcare Facilities |
| Defense and Aerospace |
| Renewable Energy Projects |
By Engagement Model
| In-house |
| Outsourced, EPCM |
| Public-Private Partnership (PPP) Frameworks |
By Geography
| Northeast |
| Midwest |
| South |
| West |
| By Application | Civil |
| Mechanical | |
| Electrical | |
| Environmental | |
| Chemical | |
| Structural | |
| Software and Systems | |
| By Service Type | Consulting and Design |
| Process and Plant Engineering | |
| Product Engineering and Prototyping | |
| Automation and Digital Engineering | |
| Asset Management and O&M | |
| Construction Management | |
| By End-user Industry | Construction and Infrastructure |
| Oil and Gas | |
| Manufacturing | |
| Utilities (Power, Water) | |
| Transportation (Rail, Airports, Ports) | |
| Telecommunications and Data Centers | |
| Healthcare Facilities | |
| Defense and Aerospace | |
| Renewable Energy Projects | |
| By Engagement Model | In-house |
| Outsourced, EPCM | |
| Public-Private Partnership (PPP) Frameworks | |
| By Geography | Northeast |
| Midwest | |
| South | |
| West |


Key Questions Answered in the Report
What is the current valuation of the United States engineering services market?
It was valued at USD 387.42 billion in 2025 and is projected to reach USD 533.33 billion by 2031.
Which segment is growing fastest within U.S. engineering services?
Software and systems engineering is forecast to post the highest CAGR at 5.89% over 2026-2031.
How large is the opportunity for public-private partnerships?
PPP frameworks are expected to grow at a 6.49% CAGR, capturing greater share as states leverage private capital for toll-road and port upgrades.
Why are digital twins important for engineering firms?
Digital twin adoption cuts field rework by up to 25%, shortens delivery timelines, and enables firms to command 10-15% fee premiums.
Which region is expanding most rapidly?
The West is the fastest-growing region, driven by large-scale solar, storage, and seismic-retrofit spending.
How severe is the engineering talent shortage?
Forty percent of licensed engineers are over 55 and university enrollments are falling, causing salary growth of 8-12% annually and squeezing margins.
Page last updated on:


