Urothelial Cancer Drugs Market Size and Share
Market Overview
| Study Period | 2020 - 2031 |
|---|---|
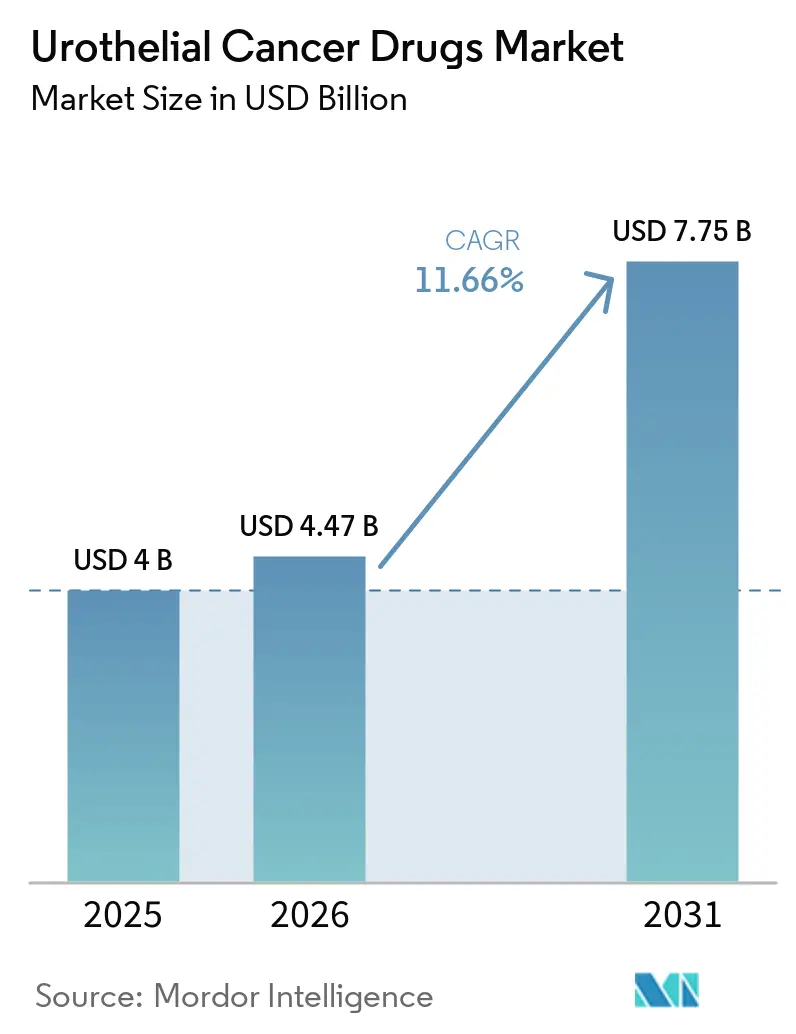
| Market Size (2026) | USD 4.47 Billion |
| Market Size (2031) | USD 7.75 Billion |
| Growth Rate (2026 - 2031) | 11.66% CAGR |
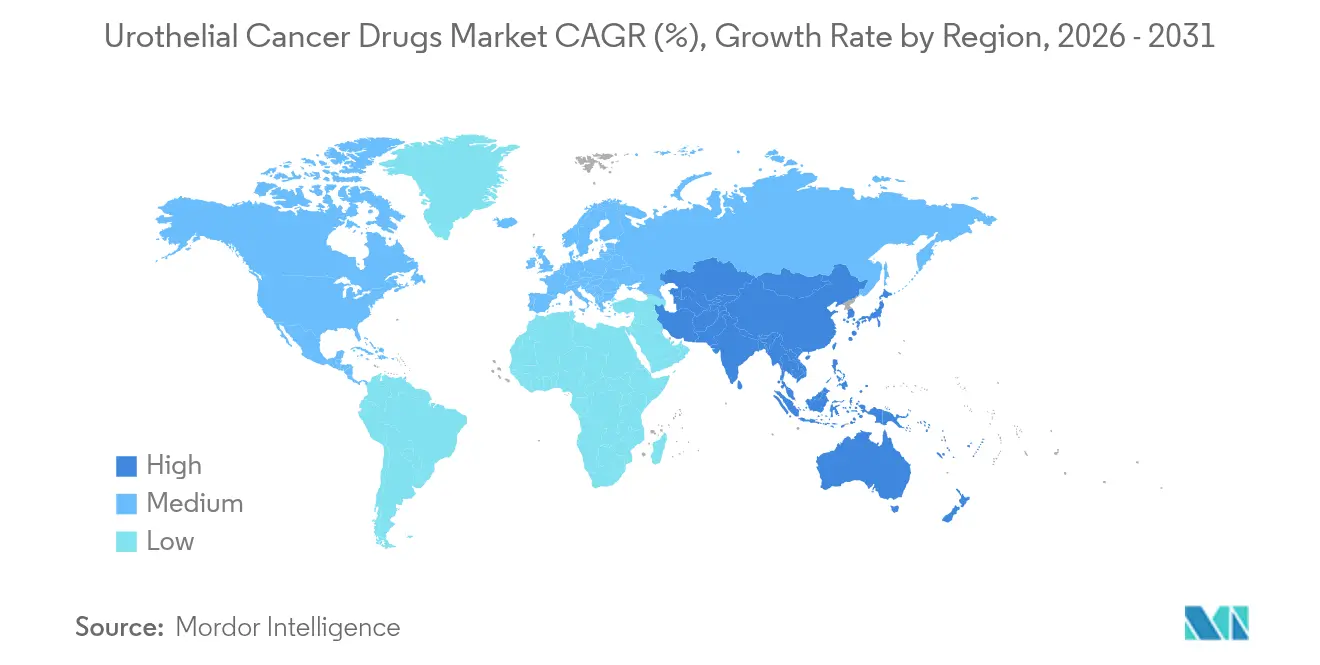
| Fastest Growing Market | Asia Pacific |
| Largest Market | North America |
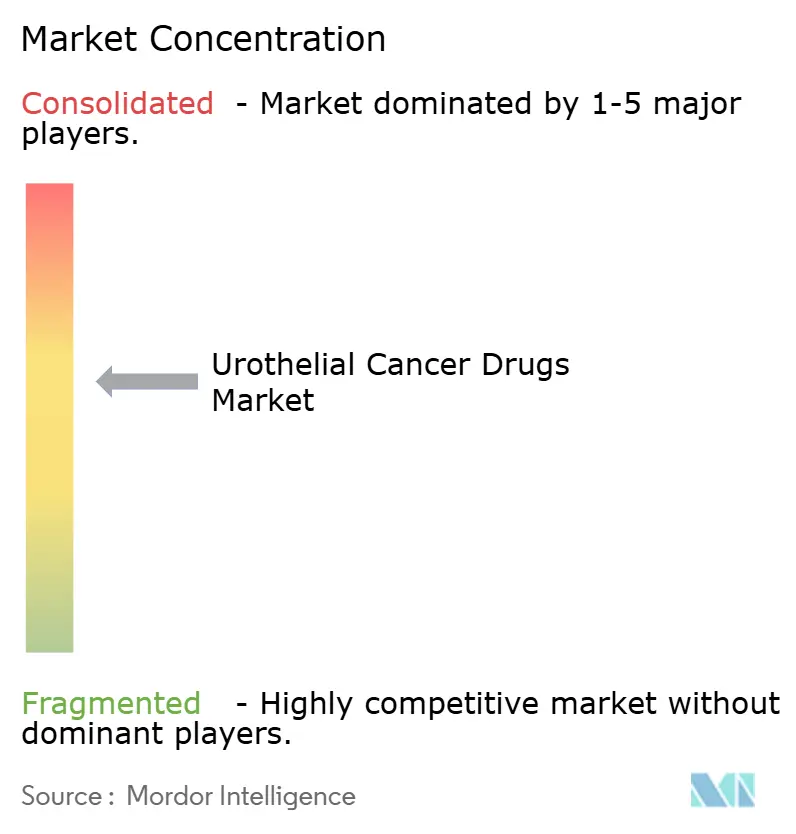
| Market Concentration | Medium |
Major Players *Disclaimer: Major Players sorted in no particular order Image © Mordor Intelligence. Reuse requires attribution under CC BY 4.0. | |
Urothelial Cancer Drugs Market Analysis by Mordor Intelligence
urothelial cancer drugs market size in 2026 is estimated at USD 4.47 billion, growing from 2025 value of USD 4.00 billion with 2031 projections showing USD 7.75 billion, growing at 11.66% CAGR over 2026-2031. Escalating disease incidence, rapid uptake of immuno-oncology agents, and regulatory fast-tracking of antibody-drug conjugates (ADCs) are synchronizing to propel growth, while sustained investment in precision medicine is widening the patient base eligible for targeted treatment. Combination regimens that marry ADCs with checkpoint inhibitors are redefining first-line standards, even as biomarker-guided protocols improve therapeutic accuracy and extend survival outcomes. North America retains primacy through early technology adoption and generous reimbursement, whereas Asia-Pacific’s vigorous screening initiatives and expanding oncology infrastructure drive the fastest regional gains. Persistent bacille Calmette-Guérin (BCG) shortages amplify opportunities for next-generation intravesical agents and gene therapies, yet simultaneously reveal supply-chain vulnerabilities that stakeholders must address.
Key Report Takeaways
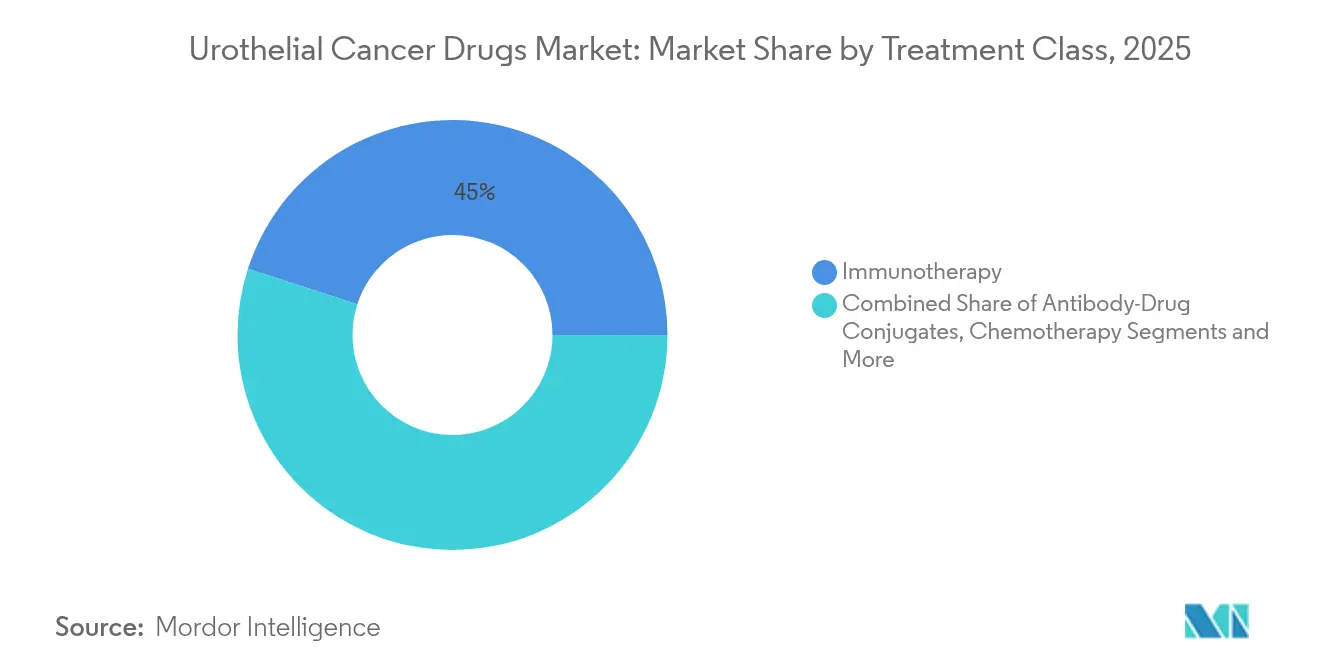
- By treatment class, immunotherapy led with 45.02% of urothelial cancer drugs market share in 2025; ADCs are advancing at an 18.21% CAGR to 2031.
- By line of therapy, first-line options controlled 56.01% share of the urothelial cancer drugs market size in 2025, while maintenance/consolidation care is projected to rise at a 12.66% CAGR through 2031.
- By cancer stage, non-muscle invasive bladder cancer held 47.21% share in 2025; metastatic disease is climbing at a 13.62% CAGR over the same horizon.
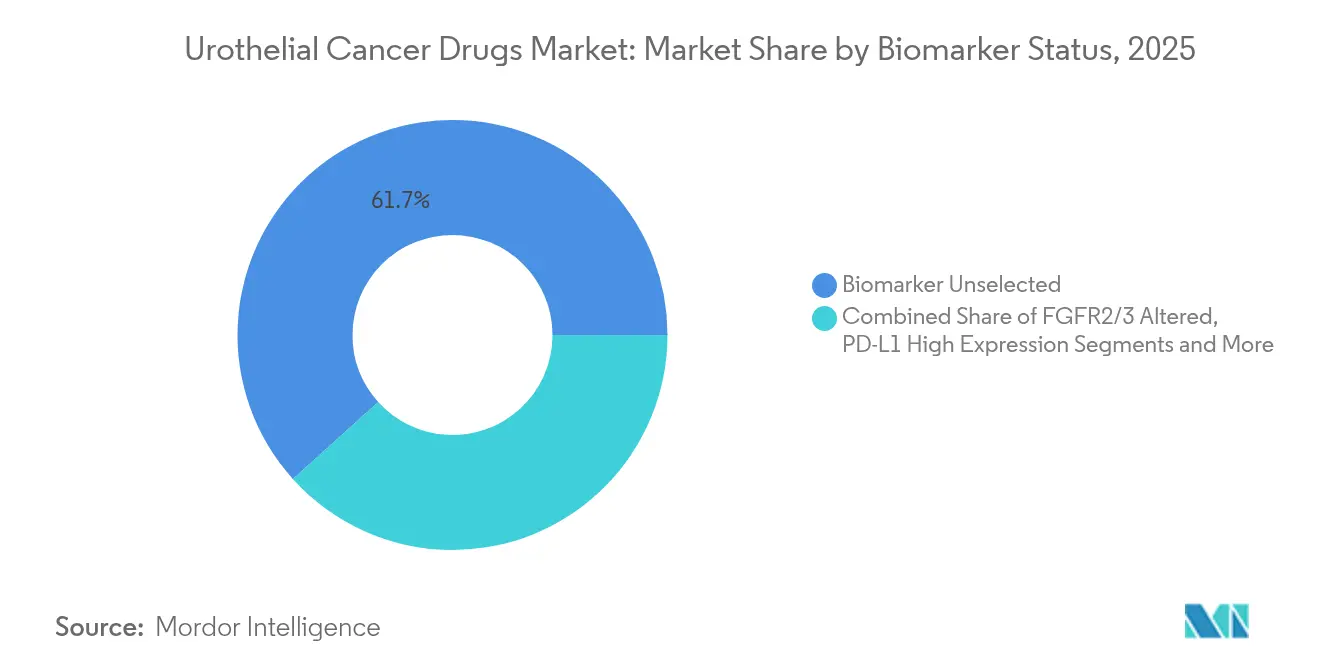
- By biomarker status, the unselected cohort occupied 61.68% of 2025 revenues; FGFR2/3-altered patients constitute the fastest-growing niche at 19.12% CAGR.
- By distribution channel, hospital pharmacies accounted for 67.44% share in 2025, whereas online pharmacies are scaling at an 17.98% CAGR to 2031.
- By geography, North America commanded 42.88% share in 2025, and Asia-Pacific is on track for a 12.11% CAGR through 2031.
Note: Market size and forecast figures in this report are generated using Mordor Intelligence’s proprietary estimation framework, updated with the latest available data and insights as of 2026.
Global Urothelial Cancer Drugs Market Trends and Insights
Drivers Impact Analysis*
| Driver | (~) % Impact on CAGR Forecast | Geographic Relevance | Impact Timeline |
|---|---|---|---|
| Rising Incidence Of Urothelial Cancer Cases Globally | +2.5% | Global, with highest impact in North America & Europe | Long term (≥ 4 years) |
| Uptake Of Immune-Checkpoint Inhibitors As First-Line Standard | +1.8% | North America & EU leading, expanding to APAC | Medium term (2-4 years) |
| Regulatory Fast-Tracking Of Antibody–Drug Conjugates (ADCs) | +1.2% | Global, with early gains in US, EU following | Short term (≤ 2 years) |
| Large Pharma Partnering Boosts Launch Velocity Of FGFR Inhibitors | +0.9% | Global, concentrated in developed markets initially | Medium term (2-4 years) |
| AI-Based Urine Biomarker Diagnostics Expanding Treatable Pool | +0.7% | North America & EU core, spill-over to APAC | Long term (≥ 4 years) |
| Medicare & Private-Payer Reimbursement Expansions For ADC + IO Combos | +0.6% | North America primarily, selective EU markets | Short term (≤ 2 years) |
| Source: Mordor Intelligence | |||
Rising Incidence Of Urothelial Cancer Cases Globally
Global bladder cancer diagnoses continue to climb, ranking among the top six malignancies in high-income nations and accelerating in emerging economies. Environmental carcinogens, aging demographics, and wider access to cystoscopic screening enlarge the addressable pool of candidates for novel therapeutics. Younger patient cohorts in Asia-Pacific increasingly present with aggressive disease phenotypes that demand prolonged, combination treatment regimens. Recognition of upper-tract urothelial carcinomas as a distinct clinical entity is spawning new therapeutic segments requiring tailored approaches. Health-system investment in dedicated uro-oncology centers streamlines diagnosis-to-treatment intervals and enlarges total market demand. The net effect is a durable rise in eligible patients, directly expanding revenue potential for stakeholders.
Uptake Of Immune-Checkpoint Inhibitors As First-Line Standard
Checkpoint inhibitors such as pembrolizumab and durvalumab secured broad first-line approvals across multiple disease stages in 2024, displacing cisplatin-based chemotherapy for eligible populations[1]Neil M. Iyengar, “Assessing 2024 Oncology Advances and Looking Ahead,” Cancer Network, cancernetwork.com. Durvalumab’s NIAGARA study confirmed overall survival gains, catalyzing guideline revisions and payer acceptance. Combination protocols—most prominently enfortumab vedotin plus pembrolizumab—are redefining best practice and intensifying revenue streams. Evolving biomarker algorithms exploiting PD-L1 expression and tumor mutational burden refine patient selection, thus elevating response rates. Subcutaneous formulations offer logistical convenience, supporting diffusion into community settings. Collectively these factors fortify the urothelial cancer drugs market’s trajectory.
Regulatory Fast-Tracking Of Antibody–Drug Conjugates (ADCs)
U.S. and European regulators are expediting reviews of ADCs under breakthrough and accelerated pathways, compressing development timelines from decade-long arcs to three-to-five-year horizons[2]“Pfizer Advances Bold Vision for Future of Cancer Care at the ASCO 2025 Annual Meeting,” Pfizer, pfizer.com. Companion diagnostic approvals in parallel further smooth commercialization routes. Venture and institutional capital flows have intensified toward next-generation conjugates targeting Nectin-4, Trop-2, and emerging antigens, broadening the competitive field. Global regulatory convergence facilitates synchronized multi-region launches, magnifying first-mover advantages. Successful ADC precedents in urothelial cancer also influence other solid-tumor pipelines, reinforcing platform value for innovative biotech firms.
Large Pharma Partnering Boosts Launch Velocity Of FGFR Inhibitors
Collaborations marrying biotech discovery platforms with big-pharma scale shorten time-to-market for FGFR-directed agents like erdafitinib. Co-development agreements provide resources for pivotal trials, companion diagnostics, and post-approval studies, mitigating risk while maximizing reach. Shared commercialization rights accelerate global penetration, particularly in markets requiring substantial field force presence. Cross-licensing fosters therapeutically complementary portfolios, creating optionality for combination regimens and next-line sequencing. These synergies collectively enhance adoption speed, reinforcing the urothelial cancer drugs market’s expansion path.
Restraints Impact Analysis*
| Restraint | (~) % Impact on CAGR Forecast | Geographic Relevance | Impact Timeline |
|---|---|---|---|
| High Cost Of Immunotherapies & ADCs | -1.4% | Global, most severe in emerging markets | Medium term (2-4 years) |
| Immune-Related Adverse Events Curbing Long-Term Adherence | -0.8% | Global, with higher impact in elderly populations | Long term (≥ 4 years) |
| Global BCG Manufacturing Shortages Prolonging NMIBC Regimens | -0.6% | Global, acute shortages in North America & EU | Short term (≤ 2 years) |
| Limited Access To Companion-Diagnostic Testing In Emerging Markets | -0.5% | APAC, MEA, Latin America primarily | Long term (≥ 4 years) |
| Source: Mordor Intelligence | |||
High Cost Of Immunotherapies & ADCs
Annual treatment outlays for combination regimens exceed USD 200,000 per patient in developed economies, straining payer budgets and imposing strict prior-authorization hurdles. Highly specialized infusion infrastructure and intensive monitoring inflate indirect costs, while limited insurance coverage constrains uptake in emerging regions. Pharmaceutical assistance programs generate selective relief yet remain insufficient for widespread access. Value-based contracts are gaining traction, conditioning reimbursement on real-world outcomes and compelling manufacturers to document pharmacoeconomic merit. Biosimilar competition may temper pricing for early checkpoint inhibitors, but complex ADC manufacturing dampens near-term generic entry, sustaining affordability pressures.
Immune-Related Adverse Events Curbing Long-Term Adherence
Checkpoint blockade unleashes autoimmune toxicities that can necessitate discontinuation in up to 20% of treated patients, diminishing cumulative therapy exposure and revenue realization. Multi-organ involvement demands subspecialty management, elevating care complexity and cost. Pre-existing autoimmune disorders and advanced age amplify risk, narrowing the eligible population. Predictive biomarkers for adverse events remain elusive, complicating physician confidence and treatment planning. Health systems are piloting specialized management pathways, but resource-limited centers may defer adoption, restraining global diffusion of immunotherapy regimens.
*Our forecasts treat driver/restraint impacts as directional, not additive. The impact forecasts reflect baseline growth, mix effects, and variable interactions.
Segment Analysis
By Treatment Class: ADCs Drive Next-Generation Oncology
ADCs produced the fastest revenue climb, forecasting an 18.21% CAGR between 2026 and 2031 as enfortumab vedotin’s EV-302 data reset survival benchmarks in untreated metastatic disease. Immunotherapy dominated 2025 with a 45.02% slice of the urothelial cancer drugs market, led by the growing adoption of PD-1 And PD-L1 Inhibitors, although plateauing single-agent response rates continue to motivate combination approaches integrating ADC payloads for synergistic tumor kill. Platinum-based chemotherapy retains relevance for cisplatin-eligible patients, whereas gene therapy and chemohyperthermia fill intravesical niches amid persistent BCG scarcity.
Pipeline breadth ensures continued ADC momentum: next-wave conjugates seek novel antigens, optimized linkers, and enhanced drug-antibody ratios. These innovations, coupled with global regulatory support, are expected to lift the urothelial cancer drugs market size for ADCs well beyond historical norms. Pharmacies and payers will need to adapt inventory, reimbursement, and administration protocols as increasingly complex regimens become routine.


By Line of Therapy: First-Line Dominance Shifts
First-line regimens generated 56.01% of 2025 revenues, underscoring the economic significance of initial therapeutic choice. Maintenance therapy, paced by avelumab, owns momentum through a 12.66% CAGR outlook; its durability benefits resonate with both clinicians and payers seeking progression-free value.
Second-line spaces remain pivotal arenas where resistance emerges, inviting ADCs and targeted inhibitors to demonstrate superiority over traditional chemotherapies. Third-line and salvage settings, although smaller in volume, attract disruptive modalities such as oncolytic viruses that could unlock incremental share. The strategic sequencing of agents across lines is becoming an art informed by evolving real-world data, promising longer control horizons for the urothelial cancer drugs market.
By Cancer Stage: Metastatic Disease Drives Innovation
Non-muscle invasive bladder cancer dominated with 47.21% revenue in 2025 thanks to high incidence and legacy intravesical protocols. Metastatic urothelial carcinoma, however, anticipates a 13.62% CAGR to 2031 as novel systemic agents chase significant unmet need.
FDA clearances for nadofaragene firadenovec and nogapendekin alfa-inbakicept offer BCG-unresponsive patients alternative bladder-preserving options. Concurrently, perioperative immunotherapy for muscle-invasive disease, validated by durvalumab’s NIAGARA success, is revising surgery-centric paradigms. Rising complexity in stage-specific management ensures continuous diversification of the urothelial cancer drugs market.
By Biomarker Status: Precision Medicine Momentum
The biomarker-unselected cohort accounted for 61.68% of 2025 revenue, yet FGFR2/3-altered tumors headline growth with a 19.12% CAGR outlook as erdafitinib and follow-on inhibitors cement clinical benefit. PD-L1-high subsets continue to favor checkpoint blockade, whereas Nectin-4 and HER2 expressions broaden ADC eligibility.
Comprehensive genomic profiling, increasingly delivered via liquid biopsy, is lowering barriers to precision treatment in community practice. As molecular stratification becomes routine, the urothelial cancer drugs market size tied to biomarker-defined subgroups is expected to balloon, incentivizing test-treatment bundling strategies among diagnostics and pharma players.
By Distribution Channel: Specialty Care Evolution
Hospital pharmacies dispensed 67.44% of therapy volume in 2025, reflecting centralized infusion requirements for complex biologics. Yet online pharmacies exhibit an 17.98% CAGR through 2031, buoyed by home delivery of oral targeted agents and payer push for cost-efficient distribution.
Specialty clinics bridge inpatient expertise and outpatient convenience, offering coordinated care and pharmacovigilance. Digital health overlays that monitor adherence and adverse events in real-time are gaining payer endorsement, giving tech-enabled channels additional leverage in the urothelial cancer drugs market.
Geography Analysis
North America maintained 42.88% of 2025 global revenue due to robust reimbursement, dense clinical-trial infrastructure, and early adoption of breakthrough designations. U.S. market evolution is closely tied to Medicare policy updates and private payer alignment, both of which now embrace value-based contracts that reward demonstrable survival gains. Canada’s provincially funded systems negotiate collective procurement, fostering predictable uptake albeit at negotiated pricing. Cross-border treatment flows with Mexico supplement patient access, particularly in border states where oncology centers provide specialized infusion capability.
Europe presents a mature but methodical environment in which the European Medicines Agency coordinates approvals and national health-technology assessments (HTAs) adjudicate access. Germany’s DRG payment reforms, the U.K.’s Cancer Drugs Fund, and France’s ATU early-access scheme collectively accelerate entry for compelling agents, though list-price negotiations are stringent. Southern Europe faces fiscal constraints, delaying adoption but not eliminating demand; managed-entry agreements and outcomes-based rebates increasingly unlock budgetary headroom. Pan-EU collaboration on joint clinical assessment under the new Pharmaceutical Strategy promises to streamline evidence requirements, benefiting the urothelial cancer drugs market.
Asia-Pacific, registering a 12.11% CAGR, emerges as the most vibrant frontier, powered by national cancer control plans, insurance expansion, and improving diagnostic reach. China’s volume-based procurement aims to tame prices without impeding innovation, while Japan’s HTA process accelerates for oncology breakthroughs. India’s tiered private-public system is embracing oral targeted agents through patient-assistance partnerships. Australia and South Korea leverage robust registries and real-world data to fast-track reimbursement for high-value medicines. Nonetheless, rural-urban disparities, limited biomarker testing, and uneven specialist density remain headwinds to uniform uptake across the region.

Competitive Landscape
The urothelial cancer drugs market hosts a moderate concentration of power anchored by multinationals such as Merck, Roche, Bristol Myers Squibb, and AstraZeneca, each leveraging expansive immuno-oncology franchises and global commercialization muscle. These incumbents invest heavily in registrational trials that extend approved indications, thereby solidifying formulary loyalty.
Emerging biotechs—CG Oncology, UroGen Pharma, and Seagen among them—inject dynamism with differentiated modalities including oncolytic viruses, intravesical gene therapy, and high-potency ADCs. Licensing and co-development agreements between these innovators and large pharmas increasingly shape portfolio breadth while distributing risk. Artificial-intelligence–assisted drug-discovery platforms, exemplified by ConcertAI partnerships, shorten cycle times from lead optimization to IND filing, creating competitive advantage based on data analytics prowess.
Ongoing BCG manufacturing shortfalls disrupt standard NMIBC care, opening revenue corridors for alternative therapies and intensifying competition for bladder-preservation solutions. Simultaneously, the shift toward biomarker-led protocols elevates diagnostic partners as critical gatekeepers. Collectively, these forces sustain a fluid rivalry landscape, incentivizing relentless clinical innovation and commercialization agility across the urothelial cancer drugs market.
Urothelial Cancer Drugs Industry Leaders
Merck & Co. Inc.
Bristol-Myers Squibb Company
Novartis AG
F Hoffmann-La Roche AG
AstraZeneca PLC
- *Disclaimer: Major Players sorted in no particular order

Recent Industry Developments
- April 2025: UroGen Pharma reported nearly four-year duration of response for JELMYTO in low-grade upper-tract urothelial carcinoma, underscoring long-term efficacy of its intravesical chemotherapeutic.
- August 2024: Astellas Pharma won European Commission approval for PADCEV plus KEYTRUDA as platinum-eligible first-line therapy in advanced disease, accelerating ADC-IO combination availability.


Global Urothelial Cancer Drugs Market Report Scope
As per the scope of the report, urothelial carcinoma, also known as transitional cell carcinoma, is a cancerous bladder tumor that spreads to other parts of the body. The urothelium comprises the lining on the inside of the bladder, urethra, and ureters. It also consists of the renal pelvis. The Urothelial Cancer Drugs Market has been Segmented by Treatment (Chemotherapy and Immunotherapy) and Geography (North America, Europe, Asia Pacific, Middle East and Africa, and South America). The market report also covers the estimated market sizes and trends for 17 different countries across major regions globally. The report offers the value (in USD million) for the above segments.
| Chemotherapy | Platinum-based |
| Non-platinum | |
| Immunotherapy | PD-1 / PD-L1 Inhibitors |
| CTLA-4 Inhibitors | |
| Oncolytic Viruses & Vaccines | |
| Targeted Therapy | FGFR Inhibitors |
| HER2 / Nectin-4 ADCs | |
| Antibody-Drug Conjugates | Enfortumab Vedotin |
| Sacituzumab Govitecan | |
| Pipeline ADCs | |
| Intravesical Therapy | BCG |
| Gene/Viral Therapy | |
| Chemohyperthermia |
| First-line |
| Maintenance / Consolidation |
| Second-line |
| Third-line & Beyond |
| Non-Muscle Invasive Bladder Cancer (NMIBC) |
| Muscle Invasive Bladder Cancer (MIBC) |
| Metastatic Urothelial Carcinoma (mUC) |
| FGFR2/3 Altered |
| PD-L1 High Expression |
| Nectin-4 High Expression |
| HER2 Positive |
| Biomarker Unselected |
| Hospital Pharmacies |
| Specialty Clinics |
| Online Pharmacies |
| North America | United States |
| Canada | |
| Mexico | |
| Europe | Germany |
| United Kingdom | |
| France | |
| Italy | |
| Spain | |
| Rest of Europe | |
| Asia-Pacific | China |
| Japan | |
| India | |
| South Korea | |
| Australia | |
| Rest of Asia-Pacific | |
| Middle East and Africa | GCC |
| South Africa | |
| Rest of Middle East and Africa | |
| South America | Brazil |
| Argentina | |
| Rest of South America |
| By Treatment Class | Chemotherapy | Platinum-based |
| Non-platinum | ||
| Immunotherapy | PD-1 / PD-L1 Inhibitors | |
| CTLA-4 Inhibitors | ||
| Oncolytic Viruses & Vaccines | ||
| Targeted Therapy | FGFR Inhibitors | |
| HER2 / Nectin-4 ADCs | ||
| Antibody-Drug Conjugates | Enfortumab Vedotin | |
| Sacituzumab Govitecan | ||
| Pipeline ADCs | ||
| Intravesical Therapy | BCG | |
| Gene/Viral Therapy | ||
| Chemohyperthermia | ||
| By Line of Therapy | First-line | |
| Maintenance / Consolidation | ||
| Second-line | ||
| Third-line & Beyond | ||
| By Cancer Stage | Non-Muscle Invasive Bladder Cancer (NMIBC) | |
| Muscle Invasive Bladder Cancer (MIBC) | ||
| Metastatic Urothelial Carcinoma (mUC) | ||
| By Biomarker Status | FGFR2/3 Altered | |
| PD-L1 High Expression | ||
| Nectin-4 High Expression | ||
| HER2 Positive | ||
| Biomarker Unselected | ||
| By Distribution Channel | Hospital Pharmacies | |
| Specialty Clinics | ||
| Online Pharmacies | ||
| Geography | North America | United States |
| Canada | ||
| Mexico | ||
| Europe | Germany | |
| United Kingdom | ||
| France | ||
| Italy | ||
| Spain | ||
| Rest of Europe | ||
| Asia-Pacific | China | |
| Japan | ||
| India | ||
| South Korea | ||
| Australia | ||
| Rest of Asia-Pacific | ||
| Middle East and Africa | GCC | |
| South Africa | ||
| Rest of Middle East and Africa | ||
| South America | Brazil | |
| Argentina | ||
| Rest of South America | ||


Key Questions Answered in the Report
How large is the urothelial cancer drugs market in 2026?
It totals USD 4.47 billion, reflecting brisk uptake of immunotherapies and ADC combinations.
Which treatment class is growing fastest through 2031?
Antibody-drug conjugates lead, with an 18.21% compound annual growth rate driven by enfortumab vedotin combinations.
What region records the highest market share today?
North America, at 42.88%, owing to generous reimbursement and early adoption of breakthrough therapies.
Why is Asia-Pacific expanding more rapidly than other regions?
Broader cancer screening, infrastructure upgrades, and insurance expansion propel a 12.11% CAGR to 2031.
What is the most significant barrier to therapy adoption worldwide?
High drug costs, especially for checkpoint inhibitors and ADCs, continue to restrict broad access.
How are partnerships influencing FGFR inhibitor development?
Alliances between large pharma and biotech firms compress development timelines and accelerate global launches of targeted agents.
Page last updated on:


