Urban Air Mobility (UAM) Market Size and Share
Market Overview
| Study Period | 2019 - 2040 |
|---|---|
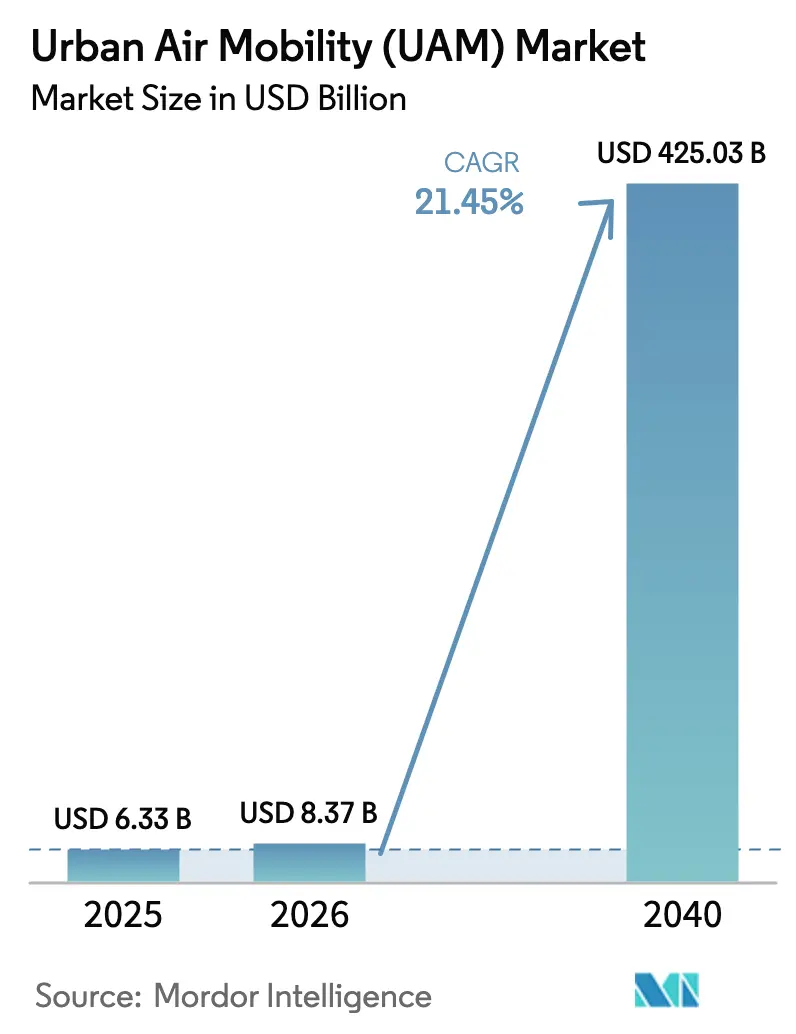
| Market Size (2026) | USD 8.37 Billion |
| Market Size (2040) | USD 425.03 Billion |
| Growth Rate (2026 - 2040) | 21.45% CAGR |
| Fastest Growing Market | Asia Pacific |
| Largest Market | North America |
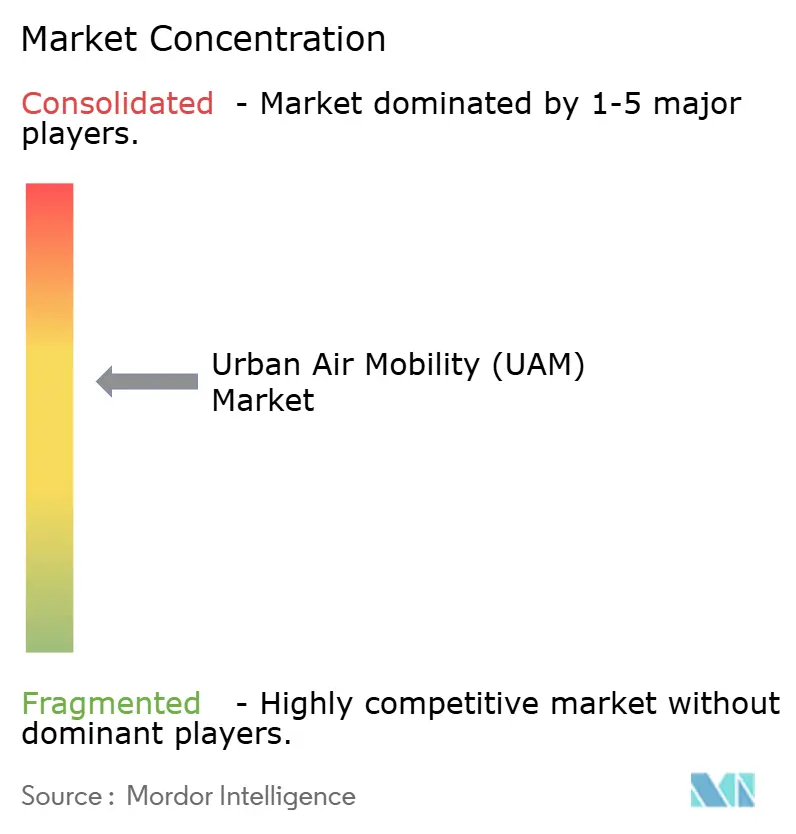
| Market Concentration | Medium |
Major Players *Disclaimer: Major Players sorted in no particular order Image © Mordor Intelligence. Reuse requires attribution under CC BY 4.0. | |
Urban Air Mobility (UAM) Market Analysis by Mordor Intelligence
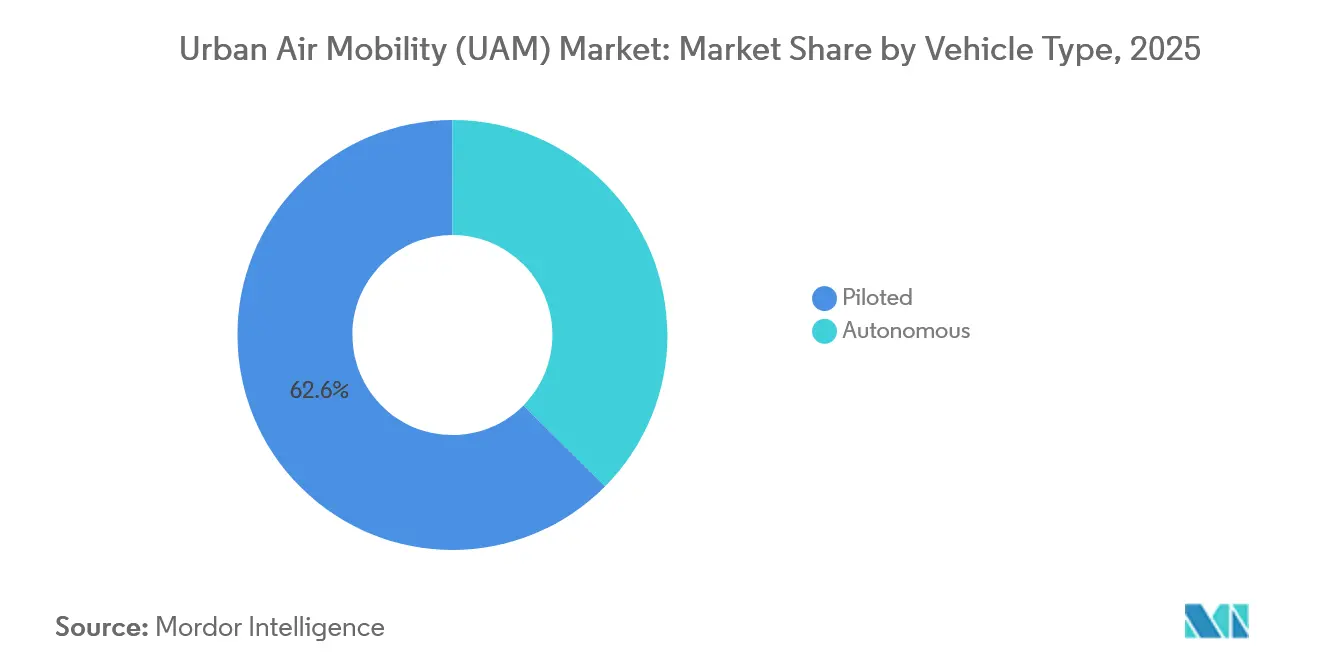
The urban air mobility (UAM) market size is expected to grow from USD 6.33 billion in 2025 to USD 8.37 billion in 2026, and is forecast to reach USD 425.03 billion by 2040 at a projected CAGR of 119.34%. Battery-density breakthroughs, automotive-style manufacturing, and regulatory sandboxes are compressing development cycles, enabling early revenue service. Piloted configurations held a 62.56% share in 2026; yet, autonomous variants are forecast to grow fastest as redundancy architectures prove their reliability. Intracity routes under 100 km dominated demand owing to vertiport density constraints, while hybrid-electric propulsion is advancing quickly to unlock longer corridors. Investment momentum remains strong as institutional capital flows into vertiport infrastructure and fleet financing, signaling confidence that unit economics can rival premium ground transport.
Key Report Takeaways
- By vehicle type, piloted aircraft commanded 62.56% of the urban air mobility (UAM) market share in 2026, while autonomous variants are expected to advance at a 112.25% CAGR through 2040.
- By range, intracity missions accounted for 59.71% of the urban air mobility (UAM) market size in 2026 and are projected to rise at a 104.64% CAGR through 2040.
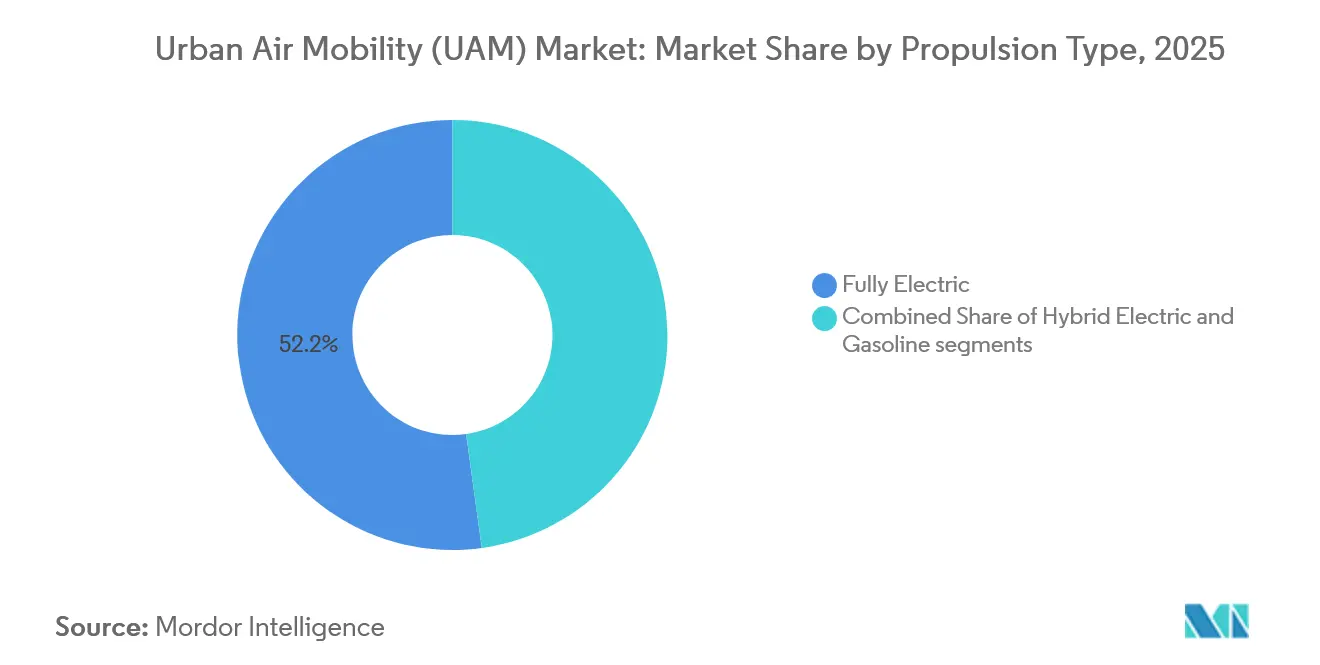
- By propulsion type, fully electric platforms secured a 52.18% share of the urban air mobility (UAM) market in 2026, whereas hybrid-electric systems will post a 125.27% CAGR through 2040.
- By application, passenger air-taxi services led with 51.84% of 2026 revenue; emergency medical services exhibit the highest growth at a 104.72% CAGR.
- By end user, ride-sharing operators accounted for 54.56% of 2026 spending; healthcare providers represent the fastest-growing cohort with a 113.68% CAGR.
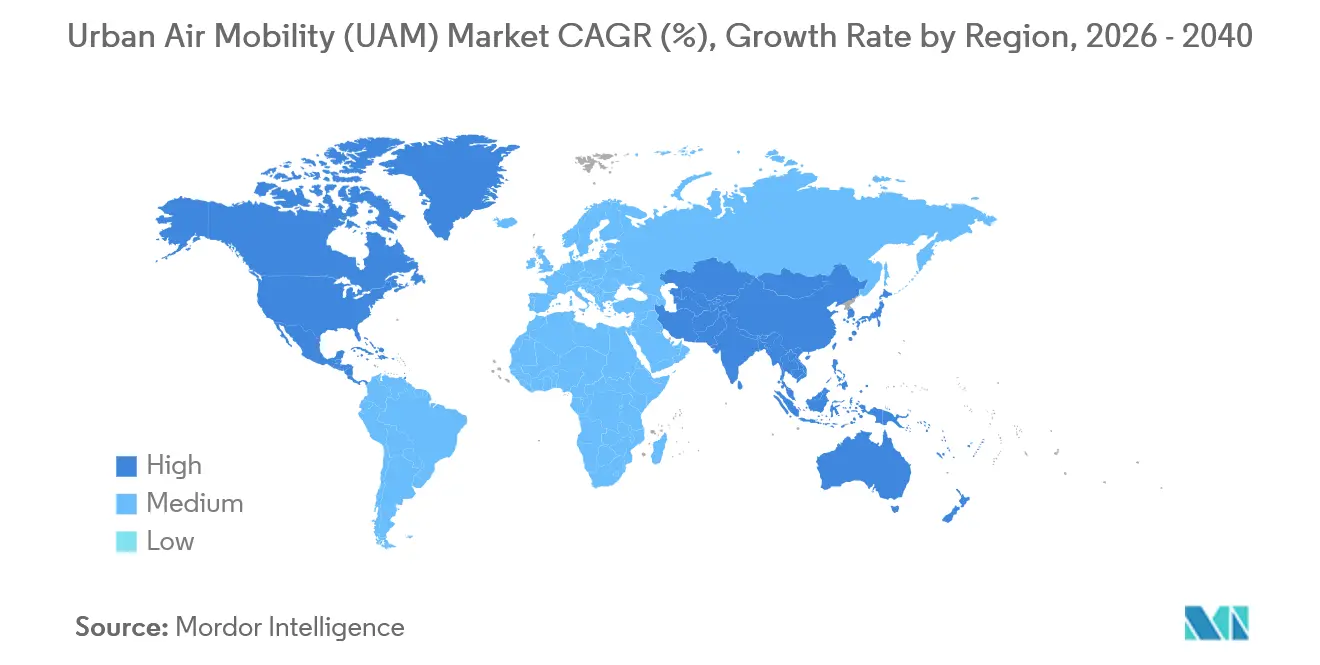
- By geography, North America held 49.78% of the 2026 value, while the Asia-Pacific region is projected to expand at a 93.57% CAGR through 2040.
Note: Market size and forecast figures in this report are generated using Mordor Intelligence’s proprietary estimation framework, updated with the latest available data and insights as of January 2026.
Global Urban Air Mobility (UAM) Market Trends and Insights
Drivers Impact Analysis*
| Driver | (~) % Impact on CAGR Forecast | Geographic Relevance | Impact Timeline |
|---|---|---|---|
| Rapid battery-energy-density gains push eVTOL range beyond 150 km | +7.1% | Global; strongest in North America and Europe | Medium term (2-4 years) |
| Automotive-grade supply chains drive down eVTOL unit costs | +5.4% | Global, with early adoption in Asia-Pacific | Medium term (2-4 years) |
| Vertiport PPP financing models unlock infrastructure rollout | +4.2% | North America, Europe, and Middle East | Long term (≥ 4 years) |
| Regulatory "sandbox" corridors accelerate certification timelines | +3.5% | North America, Europe, and UAE | Short term (≤ 2 years) |
| Premium airport-shuttle demand from mega-hub expansions | +2.9% | Middle East, Asia-Pacific, and North America | Medium term (2-4 years) |
| AI-enabled UTM platforms de-risk high-density airspace operations | +2.3% | Global | Long term (≥ 4 years) |
| Source: Mordor Intelligence | |||


Rapid Battery-Energy-Density Gains Push eVTOL Range Beyond 150 km
Solid-state and lithium-metal cells exceeded 400 Wh/kg in 2024, lifting eVTOL cruise range past 150 km with a 20% reserve that satisfies diversion rules.[1] Joby Aviation flight-tested 161 km with four passengers in 2025, validating intercity links such as Los Angeles–San Diego and Tokyo-Osaka.[2]Joby Aviation, “161 km Range Validation Flight Tests,” JobyAviation.com Higher energy density also reduces the weight of cooling hardware, allowing designers to add redundant controls that expedite certification. Toyota now builds high-precision modules for Joby, holding cell variance below 2%. As densities approach 500 Wh/kg by 2028, island-hopping and offshore-platform logistics become viable, widening the urban air mobility (UAM) market beyond dense urban cores.
Automotive-Grade Supply Chains Drive Down eVTOL Unit Costs
Automotive tier-1 suppliers achieve 1-minute takt times, automated resin-transfer molding, and just-in-time logistics, which slash production costs by 30–40%. Archer’s Stellantis partnership aims to achieve a USD 2 million price per aircraft by 2026, down from USD 3.5 million for hand-built prototypes.[3]Archer Aviation, “USD 500 Million Credit Facility 2025,” Archer.com Bosch and ZF are adapting EV inverters for aviation qualification, earning multi-year volume commitments that stabilize tooling outlays. Cycle times for composite fuselages have decreased from 72 hours to 8 hours, resulting in scrap trimming below 3%. By 2027, 60% of component value is expected to come from auto-sector suppliers, transforming procurement strategies across the urban air mobility (UAM) market.
Vertiport PPP Financing Models Unlock Infrastructure Rollout
Public-private partnerships now dominate vertiport finance. Ferrovial committed USD 500 million to develop 25 sites across the US, exchanging private capital for 30-year concessions while municipalities retain ownership of the land.[4]Ferrovial, “USD 500 Million Vertiport Program,” Ferrovial.com Dubai granted Skyports a 25-year concession covering four vertiports with phased exclusivity, ensuring predictable returns for investors. PPP structures streamline environmental reviews via upfront community-benefit agreements and attract infrastructure funds seeking 8–10% internal rates of return. Tokyo’s 2024 plan to integrate vertiports into rail hubs demonstrates transit-oriented design that can sustain 10-minute departure intervals, meeting utilization thresholds that underpin the urban air mobility (UAM) market.
Regulatory “Sandbox” Corridors Accelerate Certification Timelines
Regulators are authorizing provisional revenue flights to gather operational data without requiring full compliance. The FAA expanded its Part 135 waiver in 2024, letting Joby carry passengers on experimental routes in California. Japan granted similar allowances for the 2025 Osaka Expo, and the UAE licensed autonomous EHang flights, setting precedents that pressure Western agencies to follow. EASA’s Special Condition SC-VTOL focuses on operational risk rather than prescriptive design, trimming approval cycles to roughly five years. Sandbox data now feeds into ICAO workstreams, which are expected to standardize global rules by 2027, thereby accelerating the rollout of the urban air mobility (UAM) market.
Restraints Impact Analysis*
| Restraint | (~) % Impact on CAGR Forecast | Geographic Relevance | Impact Timeline |
|---|---|---|---|
| Slow vertiport permitting in tier-1 cities | -4.80% | North America and Europe | Medium term (2-4 years) |
| Public-acceptance headwinds on noise and visual pollution | -3.80% | Global, with higher impact in Europe | Short term (≤ 2 years) |
| Battery raw-material price volatility | -2.90% | Global | Medium term (2-4 years) |
| Pilot-shortage bottleneck before full autonomy | -2.30% | Global; higher impact in North America | Short term (≤ 2 years) |
| Source: Mordor Intelligence | |||
Slow Vertiport Permitting in Tier-1 Cities
Municipal processes can add 18–36 months to construction as zoning boards weigh heritage site lines, helicopter operator objections, and environmental reviews. New York’s Downtown vertiport required 14 public hearings before a 2026 opening. London rejected a Thames-side proposal in 2025 over visual-impact concerns. Los Angeles restricts sites within 1,500 ft of residences, pushing vertiports to industrial land that undermines door-to-door time savings. Tokyo mandates noise-easement agreements with adjacent owners, often taking more than two years. By contrast, Dubai and NEOM fast-tracked approvals in under six months, highlighting a competitive divergence that could shift early urban air mobility (UAM) market revenue away from traditional megacities.
Public-Acceptance Headwinds on Noise and Visual Pollution
EASA’s 2024 survey found 62% opposition to over-residential flights despite eVTOL noise levels 10 dB below helicopters. Volocopter’s Munich trials reduced complaints by 30% by adjusting flight paths, but energy use increased by 12%, which impacted the economics. Los Angeles has imposed a moratorium on new helicopter routes pending a 2024 eVTOL noise study, which will delay vertiport licensing. Acceptance improves when missions are medical rather than discretionary, prompting operators to invest in community dashboards and transparent monitoring.
*Our forecasts treat driver/restraint impacts as directional, not additive. The impact forecasts reflect baseline growth, mix effects, and variable interactions.
Segment Analysis
By Vehicle Type: Autonomy Trajectory Hinges on Regulatory Convergence
Autonomous designs are projected to grow at a 112.25% CAGR, whereas piloted configurations held 62.56% of the 2026 urban air mobility (UAM) market share. Wisk’s Generation 6 became the first autonomous passenger aircraft to enter FAA type-certification review in 2025, backed by 10,000 hours of simulation data. EHang’s EH216-S secured a production certificate in China, completing 40,000 incident-free flights by 2025.
Regulatory convergence remains the swing factor. FAA draft guidance requires triple-redundant controls, adding 12–18 months compared to piloted variants, yet achieving lower direct operating costs, roughly 40% below those of piloted fleets, keeping autonomy central to long-term profitability in the urban air mobility (UAM) market. Public confidence programs, including voluntary safety reporting portals and the sharing of transparent flight data, aim to accelerate the acceptance of these measures.


By Range: Battery Endurance Dictates Intracity Dominance
Intracity missions under 100 km captured 59.71% of 2026 demand, supported by batteries designed for 25- to 35-minute blocks with 20% reserves. Archer’s Midnight optimizes for 32 km airport shuttles, delivering 12-minute trips that replace 45-minute drives. Tokyo’s plan to embed vertiports in rail hubs will support 10-minute headways, thereby amortizing fixed costs.
Intercity growth hinges on hybrid powertrains and solid-state cells. Eve targets a 150 km range using a turbine range-extender, enabling São Paulo–Campinas corridors where ground travel exceeds two hours. Regulatory work on low-altitude IFR lanes will further open intercity opportunities in the urban air mobility (UAM) market.
By Propulsion Type: Hybrid Electric Captures Range-Sensitive Segments
Hybrid-electric systems are forecasted to rise at a 125.27% CAGR, complementing fully electric models, which held a 52.18% share in 2026. Jaunt’s compound helicopter demonstrated a 250 km range after gaining hybrid drivetrain approval in 2024.
Fully electric variants appeal to zero-emission mandates in Europe and China, achieving energy cost targets of 3 cents per seat-mile. Hybrid advocates counter with a diversion capability that reduces weather cancellations. Certification parity between electric and hybrid powertrains eliminates compliance advantages, allowing mission economics to determine the split within the urban air mobility (UAM) market size.
By Application: Emergency Medical Services Command Premium Economics
Emergency medical services (EMS) are poised to grow at a 104.72% CAGR, driven by 20–30% improvements in survival rates when response times fall below 15 minutes. BETA’s Alia deliveries to Duke University Hospital in 2025 reduced the per-flight cost by 60% compared to leased helicopters.
Air-taxi operations still account for nearly half of 2025 revenue, but medical, cargo, and logistics uses promise higher utilization and lower risk of discretionary demand. The application mix is expected to tilt toward mission-critical use cases, raising the resilience of the broader urban air mobility (UAM) market.
By End User: E-commerce Firms Drive Innovative Applications
Ride-sharing operators captured 54.56% of the 2026 spend; however, healthcare providers are expected to expand at a 113.68% CAGR as hospitals purchase aircraft outright to avoid helicopter lease fees. Cleveland Clinic’s acquisition of four BETA eVTOLs illustrates the owned-fleet model.
Logistics firms and corporate clients together made up 32% of 2025 demand and are adopting fractional ownership to optimize capital use. Military agencies, through programs such as Agility Prime, fund technology that migrates to civilian fleets, solidifying cross-segment synergies within the urban air mobility (UAM) market.
Geography Analysis
North America led with 49.78% of the 2026 market value. The FAA's Advanced Air Mobility Implementation Plan created test corridors across eight states, allowing Joby to secure a Part 135 certificate in 2024. Private developers have earmarked USD 1.2 billion for vertiports in Dallas, Miami, and San Francisco. At the same time, Transport Canada has approved Eve's Ontario factory, which will supply the regional urban air mobility (UAM) market.
The Asia-Pacific region is projected to grow at a 93.57% CAGR from 2026 to 2040, driven by China's USD 14 billion low-altitude economy fund and Japan's demonstration flights for the 2025 Osaka Expo. South Korea's USD 384 million Grand Challenge invests in Seoul's vertiports, and India's draft regulations outline tourism routes between Delhi and Agra.
Europe benefits from EASA's harmonized SC-VTOL rule set; however, community concerns have postponed commercial service in Paris and Munich until 2027. The Middle East accelerates through sovereign-fund backing, as Dubai granted a 25-year concession to Skyports and NEOM ordered 100 Volocopters. Latin American growth centers on Brazil, where Embraer's partnership with Eve amassed 2,900 orders awaiting ANAC clearance. These regional dynamics collectively shape demand distribution in the urban air mobility (UAM) market.

Competitive Landscape
The urban air mobility (UAM) market is moderately consolidated, with companies such as Guangzhou EHang Intelligent Technology Co., Ltd., Airbus SE, Archer Aviation Inc., Volocopter GmbH (formerly Diamond Aircraft Industries GmbH), and Joby Aviation, Inc. holding a significant market share. Fifteen manufacturers pursue type certification, with none exceeding 12% of pre-delivery orders. Early movers combine certification progress with automotive alliances: Joby’s in-house battery line gives supply security, while Archer outsources propulsion to leverage supplier scale. Patent filings underscore differentiation. Joby holds 567 grants focused on tilt-rotor algorithms; Volocopter claims 312 covering multi-rotor redundancy.
Consolidation pressure grows as capital requirements for production lines exceed USD 500 million. Automotive and aerospace conglomerates are taking minority stakes rather than complete acquisitions, thereby retaining optionality in case market leaders shift. White-space areas, hybrid intercity designs, autonomous cargo variants, and retrofit kits attract new entrants, sustaining moderate fragmentation in the near term.
Export-oriented Chinese OEMs undercut Western pricing by 30-40%, backed by domestic subsidies and fast-track CAAC approvals. Western manufacturers respond by emphasizing after-sales networks and safety data. Supply-chain access and route exclusivity agreements with airports are emerging as decisive advantages in the evolving urban air mobility (UAM) market.
Urban Air Mobility (UAM) Industry Leaders
Guangzhou EHang Intelligent Technology Co., Ltd.
Airbus SE
Archer Aviation Inc.
Volocopter GmbH (Diamond Aircraft Industries GmbH)
Joby Aviation, Inc.
- *Disclaimer: Major Players sorted in no particular order

Recent Industry Developments
- June 2025: Archer Aviation successfully demonstrated the dual functionality of its Midnight aircraft by completing its first piloted conventional take-off and landing.
- June 2025: SITA and Urban-Air Port collaborated to develop a software-defined vertiport management system that seamlessly integrates passenger, aircraft, and power operations.
- June 2025: Eve Air Mobility secured up to USD 15.8 million in funding from Brazil’s FINEP to advance autonomous flight, hybrid-electric propulsion, and advanced air traffic management (ATM) technologies.
- May 2025: Wisk Aero and NASA expanded their research partnership to drive progress in autonomous flight technologies for UAM, with a focus on integrating traffic management systems.


Research Methodology Framework and Report Scope
Market Definitions and Key Coverage
The study treats the urban air mobility market as all commercially built electric or hybrid-electric vertical take-off and landing aircraft (eVTOLs) designed for passenger or light-cargo services within and between metropolitan areas. This includes piloted or autonomous platforms, supporting software, and the revenues earned from scheduled, on-demand, or logistics flights.
Scope exclusion: Conventional rotorcraft powered solely by turbine engines fall outside our definition.
Segmentation Overview
- By Vehicle Type
- Piloted
- Autonomous
- By Range
- Intracity (Less than 100 km)
- Intercity (Greater than 100 km)
- By Propulsion Type
- Fully Electric
- Hybrid Electric
- Gasoline
- By Application
- Passenger Air Taxi
- Intra-city Shuttle
- Emergency Medical Services (EMS)
- Cargo and Logistics
- By End User
- Ride-Sharing Operators
- Corporate and VIP Clients
- E-commerce and Logistics Firms
- Healthcare Providers
- Military and Government Agencies
- By Geography
- North America
- United States
- Canada
- Mexico
- Europe
- United Kingdom
- France
- Germany
- Italy
- Spain
- Rest of Europe
- Asia-Pacific
- China
- India
- Japan
- South Korea
- Australia
- Rest of Asia-Pacific
- South America
- Brazil
- Rest of South America
- Middle East and Africa
- Middle East
- United Arab Emirates
- Saudi Arabia
- Turkey
- Rest of Middle East
- Africa
- South Africa
- Rest of Africa
- Middle East
- North America
Detailed Research Methodology and Data Validation
Primary Research
We interviewed air-taxi CTOs, airport planners, battery suppliers, and regulators across North America, Europe, and Asia-Pacific. Dialogs clarified realistic entry-into-service dates, typical fare expectations, fleet utilization targets, and vertiport throughput, thereby closing data gaps that literature alone cannot resolve.
Desk Research
Our analysts first combed public domain sources such as FAA concept-of-operations drafts, EASA Special Condition guidelines, ICAO traffic data, UN urbanization tables, and battery energy-density studies from peer-reviewed journals. Company 10-Ks, investor decks, and vertiport planning documents enrich baseline assumptions. Paid databases, D&B Hoovers for corporate revenue splits and Dow Jones Factiva for program milestones, provide additional fact checks. This list is illustrative; numerous other publications help refine and corroborate inputs.
Market-Sizing & Forecasting
A top-down and bottom-up hybrid model starts with urban population pockets, average trip lengths, and current modal splits to derive an addressable demand pool. Penetration rates are stress-tested against eVTOL order backlogs, certified aircraft counts, battery Wh/kg road maps, vertiport roll-out schedules, passenger willingness-to-pay surveys, and regulatory milestone tracking. Select supplier roll-ups (sample ASP × volumes) validate totals and adjust anomalies. Multivariate regression plus scenario analysis projects demand to 2040, letting battery cost curves and regulatory pace shift growth bands. When bottom-up evidence is thin, interpolation uses nearest proxy fleets and utilization coefficients vetted during interviews.
Data Validation & Update Cycle
Outputs pass three layers of analyst review, variance benchmarking, and anomaly flags. Models refresh every twelve months, with mid-cycle updates if certification slippage, funding shocks, or major policy moves materially change forecasts. Before release, a fresh validation run ensures clients receive our latest view.
Why Mordor's Urban Air Mobility Baseline Commands Reliability
Published figures often diverge because firms mix helicopters with eVTOLs, apply single-line CAGR extensions, or freeze currency and battery-price assumptions. Our disciplined scope, annual refresh cadence, and dual-path modeling minimize such drift.
Key gap drivers include differing treatment of vertiport infrastructure income, whether cargo drones are folded into totals, and the conversion rates applied when translating preorder announcements into delivered fleets.
Benchmark comparison
| Market Size | Anonymized source | Primary gap driver |
|---|---|---|
| USD 5.00 B (2025) | Mordor Intelligence | - |
| USD 4.60 B (2024) | Global Consultancy A | Omits intercity segments, relies on single CAGR extension |
| USD 4.99 B (2024) | Industry Association B | Counts only air-taxi revenue, no cargo services |
| USD 4.87 B (2024) | Trade Journal C | Top-down estimate without supplier cross-checks |
In sum, the modest premium in Mordor's baseline reflects fuller segment coverage, primary-validated penetration curves, and an update rhythm attuned to fast-moving certification and funding news, giving decision-makers a transparent and repeatable starting point.


Key Questions Answered in the Report
What is the current global value of the urban air mobility (UAM) market?
The urban air mobility (UAM) market size reached USD 6.33 billion in 2026.
How fast is the sector expected to expand?
Revenue is projected to grow at a 119.34% CAGR, reaching USD 425.03 billion by 2040.
Which region leads adoption?
North America held 49.78% of 2026 value thanks to supportive FAA pathways and vertiport funding.
What application is growing the fastest?
Emergency medical services (EMS) are forecasted to rise at a 104.72% CAGR as demand increases for rapid-response mobility.
How soon will autonomous passenger flights scale?
Full commercial autonomy is expected post-2028 once regulators finalize equivalent-safety standards and public confidence builds.
What is the main cost-reduction lever for manufacturers?
Automotive-grade supply chains are cutting eVTOL unit costs by 30–40%, accelerating affordability.
Page last updated on:


