Unmanned Underwater Vehicle Market Size and Share
Market Overview
| Study Period | 2019 - 2030 |
|---|---|
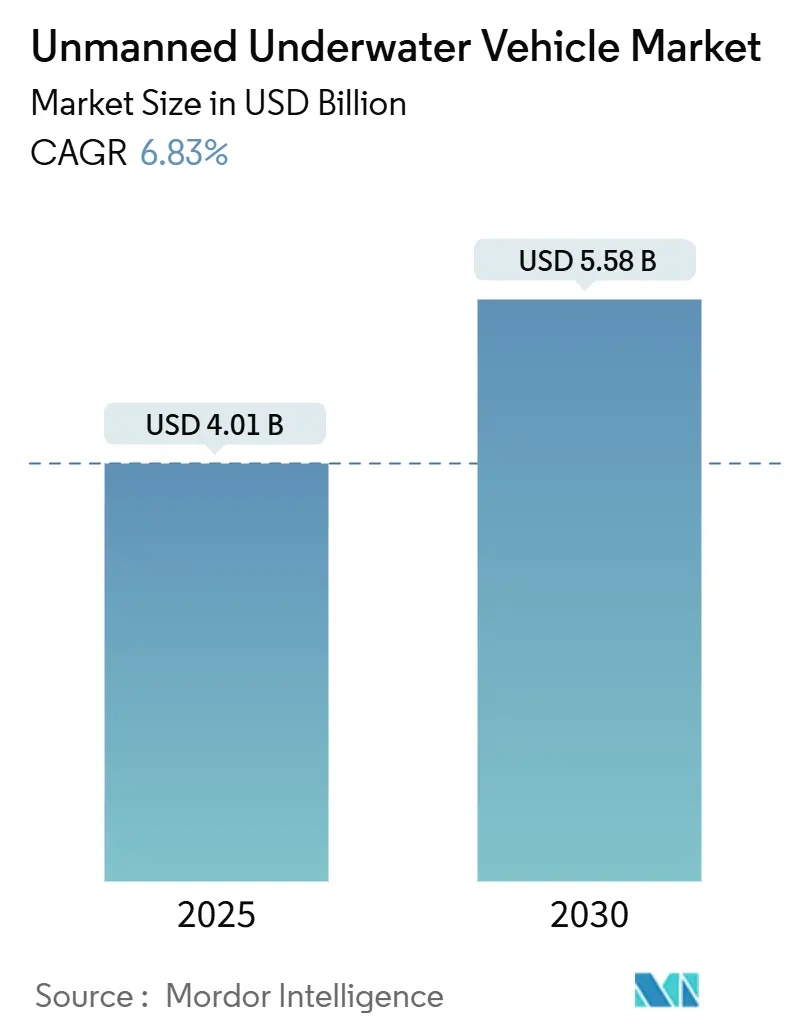
| Market Size (2025) | USD 4.01 Billion |
| Market Size (2030) | USD 5.58 Billion |
| Growth Rate (2025 - 2030) | 6.83% CAGR |
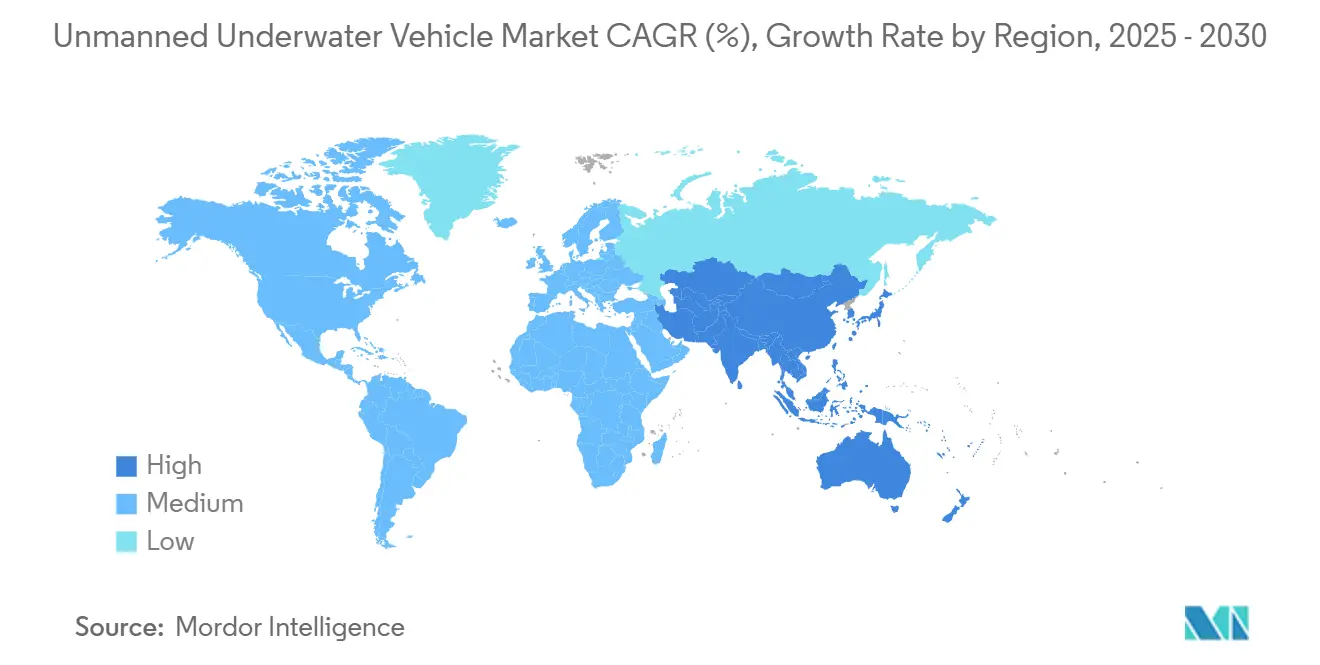
| Fastest Growing Market | Asia Pacific |
| Largest Market | North America |
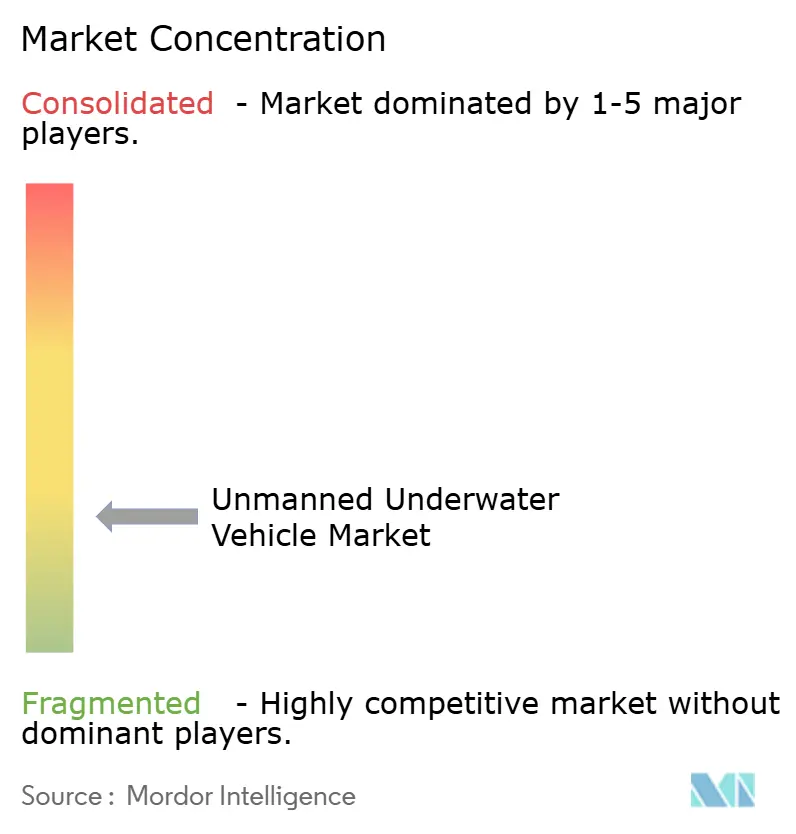
| Market Concentration | Low |
Major Players *Disclaimer: Major Players sorted in no particular order Image © Mordor Intelligence. Reuse requires attribution under CC BY 4.0. | |
Unmanned Underwater Vehicle Market Analysis by Mordor Intelligence
The unmanned underwater vehicle market size reached USD 4.01 billion in 2025 and is projected to advance to USD 5.58 billion by 2030, reflecting a 6.83% CAGR. Rising naval modernization budgets, expanding offshore wind build-outs, and heightened concern for subsea infrastructure security are the prime forces sustaining this trajectory. Programs like the US Navy’s Large Displacement Unmanned Underwater Vehicle (LDUUV) prototype effort and Australia’s AUD 1.7 billion Ghost Shark project catalyze rapid technology convergence that merges legacy ROV manipulation strengths with AUV autonomy for long-range missions. Meanwhile, offshore operators are shifting toward autonomous inspection to reduce vessel day rates and comply with stricter environmental rules, reinforcing demand for hybrid electric propulsion and pressure-neutral battery systems. Competitive intensity is rising as defense primes, subsea contractors, and AI-centric start-ups vie to shape the next generation of modular, interoperable platforms supporting defense and commercial customers.
Key Report Takeaways
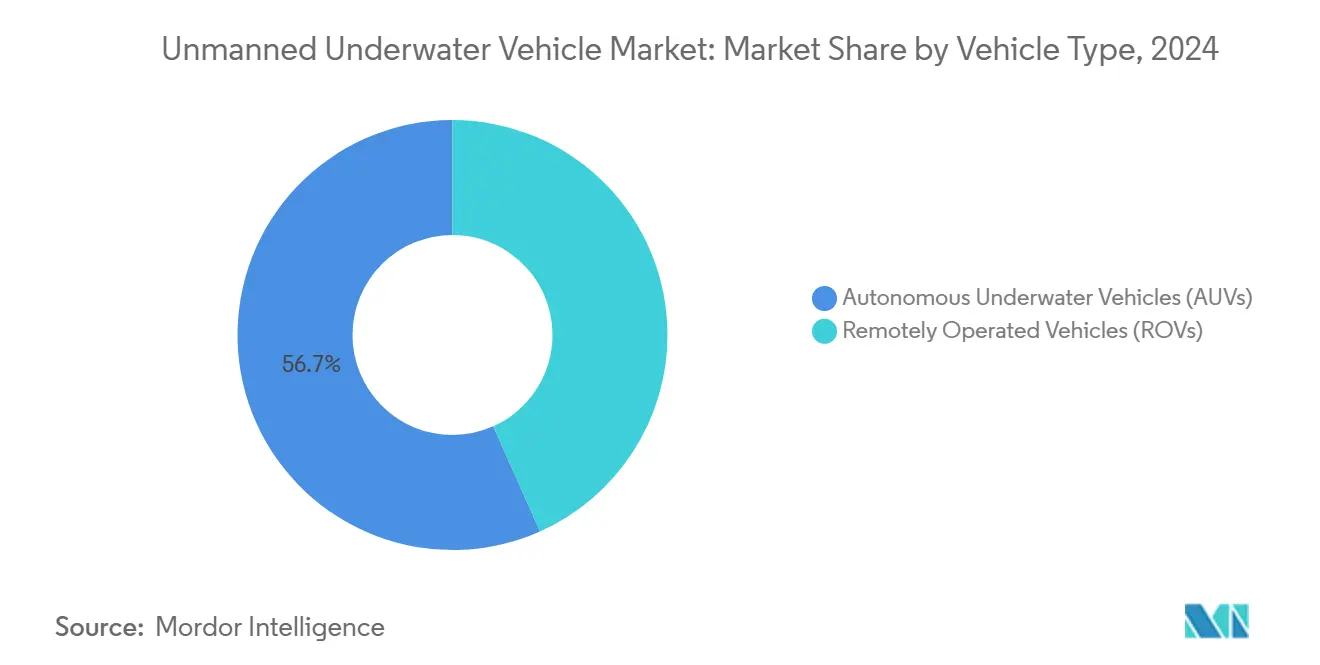
- By vehicle type, remotely operated vehicles (ROVs) led the unmanned underwater vehicle market with 56.67% share in 2024. In contrast, autonomous underwater vehicles (AUVs) will expand at a 9.54% CAGR through 2030.
- By application, defense accounted for a 39.67% revenue share of the unmanned underwater vehicle market in 2024, and commercial applications are advancing at a 7.67% CAGR through 2030.
- By propulsion type, electric systems commanded a 52.45% share of the unmanned underwater vehicle market size in 2024 and are growing at an 8.12% CAGR between 2025 and 2030.
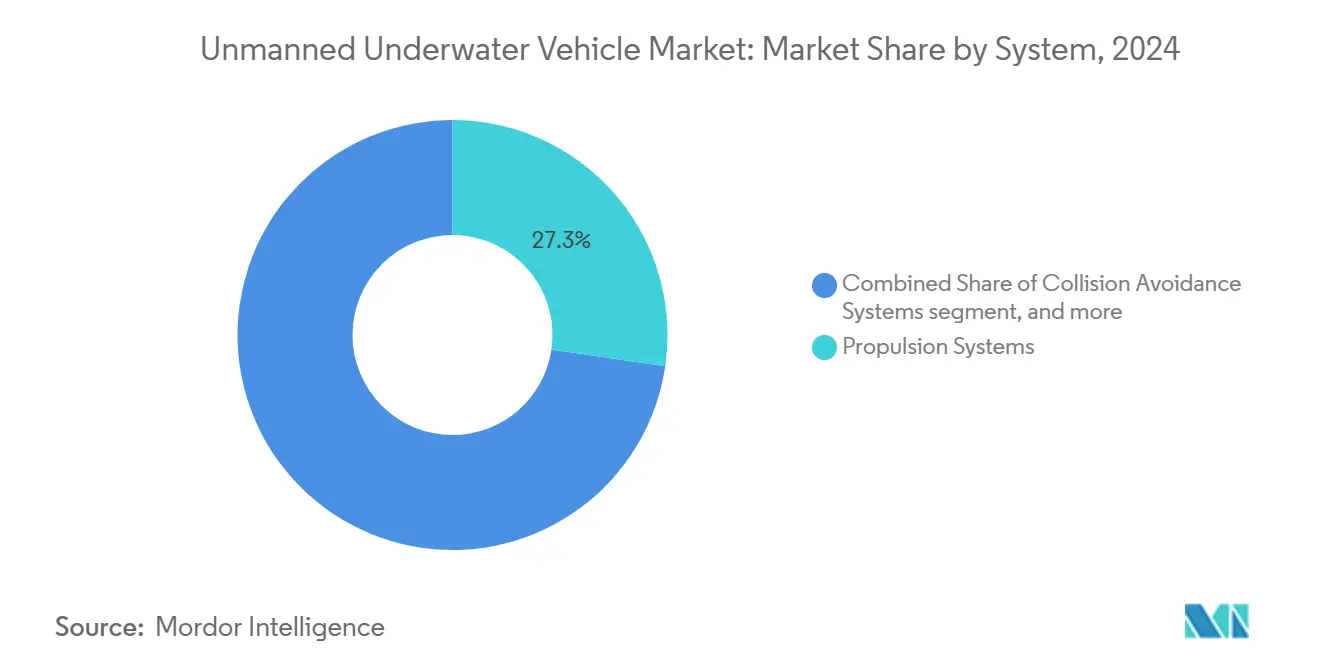
- By system, propulsion systems contributed 27.32% of 2024 revenue, while collision-avoidance solutions are on track for a 7.55% CAGR to 2030.
- By size, medium vehicles captured 43.71% of 2024 sales, and small platforms are on pace for an 8.21% CAGR over the forecast horizon.
- By depth rating, medium-depth units held a 47.76% share in 2024; deep-water systems are projected to post a 7.75% CAGR through 2030.
- By geography, North America held a 34.22% share in 2024; Asia-Pacific is projected to post an 8.01% CAGR through 2030.
Global Unmanned Underwater Vehicle Market Trends and Insights
Drivers Impact Analysis*
| Driver | (~) % Impact on CAGR Forecast | Geographic Relevance | Impact Timeline |
|---|---|---|---|
| Expansion of offshore deep-water oil and gas exploration activities | +1.8% | Global; early gains in North Sea, Gulf of Mexico, Brazil | Medium term (2-4 years) |
| Rising naval investments in anti-submarine warfare (ASW) and mine countermeasure (MCM) missions | +2.1% | North America and EU; APAC spill-over | Long term (≥ 4 years) |
| Growing emphasis on subsea infrastructure security for cables and offshore wind assets | +1.5% | Global; focus in North Atlantic, North Sea, APAC | Short term (≤ 2 years) |
| Development of autonomous recharge hubs to extend operational endurance | +0.9% | North America, Europe, Australia | Long term (≥ 4 years) |
| Adoption of next-generation high-density pressure-neutral batteries | +1.2% | Global | Medium term (2-4 years) |
| Implementation of ESG-driven regulations mandating subsea inspection regimes | +0.7% | Europe, North America; APAC spill-over | Medium term (2-4 years) |
| Source: Mordor Intelligence | |||
Expansion of Offshore Deep-Water Oil and Gas Exploration Activities
Deep-water campaigns increasingly rely on autonomous vehicles operating beyond traditional tether limits. Oceaneering’s Freedom AUV inspected TotalEnergies pipelines at depths over 2,000 m, streaming data in real time while lowering vessel costs by up to 60%.[1]Oceaneering International, “Freedom AUV Pipeline Inspection,” oceaneering.com Regulators like the US Bureau of Safety and Environmental Enforcement require frequent asset monitoring, encouraging operators to deploy fleets rather than one-off charters. The result is sustained ordering of hybrid AUV/ROV systems that combine long-range navigation with heavy-duty manipulators for intervention work. Falling battery prices further broaden the addressable customer base among mid-size offshore contractors. Together, these factors lift near-term utilization rates and underpin steady backlog growth for inspection service providers.
Rising Naval Investments in Anti-Submarine Warfare and Mine Countermeasure Missions
Defense ministries are redirecting funds toward distributed autonomous networks capable of persistent underwater presence. The Pentagon allocated USD 24.9 million to Northrop Grumman Corporation under the Competitive Autonomous Maritime Platform program for next-generation drones, emphasizing self-learning threat response. DARPA’s Manta Ray prototype validated energy-harvesting technologies that promise multimonth deployments without resupply. Parallel initiatives in Australia, India, Japan, and South Korea mirror this uptick, accelerating global demand for extra-large AUVs capable of torpedo-tube launch and recovery. Suppliers that deliver open-architecture command stacks and modular payload bays are well-positioned to secure framework contracts spanning the coming decade.
Growing Emphasis on Subsea Infrastructure Security for Cables and Offshore Wind Assets
Sabotage incidents involving energy pipelines and communication cables have elevated subsea security to a strategic priority. European operators responded with 24/7 monitoring programs that rely on long-endurance AUVs armed with passive acoustic arrays and forward-looking sonar for threat detection.[2]Euro-SD, “AUVs and ROVs in Seabed Warfare,” euro-sd.com Offshore wind developers also embrace autonomous inspection to safeguard turbine foundations and inter-array cabling, citing 50-70% cost savings versus crewed patrols. Continental forces are narrowing the capability gap by fast-tracking the acquisition of commercial-derivative vehicles. Vendors offering integrated data-fusion dashboards and secure cloud pipelines gain a competitive edge as asset owners seek holistic situational awareness.
Development of Autonomous Recharge Hubs to Extend Operational Endurance
Wireless charging docks and seabed energy-harvesting stations are removing endurance bottlenecks that once constrained mission scope. Naval Research Laboratory trials proved inductive recharging for gliders, while academic consortia demonstrated wave-powered systems that support year-round Arctic observation. OEMs now bundle docking algorithms, AUV homing beacons, and modular power banks into turnkey packages that slot into existing field layouts. This shift lets operators rotate sensor suites without recovering the host vehicle, reducing downtime and expanding coverage windows. Regulatory guidelines from the International Maritime Organization (IMO) legitimize these hubs in international waters, accelerating commercial roll-out.
Restraints Impact Analysis*
| Restraint | (~) % Impact on CAGR Forecast | Geographic Relevance | Impact Timeline |
|---|---|---|---|
| High acquisition and life-cycle costs of UUV fleets | –1.4% | Global; acute for smaller navies and contractors | Short term (≤ 2 years) |
| Bandwidth and latency limitations in underwater communications | –0.8% | Global; deep-water operations | Medium term (2-4 years) |
| Increasing acoustic spectrum congestion in busy littoral environments | –0.6% | North Sea, Mediterranean, East China Sea, Persian Gulf | Short term (≤ 2 years) |
| Supply chain risks associated with critical minerals for lithium-ion and fuel cell systems | –0.9% | Global; heightened in Asia-Pacific | Medium term (2-4 years) |
| Source: Mordor Intelligence | |||
High Acquisition and Life-Cycle Costs of UUV Fleets
The total cost of ownership remains a deterrent for agencies that lack sustained capital budgets. Up-front acquisition, depot-level maintenance, and crew training expenses frequently surpass USD 15 million for heavy-work-class systems. Financing schemes such as service leasing and performance-based contracts are emerging, yet adoption is uneven. Vendors are exploring common-hull architectures to spread R&D outlays across multiple mission variants, though benefits will materialize gradually.
Bandwidth and Latency Limitations in Underwater Communications
Acoustic channels offer limited data rates and suffer from multipath distortion, complicating real-time control of complex missions. Optical and RF links degrade rapidly with depth, forcing operators to rely on pre-planned autonomy or expendable relay nodes. Research into smart coherence modulation and AI-based packet reconstruction is promising, but practical field deployment is two to three years away.
*Our forecasts treat driver/restraint impacts as directional, not additive. The impact forecasts reflect baseline growth, mix effects, and variable interactions.
Segment Analysis
By Vehicle Type: ROV Dominance Faces AUV Disruption
ROVs maintained 56.67% of 2024 revenue, underscoring entrenched acceptance for heavy manipulation and construction tasks. AUVs nonetheless recorded the fastest improvement at a 9.54% CAGR through 2030, buoyed by maturing AI route-planning and obstacle avoidance engines. The unmanned underwater vehicle market attached to AUV sales is projected to reach USD 2.2 billion by 2030, nearly doubling its 2024 baseline. Manufacturers are rolling out hybrid designs that cruise autonomously to task sites before switching to tethered mode for precision work, limiting deck crew needs and reducing crane cycles. Ocean-class prototypes now carry interchangeable tool skids ranging from torque tools to seabed samplers, broadening commercial use cases. Defense buyers see value in these hybrids for covert MCM operations requiring wide-area search and local neutralization. Meanwhile, smaller inspection-class AUVs proliferate among survey contractors seeking efficient asset-light business models. Fleet operators emphasize open-API control systems to integrate third-party analytics, suggesting software ecosystems will become a decisive differentiator.
ROV platforms dominate capex budgets where real-time human oversight, such as valve actuation or emergency intervention, is mandatory. However, the unmanned underwater vehicle market share attributed to heavy-work-class ROVs will slip by 3 to 4 percentage points as autonomous capabilities mature. Suppliers respond by embedding supervised autonomy that reduces pilot workload and extends tether length limits. Energy companies view these incremental upgrades as an affordable bridge from legacy operations to full autonomy, ensuring continued ROV relevance through 2030. Defense researchers also retrofit ROVs with AI vision modules to support rapid threat classification during spot checks. Collectively, these solutions reinforce demand for multi-role vehicles that flex between man-in-the-loop and hands-off modes depending on mission profile.


By Application: Defense Leadership Meets Commercial Acceleration
Defense retained 39.67% of 2024 turnover, reflecting sustained funding for undersea dominance programs among NATO and Indo-Pacific partners. Rising submarine proliferation and mine warfare demands propel the acquisition of large-displacement UUVs capable of week-long patrols. Simultaneously, commercial users are scaling their fleets to monitor an offshore wind pipeline expected to exceed 100 GW by 2030, driving a 7.67% CAGR for that segment. Scientific institutes occupy a stable third position as climate-monitoring missions expand under the UN Ocean Decade umbrella, funneling grants toward modular sensor pods and biogeochemical samplers. Emerging niches such as aquaculture, underwater archaeology, and port security collectively add incremental demand but remain below 5% of revenue through the forecast window.
Defense adoption is migrating from one-off experimentation toward program-of-record procurement, locking in multi-year production schedules that stabilize supplier cash flows. Procurement officers prioritize open-mission system architectures enabling rapid payload swaps to address ISR, ASW, or MCM tasks without new hull designs. Commercial growth rests on the economic logic of substituting autonomous inspection for crewed vessel days, particularly as ESG mandates tighten. Offshore operators value standardized data products that feed directly into digital twin models, shortening fault-diagnosis cycles. Scientific users champion extreme endurance and low-signature design, often co-funding novel power systems that later spill into commercial markets. This cross-pollination accelerates technology diffusion and positions science programs as living testbeds.
By Propulsion Type: Electric Systems Accelerate Market Transformation
Electric thrusters powered by lithium-ion and hydrogen fuel-cell energy packs secured 52.45% of 2024 sales and are trending toward a 60% threshold by 2030 on an 8.12% CAGR. Extended range, minimal acoustic output, and regulatory support for zero-emission offshore operations underpin this rise. The market size of unmanned underwater vehicles associated with electric systems is forecasted to add USD 850 million over the next five years, outpacing non-electric counterparts. Fuel-cell hybrids are gaining pilot-project traction for long-range ISR routes exceeding 2,500 km without recharge. Co-located docking hubs further shorten non-productive time, allowing smaller battery packs and improving payload ratios.
Non-electric systems based on diesel generators and silver-zinc batteries meet specialized endurance demands but face tightening environmental scrutiny. Developers pursue efficient catalytic converters and exhaust scrubbers to extend the technology’s lifecycle in military niches. Energy-harvesting solutions, including trailing-line turbines and ocean-thermal engines, remain pre-commercial yet attract R&D subsidies due to their theoretical endurance. Component vendors are standardizing high-efficiency brushless motors and low-noise propeller geometries across electric and hybrid builds, driving economies of scale that lower entry price points.
By System: Propulsion Leadership Yields to Collision-Avoidance Innovation
Propulsion packages formed the largest system grouping at 27.32% of 2024 revenue, yet the fastest growth is seen in collision-avoidance suites, posting a 7.55% CAGR. Swarm concepts and congested operating theaters place a premium on obstacle detection, combining synthetic aperture sonar, machine-learning-based classifier banks, and short-range optical sensors. Regulators require redundant perception stacks before authorizing fully autonomous missions near critical infrastructure, elevating this subsystem’s strategic value. The market size of unmanned underwater vehicles for collision-avoidance components is forecasted to double by 2030 as fleet operators retrofit legacy hulls to meet safety mandates.
Navigation and communication modules evolve toward AI-assisted sensor fusion, enabling map-aware guidance that adjusts to environmental variability in tidal flows and salinity layers. High-bandwidth acoustic modems with adaptive bit-rate control mitigate spectrum congestion, although payload telemetry remains a bottleneck. Sensors and payloads trend toward modular plug-and-play formats with auto-discovery protocols, accelerating integration cycles. Chassis suppliers concentrate on drag-reduction geometry and composite pressure vessels to accommodate heavier energy packs without compromising maneuverability.

By Size: Medium Platforms Lead While Small Systems Surge
Medium vehicles dominated 2024 shipments with 43.71% share, balancing payload capacity, endurance, and launch-and-recovery simplicity. Small systems, however, are logging an 8.21% CAGR, driven by lower capital cost and rapid deployability for short-haul missions. Advances in miniaturized navigation and energy storage pave the way for multi-vehicle swarms performing simultaneous site surveys, lowering per-coverage-mile costs. Fleet operators appreciate the redundancy and risk-distribution benefits, especially in contested zones with elevated attrition risk.
Large and extra-large units cater to specialized military and deep-sea science tasks, such as seabed mapping beyond 4,000 m or clandestine payload delivery. DARPA’s Manta Ray exemplifies this segment, validating hydrodynamic tabs that harvest ocean currents for propulsion. While unit volumes remain low, the headline technology feeds downstream innovations in hull coatings and power management that trickle into smaller classes. As training pipelines mature, operators form mixed-size fleets that allocate the right vehicle to each mission phase, raising fleet-wide utilization and squeezing more value from capital budgets.
By Depth Rating: Medium Depth Dominance Challenged by Deep-Water Expansion
Systems rated for medium depth continue to hold a 47.76% share due to the prevalence of continental-shelf energy assets and coastal defense requirements. Deepwater platforms exhibit a 7.75% CAGR as the resource industry pushes exploration beyond 3,000 m and marine science targets abyssal ecosystems.[3]ACS Publications, “Autonomous Ocean Carbon Observations,” acs.org Pressure-neutral batteries remove depth-related derating, allowing consistent performance throughout the water column. Hull designers are adopting titanium alloys and carbon-fiber composites that maintain structural integrity while trimming weight.
Shallow water units address harbor security and aquaculture inspection, where agility trumps endurance. These platforms exploit optical communications in clear water to transmit high-definition imagery in real time. Some operators integrate aerial drones as surface relays, achieving hybrid above-below situational awareness. Collectively, depth segmentation reveals a gradual shift from one-size-fits-all solutions toward mission-tailored fleets optimized for specific ocean strata.
Geography Analysis
North America maintained a 34.22% revenue lead in 2024, anchored by Pentagon initiatives such as CAMP and DARPA’s Manta Ray, along with robust Gulf of Mexico inspection demand. Canadian Arctic sovereignty patrols and Mexican offshore field developments add supplementary pull. Regional growth accelerates to a 6.1% CAGR for 2025-2030 as mandatory inspection cycles tighten and defense procurement shifts from rapid prototyping to serial production. State-level incentives for clean-energy supply chains also stimulate regional battery and fuel-cell manufacturing, reducing logistical friction for US vehicle integrators.
Asia-Pacific registers the highest expansion at 8.01% CAGR. China is exporting extra-large UUVs to regional partners while pursuing indigenous swarm analytics, broadening the addressable base. Australia’s Ghost Shark and India’s XLUUV deals collectively exceed USD 2 billion in programmed funding, underpinning a multi-vendor ecosystem.[4] H. I. Sutton, “World XLUUVs,” hisutton.com Japan’s scientific glider networks and South Korea’s autonomous mine-hunting upgrades further illustrate diversified regional demand. Supply-chain resilience remains a watch item given reliance on imported cobalt and rare-earth inputs for high-density batteries.
Europe leverages mature offshore wind and oil-and-gas infrastructures alongside naval modernization in Germany, Norway, and the United Kingdom. Cooperative security exercises like SeaSEC 2025 promote joint technology validation, accelerating standardization and cross-border procurement. Meanwhile, Middle East and Africa markets build momentum from new exploration and production concessions and port security upgrades; recent uncrewed surface vessel demonstrations underscore cross-domain synergies in autonomous maritime operations. South American adoption remains nascent but aligns with Brazil’s pre-salt field activities and Colombia’s cable-security requirements.

Competitive Landscape
The provider ecosystem is fragmented, with the top five vendors accounting for less than 50% of global turnover, indicating moderate concentration. Incumbent defense contractors leverage long-standing naval relationships yet face agile rivals specialized in AI and modular robotics. Strategic differentiation centers on autonomy algorithms, open-architecture command-and-control, and lifecycle support offerings that convert capital sales into recurring services. Oceaneering, Kongsberg Discovery, and Anduril secured positions on the US LDUUV prototype roster, underscoring the value placed on rapid iteration and field-ready prototypes.
Mergers and acquisitions (M&A) activity is trending upward as sensor specialists and battery integrators become attractive tuck-in targets for platform builders seeking vertical integration. Nauticus Robotics exemplifies disruptive entrants by fielding transformable hybrids that toggle between AUV and ROV modes, challenging the traditional separation of manipulation and survey missions. Intellectual-property portfolios increasingly focus on AI-enabled navigation stacks, collision-avoidance classifiers, and standardized data ontologies that support plug-and-play payload adoption. Suppliers achieving early compliance with ABS or DNV autonomous class notations gain market preference as operators place growing weight on regulatory assurance.
Pricing competition continues for small and mid-size vehicles, where barriers to entry are low. Vendors differentiate via cloud-native mission-planning suites, over-the-air firmware updates, and training simulators that shorten crew onboarding. After-sales support models are shifting to subscription tiers covering spare parts, software updates, and analytics dashboards, smoothing revenue volatility. Collectively, these dynamics favor companies that orchestrate ecosystems rather than sell stand-alone hardware.
Unmanned Underwater Vehicle Industry Leaders
Kongsberg Gruppen ASA
Teledyne Technologies Incorporated
Saab AB
Oceaneering International, Inc.
Fugro N.V.
- *Disclaimer: Major Players sorted in no particular order

Recent Industry Developments
- April 2025: HII delivered the first two Lionfish small unmanned undersea vehicles (SUUVs) to the US Navy as part of a program that may expand to 200 vehicles, with a potential contract value of USD 347 million.
- April 2025: Anduril Industries delivered its first Dive-LD AUV to the US Navy's Unmanned Undersea Vehicle Squadron 1 (UUVRON-1). This delivery advances the Navy's expansion of unmanned undersea capabilities and integration of autonomous systems into its operations.
- February 2025: Kongsberg Discovery completed acceptance testing and delivered its HUGIN Superior AUV system to the US Navy. The successful delivery of the first HUGIN Superior system under this contract indicates Kongsberg's AUV technology will support the US Navy's undersea operations.


Global Unmanned Underwater Vehicle Market Report Scope
| Autonomous Underwater Vehicles (AUVs) |
| Remotely Operated Vehicles (ROVs) |
| Defense |
| Commercial |
| Scientific Research |
| Others |
| Electric |
| Non-Electric |
| Others |
| Propulsion Systems |
| Collision Avoidance Systems |
| Navigation Systems |
| Communication Systems |
| Sensors |
| Payloads |
| Chassis |
| Small |
| Medium |
| Large and Extra-Large |
| Shallow |
| Medium |
| Deep |
| North America | United States | |
| Canada | ||
| Mexico | ||
| Europe | United Kingdom | |
| France | ||
| Germany | ||
| Italy | ||
| Spain | ||
| Rest of Europe | ||
| Asia-Pacific | China | |
| India | ||
| Japan | ||
| South Korea | ||
| Australia | ||
| Rest of Asia-Pacific | ||
| South America | Brazil | |
| Rest of South America | ||
| Middle East and Africa | Middle East | United Arab Emirates |
| Saudi Arabia | ||
| Rest of Middile East | ||
| Africa | South Africa | |
| Rest of Africa | ||
| By Vehicle Type | Autonomous Underwater Vehicles (AUVs) | ||
| Remotely Operated Vehicles (ROVs) | |||
| By Application | Defense | ||
| Commercial | |||
| Scientific Research | |||
| Others | |||
| By Propulsion Type | Electric | ||
| Non-Electric | |||
| Others | |||
| By System | Propulsion Systems | ||
| Collision Avoidance Systems | |||
| Navigation Systems | |||
| Communication Systems | |||
| Sensors | |||
| Payloads | |||
| Chassis | |||
| By Size | Small | ||
| Medium | |||
| Large and Extra-Large | |||
| By Depth Rating | Shallow | ||
| Medium | |||
| Deep | |||
| By Geography | North America | United States | |
| Canada | |||
| Mexico | |||
| Europe | United Kingdom | ||
| France | |||
| Germany | |||
| Italy | |||
| Spain | |||
| Rest of Europe | |||
| Asia-Pacific | China | ||
| India | |||
| Japan | |||
| South Korea | |||
| Australia | |||
| Rest of Asia-Pacific | |||
| South America | Brazil | ||
| Rest of South America | |||
| Middle East and Africa | Middle East | United Arab Emirates | |
| Saudi Arabia | |||
| Rest of Middile East | |||
| Africa | South Africa | ||
| Rest of Africa | |||


Key Questions Answered in the Report
What is the projected revenue for the Unmanned Underwater Vehicle (UUV) market in 2030?
The unmanned underwater vehicle market was valued at USD 4.01 billion in 2025 and is projected to advance to USD 5.58 billion by 2030, reflecting a 6.83% CAGR.
Which vehicle type is growing fastest through 2030?
Autonomous underwater vehicles post the strongest 9.54% CAGR, driven by AI-enabled autonomy.
Which region delivers the highest growth rate?
Asia-Pacific is expected to advance at an 8.01% CAGR, led by naval modernization and offshore energy expansion.
Why are electric propulsion systems gaining share?
Battery and fuel-cell advances yield longer range and meet stricter ESG rules, lifting electric share past 60% by 2030.
How are operators extending UUV endurance?
Autonomous seabed recharge hubs and pressure-neutral batteries enable multi-month deployments without surfacing.
What restrains wider adoption among smaller fleets?
High acquisition costs and underwater communication bandwidth constraints currently limit faster uptake.
Page last updated on:


