Submarine Simulation Market Size and Share
Market Overview
| Study Period | 2019 - 2030 |
|---|---|
| Market Size (2025) | USD 1.67 Billion |
| Market Size (2030) | USD 2.49 Billion |
| Growth Rate (2025 - 2030) | 8.32% CAGR |
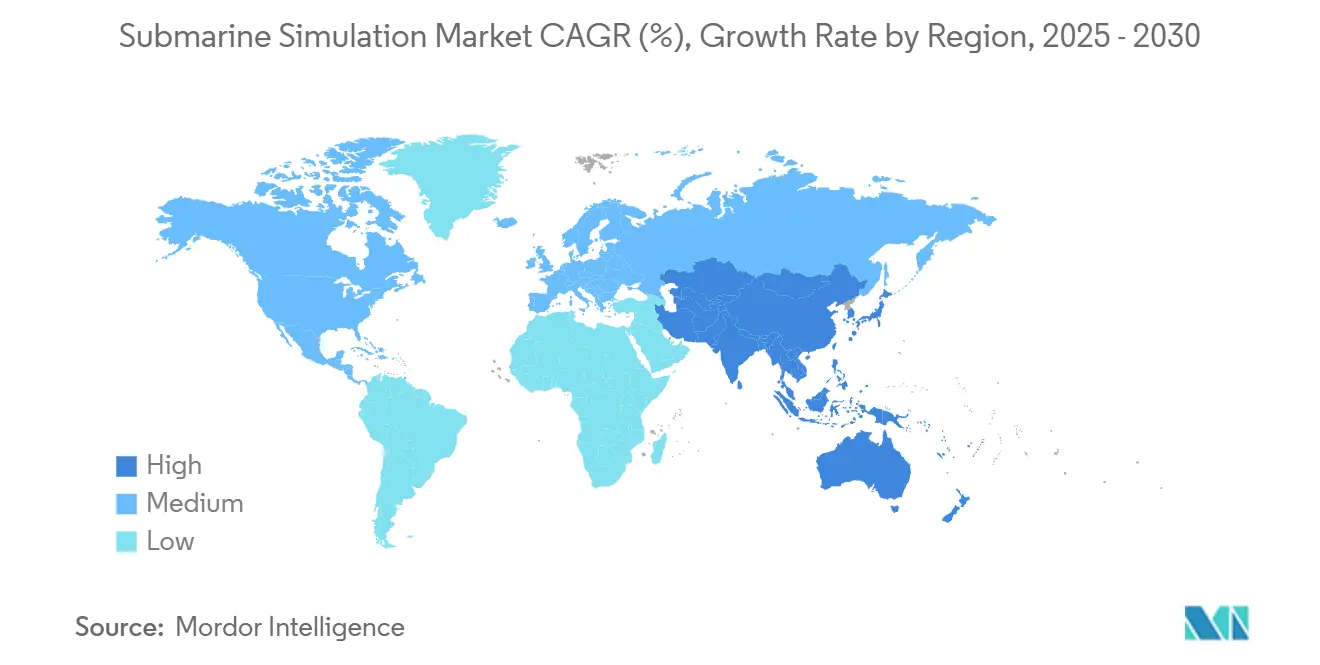
| Fastest Growing Market | Asia Pacific |
| Largest Market | North America |
| Market Concentration | High |
Major Players *Disclaimer: Major Players sorted in no particular order Image © Mordor Intelligence. Reuse requires attribution under CC BY 4.0. | |

Submarine Simulation Market Analysis by Mordor Intelligence
The submarine simulation market size is valued at USD 1.67 billion in 2025 and is forecasted to climb to USD 2.49 billion by 2030, advancing at an 8.32% CAGR. Robust program funding from major navies and the need to shorten real-world sea time underpins steady demand for virtual underseawarfare environments. Defense agencies now fuse artificial intelligence, digital twins, and cloud-hosted digital ranges so crews can rehearse sensor fusion, electronic warfare, cyber security, and space-based cueing inside a single synthetic scenario. Platform complexity is also rising: new nuclear and air-independent-propulsion boats require longer familiarization pipelines, driving procurement of high-fidelity engineering plant and damage-control trainers. Meanwhile, cost containment pressures favor simulators over live exercises, pushing procurement officers to weigh life-cycle savings against acquisition outlays. Vendors that prove measurable readiness gains, secure accreditation to classified networks, and deliver open-architecture content libraries are winning the most follow-on awards.
Key Report Takeaways
- By simulator type, full-mission tactical systems held 44.92% of the submarine simulation market share in 2024, while VR/AR solutions are projected to expand at an 11.55% CAGR through 2030.
- By application, crew operational training accounted for 49.23% of the submarine simulation market size in 2024; autonomous/USV-UUV control training is forecasted to accelerate at a 9.54% CAGR to 2030.
- By end user, naval forces commanded 65.12% revenue share in 2024, whereas research institutes recorded the highest projected CAGR at 10.87% through 2030.
- By deployment mode, on-premise fixed installations captured 51.76% of 2024 revenue, yet cloud/SaaS platforms are forecast to grow at a 12.35% CAGR to 2030.
- North America held 39.49% of 2024 global revenue, and Asia-Pacific showed the fastest regional growth, at an 8.69% CAGR over the outlook period.
Global Submarine Simulation Market Trends and Insights
Drivers Impact Analysis*
| Driver | % Impact on CAGR Forecast | Geographic Relevance | Impact Timeline |
|---|---|---|---|
| Rising multi-domain warfare complexity driving need for integrated submarine mission simulation | +1.80% | North America and Europe lead, global adoption follows | Medium term (2-4 years) |
| Cost pressures prompting navies to adopt virtual training over at-sea exercises | +1.50% | APAC and other budget-sensitive navies | Short term (≤ 2 years) |
| Increased deployment of AIP and nuclear submarines requiring new-system familiarization | +1.20% | North America, Europe, APAC | Long term (≥ 4 years) |
| Adoption of cloud-based distributed simulation enabling coalition training | +0.90% | NATO and AUKUS navies | Medium term (2-4 years) |
| Digital-twin integration for lifecycle support and predictive maintenance | +0.70% | Advanced naval markets worldwide | Long term (≥ 4 years) |
| AI-generated dynamic threat environments enhancing tactical readiness | +0.60% | Technology-leading fleets globally | Medium term (2-4 years) |
| Source: Mordor Intelligence | |||
Rising Multi-Domain Warfare Complexity Driving Integrated Submarine Mission Simulation
Contemporary subs must share data with surface ships, maritime patrol aircraft, and space assets, forcing crews to master joint-force tactics far beyond legacy periscope engagements. US Naval War College research on China’s post-2018 reforms shows the PLAN now trains with theater-level targeting links, prompting procurement of simulators that fuse sonar, electronic support, cyber payloads, and satellite channels inside one scenario. Contractors embed machine-learning threat generators that reshape acoustic and RF spectra in real time so watch teams practice fluid responses. Demand is strongest in North America and Europe. Yet, export programs in the Indo-Pacific are accelerating as regional alliances seek interoperable trainers capable of modeling electromagnetic congestion and anti-access tactics.
Cost Pressures Prompting Navies to Adopt Virtual Training Over At-Sea Exercises
The US Navy’s maintenance backlog kept more than one-third of its attack-sub fleet pier-side during 2024, pushing commanders to shift non-critical evolutions ashore into simulators. Virtual pipelines cut fuel, crew overtime, and range support costs while letting instructors run high-tempo serials without risking hulls. The Royal Navy’s multi-site VR bridge rollout shows how immersive headsets and replica consoles can compress basic navigation curricula from weeks at sea to days in a lab. Asia-Pacific buyers, facing tight procurement ceilings, now specify repeatable synthetic gunnery, rescue, and damage-control modules to offset expensive live-fire schedules.
Increased Deployment of AIP and Nuclear Submarines Requiring New-System Familiarization
Germany, Sweden, and South Korea all advance air-independent-propulsion lines, while Australia commits to nuclear boats under AUKUS. Each propulsion shift obliges fresh engineering, radiation, and casualty-control syllabi that legacy trainers cannot replicate. Rheinmetall’s VTAM solution renders hydrogen fuel-cell behavior, battery management, and stealth profiles so diesel crews can transfer to AIP hulls without elongated pier-side instruction. In parallel, Elbit’s Dreadnought contract supports UK ballistic-missile vessels with nuclear-plant emulators and strategic systems coupling, illustrating long-term demand for ultra-specialized reactor and weapons modules.
Adoption of Cloud-Based Distributed Simulation Enabling Coalition Training
Kongsberg Digital’s K-Sim Navigation CLOUD lets schools from Norway to Australia join a common exercise without shipping hardware, satisfying NATO and AUKUS mandates for standardized tactics rehearsal.[1] Kongsberg Digital, “Improves the Quality of Maritime Navigation Training with Cloud-Based Simulation,” kongsbergdigital.com Server-side hydrodynamic engines broadcast to low-cost workstations, cutting upfront spend and easing curriculum updates. The US Naval Air Warfare Center promotes live-virtual-constructive frameworks that blend instrumented ranges with shore-based students, an approach that scales joint anti-submarine warfare (ASW) drills across multiple time zones. Medium-term growth hinges on cybersecurity accreditation, but proof-of-concept events already validate latency and acoustic-ray fidelity for multinational operations.
Restraints Impact Analysis*
| Restraint | % Impact on CAGR Forecast | Geographic Relevance | Impact Timeline |
|---|---|---|---|
| High acquisition and integration cost of high-fidelity hydro-acoustic models | -1.10% | Global, budget-constrained fleets | Short term (≤ 2 years) |
| Cyber-security concerns over connecting simulators to classified networks | -0.80% | All markets | Medium term (2-4 years) |
| Shortage of submarine-experienced instructors limiting simulator throughput | -0.60% | APAC and emerging navies | Medium term (2-4 years) |
| Limited standardisation hindering multi-vendor interoperability | -0.40% | NATO coalition venues | Long term (≥ 4 years) |
| Source: Mordor Intelligence | |||
High Acquisition and Integration Cost of High-Fidelity Hydro-Acoustic Models
True-to-life propagation engines demand years of sea-trial data and petaflop computing to solve fluid dynamics, making unit prices tough for modest fleets. Kongsberg Maritime invested more than 140 person-years in its NEPTUNE core, reflecting barriers that deter new entrants and delay public-sector tenders. Some buyers phase procurements, first acquiring desktop software and later scaling to full-mission domes, but the pipeline still strains defense budgets in Southeast Asia and South America.
Cyber-Security Concerns Over Connecting Simulators to Classified Networks
Zero-trust mandates now gate every system linking to secret C4I fabrics. US Naval Sea Systems Command SBIR calls stipulate end-to-end encryption, container isolation, and supply-chain attestation for extended-reality devices. Achieving an Authority-to-Operate can add 12-18 months to deployment schedules and force costly hardware redesigns. International deals face additional ITAR hurdles when instructors from multiple nationalities share protected threat libraries or reactor data, compressing some coalition use-cases until standardized cross-domain solutions mature.
*Our forecasts treat driver/restraint impacts as directional, not additive. The impact forecasts reflect baseline growth, mix effects, and variable interactions.
Segment Analysis
By Simulator Type: VR/AR Adoption Accelerates While Full-Mission Domes Retain Primacy
Full-mission tactical domes retained a 44.92% revenue lead in 2024 thanks to cradle-to-grave coverage of navigation, sonar, weapons, and machinery drills. Yet VR/AR suites post an 11.55% CAGR, the fastest within the submarine simulation market, as head-mounted displays and haptic gloves let trainees rehearse watch-standing without booking scarce dome slots. Royal Navy bridge installations stream the same hydrodynamic core into immersive pods and 360-degree cylindrical screens, highlighting a hybrid roadmap that blends tactile consoles with lightweight visuals. Part-task and desktop trainers fill prerequisite gating, allowing weapons officers to memorize fire-control logic or machinists to practice start-up sequences before stepping into collective scenarios. Suppliers that offer common scenario databases and instructor-operating-station toolkits across all fidelity levels enjoy higher content reuse and reduced lifecycle cost.
Second-generation VR devices add inside-out tracking and eye-gaze metrics, letting evaluators quantify situational awareness under high cognitive load. Vendors now integrate motion platforms replicating pitch, roll, and heave cues so helmsmen can drill extreme maneuvers. Despite growth, full-mission domes remain essential for emergency blow, under-ice navigation, or coordinated multi-room drills that demand real console hardware. Consequently, buyers pursue balanced fleets: a core fixed installation for strategic systems integration, surrounded by portable VR cubicles for throughput during high-intake periods.


By Application: Autonomous Control Spurs New Curriculum
Crew operational training held 49.23% of 2024 revenue, reflecting enduring demand for periscope depth handling, contact management, and emergency drills. However, autonomous/USV-UUV control modules rise at a 9.54% CAGR as commanders task submarines with launching and supervising unmanned assets. Scenario designers embed synthetic wing-men that feed sonar returns or mine-field data to watch teams, forcing officers to manage multiple platforms concurrently. Combat-system test and evaluation environments let engineers stress novel fire-control code under realistic loads, closing software feedback loops faster than sea trials. Subsystem prototyping modules host digital twins of hull treatments, masts, and auxiliary machinery, aiding design houses before steel-cut. Maintenance and damage-control packages replicate flooding, toxic gas, and fire in compartment-level fidelity, letting damage-control parties practice under live smoke. At the same time, instructors monitor casualties from a control room.
Autonomy curricula also teach AI-generated course suggestions that sonar chiefs must validate before execution. The rise of synthetic crewmates—speech-enabled agents that fill vacant billets—allows single-student sessions, freeing scarce instructors for complex multi-ship events. As navies formalize unmanned doctrine, training authorities pivot from flying a UUV to orchestrating a heterogeneous swarm, elevating software-defined tactics inside virtual oceans.
By End User: Academic Research Institutes Gain Momentum
Naval forces comprised 65.12% of spending in 2024, anchored by US, UK, French, and Japanese fleet recapitalization programs. Yet research institutes chart a 10.87% CAGR, the highest across the submarine simulation market, as governments fund human-machine teaming labs and cognitive-load studies to refine next-decade control rooms. UMass Lowell’s Navy-backed manufacturing workforce hub exemplifies this shift, placing advanced simulators in technical universities so students can prototype additive-manufactured hull inserts or rehearse lean shipyard flows. Shipbuilders employ simulators for yard-acceptance trials, letting crews test software loads before delivery. Commercial offshore firms adopt mini-subs and remotely operated vehicles for inspection, creating niche demand for acoustic environments that mimic deepwater drilling fields.
Academic consortia also benchmark fidelity frameworks, publishing peer-reviewed metrics on behavioral transfer that guide procurement specifications. Their findings feed back into naval curricula, ensuring future acquisition cycles embed proven learning science rather than vendor-defined benchmarks.

By Deployment Mode: Cloud Gains Share Amid Security Hurdles
On-premise fixed sites secured 51.76% of 2024 turnover because classified threat libraries and reactor data seldom leave hardened vaults. Even so, cloud/SaaS offerings advance at a 12.35% CAGR, bolstered by subscription pricing and elastic compute that models entire littoral zones on demand. Norway’s K-Sim Navigation CLOUD demonstrates how server-side updates roll out new weapon models to dozens of schools overnight, compressing configuration management overhead.[2]Kongsberg Maritime, “Engine Room Simulator Catalog,” pdf.nauticexpo.com Containerized mobile suites, deploying to forward bases or allied partner yards during fleet visits, serve expeditionary requirements.
Yet achieving an Authority-to-Connect remains labor-intensive. Vendors encrypt traffic with quantum-resistant algorithms and implement air-gap gateways so red-side training lanes never touch blue operational data. Hybrid “cloud-in-a-box” designs—rack-mounted servers shipped to customer sites—provide a bridge solution, retaining cloud orchestration while satisfying data-sovereignty statutes.
Geography Analysis
North America contributed 39.49% of 2024 revenue, spurred by the USD 951 million BlueForge Alliance industrial-base contract and a USD 563 million US Navy simulator award to J.F. Taylor.[3]LaGrone, Sam, “Navy’s Single Sub Buy Plan Raises Concerns,” USNI News, news.usni.org The region benefits from deep supply chains, mature acquisition pathways, and ongoing Virginia- and Columbia-class build programs. Ranges that merge live under-ice events with shore students further entrench demand for high-bandwidth, secure links. However, congressional scrutiny over a one-boat FY2025 purchase signals fiscal headwinds, motivating program offices to prove simulator ROI in readiness metrics.
Asia-Pacific posts an 8.69% CAGR, the fastest in the submarine simulation market, underpinned by China’s realistic training overhaul and Australia’s transition to nuclear propulsion. Canberra fields AUD 1.49 billion in FY2025 submarine acquisition funds and AUD 245.4 million for associated infrastructure, including multi-level security simulators able to host US combat system code. Singapore, India, and South Korea adopt fast-craft tactical suites and AIP reactor labs to hedge against local shipyard bottlenecks.
Thanks to VTAM rollouts in Germany, Dreadnought trainers in the UK, and Thales sonar labs in France, Europe maintains a robust share. NATO interoperability requirements drive investment in standard scenario formats such as Exercise Management Language, ensuring crews from different nations can plug into a joint synthetic battlespace. Procurement cycles favor firms that deliver cross-domain solutions validated by the NATO Communications and Information Agency.

Competitive Landscape
The submarine simulation market displays high concentration. The top suppliers, including Kongsberg Gruppen ASA, BAE Systems plc, Rheinmetall AG, ATLAS ELEKTRONIK GmbH, and Indra Sistemas, S.A., hold long-term umbrella contracts that bundle hardware, software, and instructor services. Their differentiators include proprietary hydro-acoustic cores, validated maneuvering databases, and digital-twin toolchains that span concept design through fleet sustainment. Trusted-supplier status, hard-won through years of classified work, remains a decisive barrier; only a handful of vendors possess the facility clearances and domain models to emulate nuclear propulsion plants accurately.
Strategic partnerships are reshaping competition. BAE Systems’ purchase of Bohemia Interactive Simulations adds game-engine agility, allowing faster scenario authoring for VR classrooms. Rheinmetall teams with academic labs on physiological monitoring so instructors can score stress adaptation, a factor gaining weight in submarine watch-bill management. Cloud enablers such as Microsoft Azure Government and Amazon Web Services Secret Region align with defense primes to deliver guarded compute back-ends. However, they must integrate vendor acoustic libraries and hardware-in-the-loop gateways for high-fidelity runs.
White-space opportunities center on autonomous-systems supervision, cross-reality collaboration, and automated performance analytics. Start-ups offering AI-driven debrief summaries or eye-tracking-based situational-awareness gauges find traction as sub-components within prime-contractor ecosystems. Still, certification timelines and export-control hurdles restrict rapid disruption, preserving incumbent share in the medium term.
Submarine Simulation Industry Leaders
Kongsberg Gruppen ASA
BAE Systems plc
Rheinmetall AG
ATLAS ELEKTRONIK GmbH
Indra Sistemas, S.A.
- *Disclaimer: Major Players sorted in no particular order


Recent Industry Developments
- September 2025: QinetiQ secured a contract to develop a simulation system for the UK Dreadnought-class ballistic missile submarines. The system will support personnel training on these platforms.
- March 2025: Kongsberg Maritime unveiled the K-Sim Offshore DP3 Anchor Handling Simulator after a USD 322,000 upgrade to its Aberdeen facility.
- September 2024: J.F. Taylor received a USD 563 million US Navy simulation contract, one of the decade’s largest single awards.
- February 2024: NAVSEA issued an XR SBIR topic emphasizing zero-trust compliance for shipyard simulators.


Global Submarine Simulation Market Report Scope
| Full-Mission Tactical Simulators |
| Part-Task and Desktop Trainers |
| VR/AR Simulators |
| Crew Operational Training |
| Combat System Testing and Evaluation |
| Subsystem Design and Prototyping |
| Maintenance and Damage-Control Training |
| Autonomous/USV-UUV Control |
| Naval Forces |
| Defense Contractors and Shipbuilders |
| Research Institutes and Academia |
| Commercial Offshore and Energy Operators |
| On-Premise Fixed Installation |
| Mobile Containerised Solutions |
| Cloud/SaaS |
| North America | United States | |
| Canada | ||
| Europe | United Kingdom | |
| France | ||
| Germany | ||
| Italy | ||
| Russia | ||
| Rest of Europe | ||
| Asia-Pacific | China | |
| India | ||
| Japan | ||
| South Korea | ||
| Australia | ||
| Rest of Asia-Pacific | ||
| South America | Brazil | |
| Rest of South America | ||
| Middle East and Africa | Middle East | Israel |
| United Arab Emirates | ||
| Qatar | ||
| Rest of Middle East | ||
| Africa | South Africa | |
| Rest of Africa | ||
| By Simulator Type | Full-Mission Tactical Simulators | ||
| Part-Task and Desktop Trainers | |||
| VR/AR Simulators | |||
| By Application | Crew Operational Training | ||
| Combat System Testing and Evaluation | |||
| Subsystem Design and Prototyping | |||
| Maintenance and Damage-Control Training | |||
| Autonomous/USV-UUV Control | |||
| By End User | Naval Forces | ||
| Defense Contractors and Shipbuilders | |||
| Research Institutes and Academia | |||
| Commercial Offshore and Energy Operators | |||
| By Deployment Mode | On-Premise Fixed Installation | ||
| Mobile Containerised Solutions | |||
| Cloud/SaaS | |||
| By Geography | North America | United States | |
| Canada | |||
| Europe | United Kingdom | ||
| France | |||
| Germany | |||
| Italy | |||
| Russia | |||
| Rest of Europe | |||
| Asia-Pacific | China | ||
| India | |||
| Japan | |||
| South Korea | |||
| Australia | |||
| Rest of Asia-Pacific | |||
| South America | Brazil | ||
| Rest of South America | |||
| Middle East and Africa | Middle East | Israel | |
| United Arab Emirates | |||
| Qatar | |||
| Rest of Middle East | |||
| Africa | South Africa | ||
| Rest of Africa | |||


Key Questions Answered in the Report
What is the current size and projected growth of the submarine simulation market?
The submarine simulation market size stands at USD 1.67 billion in 2025 and is forecasted to reach USD 2.49 billion by 2030, reflecting a 8.32% CAGR.
Which simulator type is expanding most rapidly?
VR/AR-based solutions post the fastest growth with an 11.55% CAGR through 2030.
Why are navies migrating to cloud-hosted training platforms?
Cloud simulators cut hardware costs, support distributed coalition exercises, and receive instant content updates while maintaining high-fidelity physics engines.
How do air-independent-propulsion and nuclear boats influence training demand?
New propulsion systems require specialized reactor and fuel-cell emulators, driving procurement of higher-fidelity engineering and damage-control trainers.
What are the main barriers to wider simulator adoption?
High hydro-acoustic model costs, stringent cyber-security accreditation, limited instructor availability and interoperability gaps remain key constraints.
Which region shows the strongest growth outlook?
Asia-Pacific leads regional expansion with an 8.69% CAGR, fueled by Chinese modernization and Australia’s nuclear-sub transition under AUKUS.
Page last updated on:


