Autonomous Ships Market Size and Share
Market Overview
| Study Period | 2019 - 2031 |
|---|---|
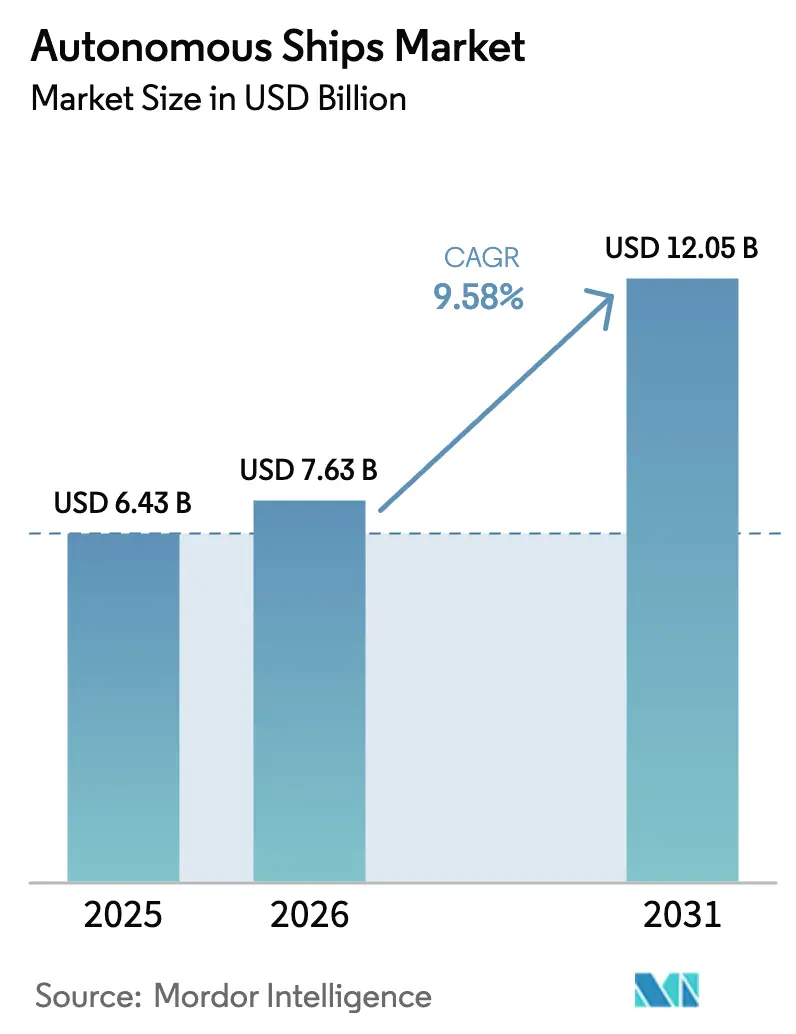
| Market Size (2026) | USD 7.63 Billion |
| Market Size (2031) | USD 12.05 Billion |
| Growth Rate (2026 - 2031) | 9.58% CAGR |
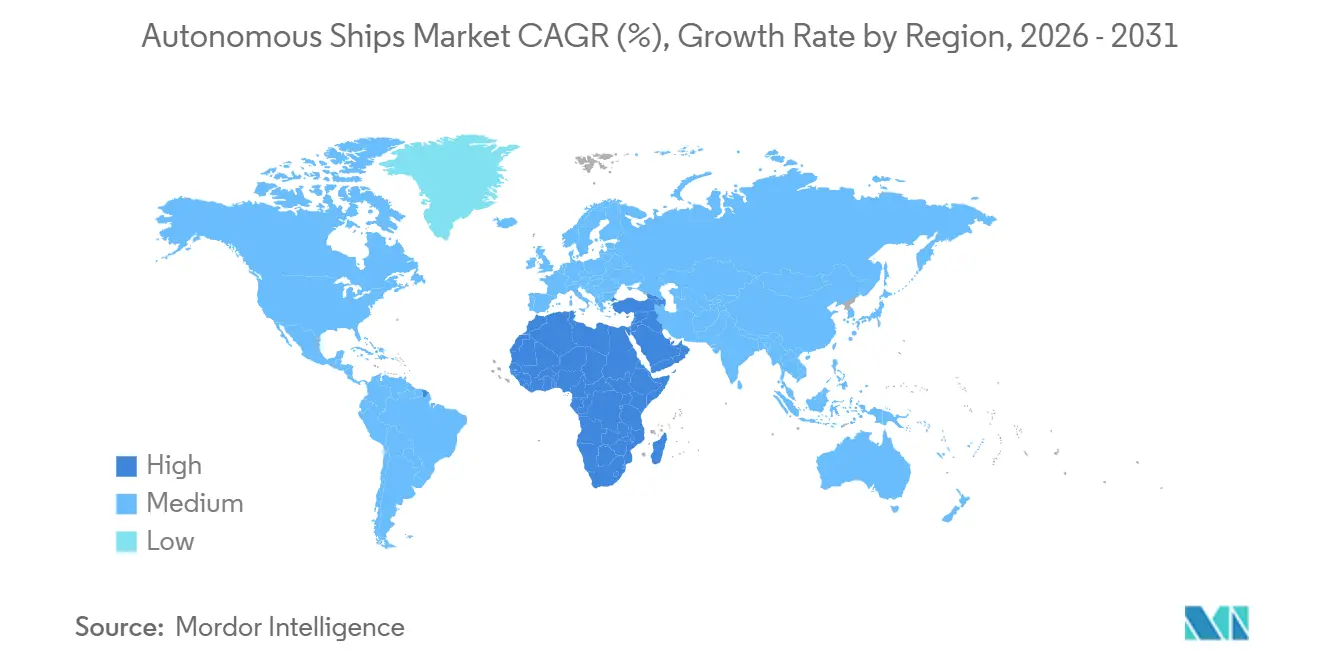
| Fastest Growing Market | Middle East and Africa |
| Largest Market | Asia Pacific |
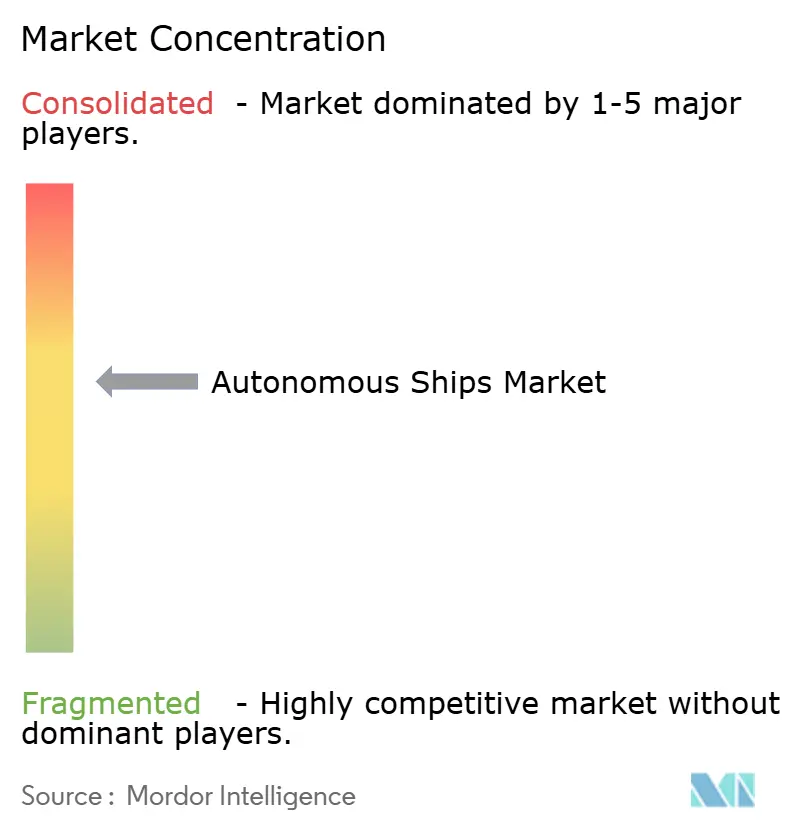
| Market Concentration | Medium |
Major Players *Disclaimer: Major Players sorted in no particular order Image © Mordor Intelligence. Reuse requires attribution under CC BY 4.0. | |
Autonomous Ships Market Analysis by Mordor Intelligence
The autonomous ships market size is expected to grow from USD 6.90 billion in 2025 to USD 7.63 billion in 2026 and is forecasted to reach USD 12.05 billion by 2031 at a 9.58% CAGR over 2026-2031. Consistent investment by commercial operators to meet decarbonization mandates, paired with rising defense procurement budgets for unmanned surface vessels (USVs), sustains robust demand. Vessel owners are prioritizing trim optimization, weather-routing software, and remote-pilotage modules that reduce fuel consumption and crew-rotation costs. Governments in Asia-Pacific, North America, and Europe are funding test beds and regulatory sandboxes to accelerate certification. At the same time, low-Earth-orbit (LEO) connectivity and edge AI processors resolve bandwidth and latency constraints. Hardware sales remain dominant today; however, software revenues are scaling faster as digital-twin modeling and cybersecurity analytics monetize existing sensor footprints. Competitive intensity is moderate: deep domain expertise in naval architecture, sensor fusion, and maritime law favors incumbent marine-equipment suppliers, whereas start-ups gain traction with modular retrofit kits for short-sea operators.
Key Report Takeaways
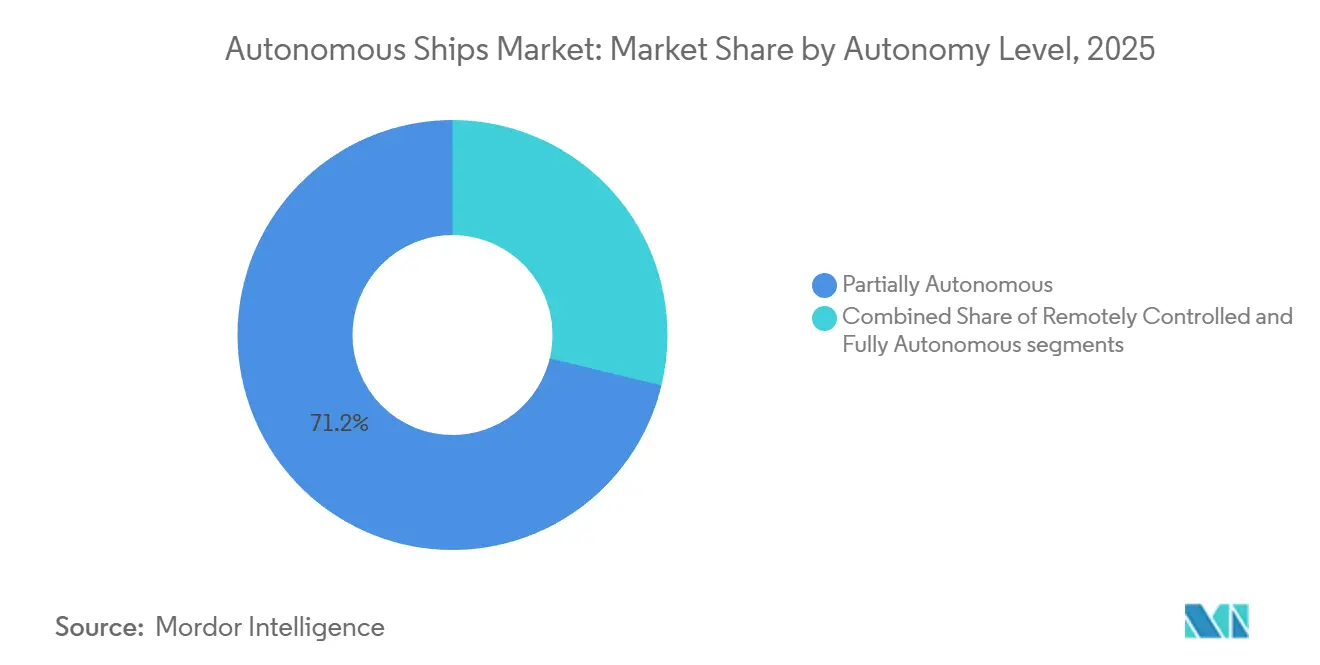
- By autonomy level, partially autonomous vessels held 71.24% of the autonomous ships market share in 2025, while fully autonomous platforms are projected to advance at a 17.54% CAGR through 2031.
- By component, hardware captured 64.41% of the autonomous ships market in 2025; software is slated to expand at a 13.65% CAGR through 2031.
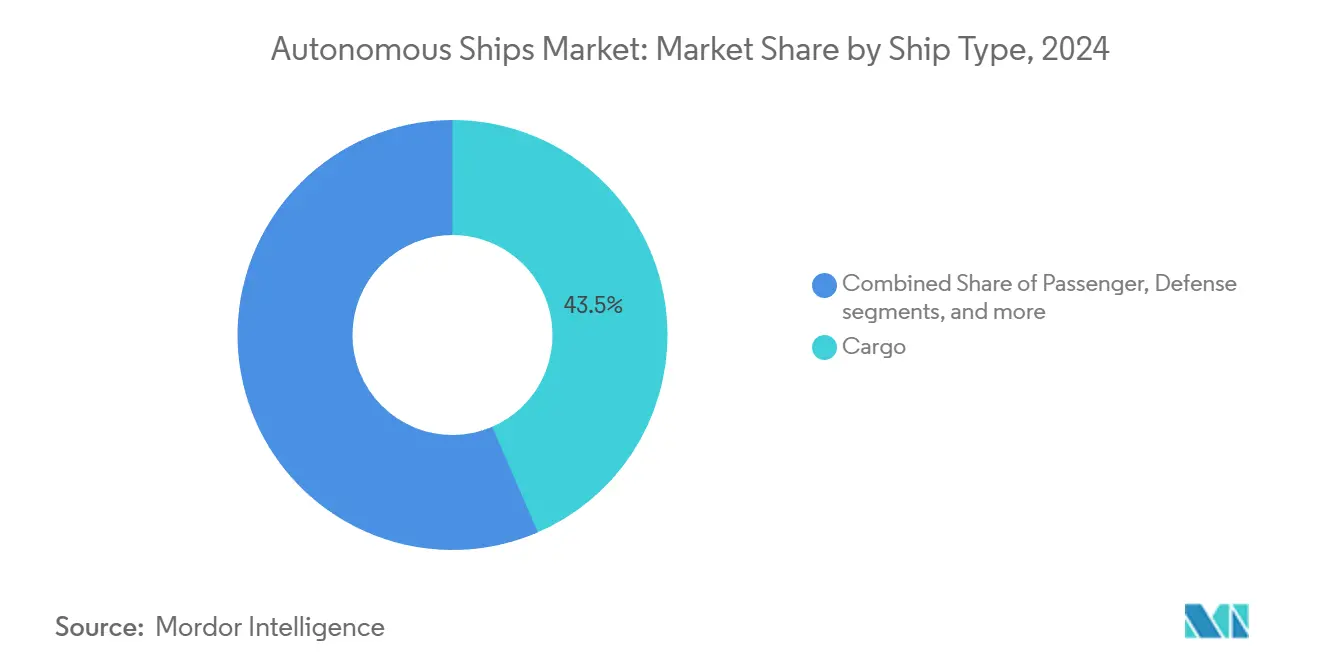
- By ship type, cargo vessels led with a 43.50% revenue share in 2025; defense applications are forecasted to post a 15.10% CAGR through 2031.
- By end user, commercial operators held a 67.89% share of the autonomous ships market size in 2025, while the government and military segment is projected to climb at a 16.70% CAGR through 2031.
- By propulsion, conventional engines accounted for 79.10% of the autonomous ships market in 2025; fully electric systems are projected to grow at a 16.30% CAGR during 2026-2031.
- By geography, the Asia-Pacific region secured the largest slice, accounting for 41.35% in 2025, whereas the Middle East and Africa segment is poised for a 13.60% CAGR from 2026 to 2031.
Note: Market size and forecast figures in this report are generated using Mordor Intelligence’s proprietary estimation framework, updated with the latest available data and insights as of January 2026.
Global Autonomous Ships Market Trends and Insights
Drivers Impact Analysis*
| Driver | (~) % Impact on CAGR Forecast | Geographic Relevance | Impact Timeline |
|---|---|---|---|
| Data-driven fleet optimization and remote operations | +1.8% | Global, early uptake in Northern Europe and Asia–Pacific | Medium term (2-4 years) |
| Decarbonization and fuel efficiency mandates | +2.1% | Global, spurred by EU ETS and IMO CII roll-outs | Long term (≥ 4 years) |
| Rising demand for advanced situational-awareness suites | +1.5% | North America, Europe, Asia–Pacific | Short term (≤ 2 years) |
| Development of next-generation autonomous vessels | +1.3% | Asia–Pacific core and Northern Europe | Medium term (2-4 years) |
| Defense demand for USVs | +1.9% | North America, Europe, Middle East | Medium term (2-4 years) |
| Edge-AI and 5G/LEO connectivity breakthrough | +1.2% | Global, infrastructure dense in Asia–Pacific and North America | Long term (≥ 4 years) |
| Source: Mordor Intelligence | |||
Data-Driven Fleet Optimization and Remote Operations
Fleet owners are building onshore control rooms that stream engine telemetry, weather feeds, and AIS traffic from several vessels simultaneously, allowing a single certified navigator to supervise up to six ships in real-time.[1]Source: Kongsberg Maritime, “REACH Remote Operations,” kongsberg.com Central dashboards replace traditional watch rotations, enabling operators to reduce bridge headcount, minimize travel expenses for crew changes, and achieve 24-hour specialist oversight without incurring overtime or voyage bonuses. Predictive maintenance algorithms flag bearing wear, injector fouling, and hull drag before failures strand a ship, shrinking unplanned off-hire days that erode charter revenue. Schedule reliability also improves because shore teams can re-route around sudden swell forecasts or berth congestion without waiting for the master to review multiple reports. Near-coast Ku-band links handle routine data; LEO satellites now provide sub-50 ms latency mid-ocean, allowing control centers to maintain deterministic command loops even during Pacific crossings. Hybrid system design keeps collision-avoidance logic resident on the vessel, guaranteeing that sudden bandwidth dips never degrade core safety functions during busy traffic separations or fog-bound harbor entries.
Decarbonization and Fuel Efficiency Propel Autonomous Ships
The IMO Carbon Intensity Indicator and the EU Emissions Trading System imposed a hard price on every gram of CO2 emitted per ton-mile, prompting operators to adopt AI-driven voyage planning that reduces fuel consumption by 5-12% on Asia–Europe and transpacific lanes in 2024. Wärtsilä’s Fleet Optimisation Solution cross-references updated weather grids, charter-party time bars, and berth availability to suggest least-cost speed schedules that still hit arrival windows, earning class-verified carbon credits for compliant owners. Edge-AI then modulates trim tabs and variable-pitch propellers in seconds, a response rate that no human crew can sustain over multi-week passages. This precise load control extends the sweet spot of dual-fuel ammonia or methanol engines, accelerating the earning curve for alternative propulsion combinations that support the IMO 2050 net-zero trajectory. Reduced bunker consumption also lowers cargo owners’ Scope 3 footprints, strengthening charter demand for fleets that verify emissions with tamper-proof sensor logs. Finally, optimized engine loading reduces maintenance intervals, providing operators with an additional margin of error during volatile freight cycles.
Rising Demand for Advanced Situational-Awareness Suites
Autonomous navigation now relies on probabilistic intent prediction rather than static closest-point-of-approach triggers, so radar, LiDAR, and electro-optical feeds are fused in real-time to anticipate course changes by nearby craft. Furuno’s FAR-3000 solid-state radar detects small fiberglass boats at 96 nm and injects Doppler data into motion models that distinguish genuine collision vectors from drifting debris.[2]Source: Furuno Electric, “FAR-3000 Radar,” furuno.com Complementary LiDAR arrays generate centimeter-level point clouds out to 200 m, mapping mooring lines, unlit buoys, and even floating timber, which empowers automated tugs and ferries to berth unaided while maintaining class-required safety margins. The US Coast Guard advises redundancy across dissimilar sensors to prevent a single failure mode from disabling the vessel, nudging buyers toward multi-vendor architectures and driving demand for retrofitting with plug-and-play sensor expansion slots. Integrated displays also lower navigator workload by reducing false positives by 60%, freeing attention for weather avoidance and cyber-incident alerts that grow as bandwidth climbs.
Development of Next-Generation Autonomous Vessels
Yards in China, Japan, and South Korea have shifted from bolt-on kits to purpose-built hulls where autonomy gear is baked into the steel. CSSC’s 2024 “Da Zhi” bulk carrier hides LiDAR wiring inside fairings and routes redundant power rails to rack-mounted AI processors under the bridge wing, minimizing EMI and easing class inspection. Japan’s MEGURI2040 consortium completed three domestic ferry trials in 2025, logging crew-equivalent safety rates while validating automated berthing at piers with tight tidal windows. HD Hyundai now markets autonomy-ready blueprints that integrate fiber-optic sensor trunks and triple-redundant steering actuators as standard, allowing owners to postpone software activation until regulators align, thereby avoiding costly structural rewiring later. Purpose-designed decks omit accommodation blocks, lowering windage and saving several hundred tons of steel, which translates into extra cargo or fuel capacity and better trim under variable sea states.
Restraints Impact Analysis*
| Restraint | (~) % Impact on CAGR Forecast | Geographic Relevance | Impact Timeline |
|---|---|---|---|
| Cybersecurity vulnerabilities | -1.4% | Global, heightened in the Black Sea and South China Sea | Short term (≤ 2 years) |
| Regulatory fragmentation and flag-state variance | -1.6% | Global, most acute in Europe and Asia–Pacific | Medium term (2-4 years) |
| High retrofit capital expenditure | -1.3% | Global, pressing for bulk and tanker fleets | Medium term (2-4 years) |
| Marine-insurance and liability uncertainties | -1.1% | Global, slow harmonization in emerging registries | Long term (≥ 4 years) |
| Source: Mordor Intelligence | |||
Cyber-Security Vulnerabilities of Remote Navigation Stacks
Spoofed GPS signals in the Black Sea during 2024 pushed autonomous trial craft up to 30 nm off course.[3]Source: Cybersecurity and Infrastructure Security Agency, “GPS Spoofing Advisory,” cisa.gov They forced emergency manual overrides, showing how easily attackers can exploit over-the-air navigation dependencies. Because shore control relies on always-on IP tunnels, a single compromised operations center could, in theory, redirect multiple vessels or freeze helm commands. NIST’s 2025 maritime cyber framework mandates encrypted satellite channels, multi-factor login tokens, and continual sensor-baseline checks that flag position reports deviating from inertial navigation dead-reckoning. Operators are now installing isolated safety controllers that execute hard-wired collision-avoidance maneuvers in the event of latency spikes or checksum failures, providing last-resort resilience comparable to that used in aircraft flight-control systems. Insurers reward fleets that can demonstrate such layered defenses with premium discounts, thereby pushing cyber hardening from an optional to a commercial imperative.
Regulatory Fragmentation and Flag-State Variance
The IMO’s Maritime Autonomous Surface Ships Code remains in draft in 2026, so coastal states fill the vacuum with jurisdiction-specific rules that complicate transit planning. Norway permits fully autonomous sailings inside twelve trial fjords but still requires remote oversight for harbor approaches; Singapore demands remote pilots for every autonomous draft within its Strait, and the UK insists on at least one onboard safety officer during initial voyages. These divergent mandates force shipowners to keep hybrid bridges, negating half the crew savings that autonomy promises and raising training costs because officers must switch between rule sets mid-route. Liability also becomes fragmented: current bunker-spill conventions assign fault to the owner; however, incidents triggered by software bugs blur accountability among the owner, integrator, and code supplier, so operators face patchwork insurance endorsements. Until a harmonized treaty passes, voyage planners will steer clear of restrictive corridors, limiting economies of scale for early adopters.
*Our forecasts treat driver/restraint impacts as directional, not additive. The impact forecasts reflect baseline growth, mix effects, and variable interactions.
Segment Analysis
By Autonomy Level: Hybrid Control Dominates Near-Term Deployments
Partially autonomous vessels commanded 71.24% of the autonomous ships market size in 2025, underscoring owner preference for systems that deliver immediate crew-cost and fuel-burn savings, while still leaving a licensed mariner in charge when rules become ambiguous or traffic density spikes. These bridge-assist packages automate collision-avoidance inputs, dynamic power management, and voyage optimization while preserving manual control for berthing, pilotage, and emergency maneuvers, which keeps flag-state inspectors comfortable and insurers willing to underwrite at conventional deductibles. Fully autonomous hulls remain a niche market, but their 17.54% CAGR through 2031 signals a shift once statistical safety evidence accumulates and standardized class notations reduce regulatory uncertainty. Remotely controlled craft sit between the two, allowing shore teams to assume command whenever the onboard AI flags an anomaly. However, cognitive-load research caps each operator at roughly six simultaneous vessels, meaning fleetwide scaling hinges on usable human–machine interfaces. DNV’s 2025 tiered notation, which maps cleanly onto the IMO taxonomy, now supplies banks and leasing houses with a risk ladder they can price against, lowering interest spreads for higher-tier approvals.
Edge-AI leaps make that risk ladder easier to climb. Jetson Orin boards, capable of 30 frames per second object classification, enable the fusion of radar and LiDAR detections onboard, preventing latency spikes from compromising safety margins and reducing dependence on always-available backhaul links. Once regulators are ready, a software switch can remove the final human from the loop, squeezing out overtime and travel-rotation costs that still weigh on the partially autonomous operating model. Lloyd’s Market Association, however, insists on at least 10 million logged autonomous operating hours in mixed sea states before premiums fall to parity with conventional hulls, a threshold forecast around 2030 if fleet trials continue at the present clip.


By Component: Software Growth Outpaces Hardware as Edge-AI Matures
Hardware captured 64.41% of the autonomous ships market share in 2025, as every retrofit begins with a tangible kit, including LiDAR domes, solid-state X-band radar, inertial measurement units, and dual satellite antennas, which expand a vessel’s situational awareness envelope to meet class expectations. Revenue momentum now tilts toward code. Software is projected to grow at a 13.65% CAGR through 2031 as owners license digital-twin models, predictive-maintenance dashboards, and cyber-threat analytics that monetize the data from installed sensors without requiring dry-dock downtime. Rolls-Royce Intelligent Awareness already fuses radar, AIS, and video into a single view, slashing nuisance collision alarms by 60% and easing bridge fatigue. Wärtsilä’s paired digital twin and telemetry suite reduced fuel consumption by 8% in 2025 container trials by recommending hour-by-hour speed and trim adjustments that crews rarely have the capacity to calculate.
Falling component costs reinforce the pivot. Velodyne’s slide to USD 8,000 for solid-state LiDAR units in 2025, down from USD 18,000 a year earlier, opens redundant-sensor configurations to medium-tonnage owners who once balked at price tags reserved for LNG carriers. Meanwhile, AIS-spoofing incidents have made anomaly-detection modules from Thales and Raytheon part of fundamental due diligence checklists for hull insurers, ensuring steady pull-through of new subscription licenses each renewal season. The flywheel turns: more data improves software efficacy, which validates smaller sensor footprints, in turn accelerating the software’s share of the autonomous ships market.
By Ship Type: Defense Surge Outpaces Cargo Dominance
Cargo vessels represented 43.50% of the autonomous ships market size in 2025 because liners, bulkers, and tankers have the most extensive installed base and a perpetual need to trim voyage costs while complying with carbon-intensity grades. Still, defense budgets give the fastest lift. Naval and coast-guard programs will drive the defense slice at a 15.10% CAGR through 2031, as ministries view unmanned surface vessels as force multipliers that patrol chokepoints, trail submarines, or clear mines at a fraction of the daily operational costs of a frigate. European allies shadow the US with similar prototypes, and designers add modular payload bays, allowing a single hull to toggle between surveillance, hydrographic, or strike roles. Offshore support craft are gathering momentum as well: wind-farm developers are booking autonomous crew-transfer and survey boats that stay offshore for weeks without requiring hotel loads, thereby shrinking carbon budgets and workboat wages simultaneously. Passenger ferries remain a niche market but are rising steadily in Norway and Japan, where fjord mandates and shrinking coastal populations align with labor-light operations.
A vivid illustration of cost leverage can be found in surveys. Fugro’s Blue Essence autonomous vessel cut seabed-mapping bills by 30% during 2025 North Sea trials. Cargo adoption lags not for lack of interest but because retrofit invoices of USD 3 million or more must be recovered inside four years to satisfy lender covenants; only dense shuttle lanes or high-value refrigerated cargoes consistently meet that hurdle today. As LiDAR and satcom prices edge down, however, more feeder loops will slip into the economic money zone and nudge the cargo share upward again.
By End User: Government Procurement Drives Fastest Expansion
Commercial operators controlled 67.89% of the autonomous ships market share in 2025 by pursuing straight-up operating expense reductions and emission credits; the growth crown shifts to public agencies over the forecast window. Government and military buyers are expected to post a 16.70% CAGR through 2031, as capability gaps in Arctic patrol endurance, contested-littoral surveillance, and border search-and-rescue (SAR) operations outweigh cost hesitations. Capital budgets, which renew on fixed cycles regardless of freight demand, also contribute to this growth. The US Coast Guard’s Bering Sea tests prove unmanned patrols can operate in icing conditions that limit human watch rotations. At the same time, Norway’s Arctic coast guard uses similar drones to monitor quota compliance. These missions accrue geopolitical value difficult to match with civilian ROI metrics.
Public tenders also limit volatility for vendors. Multi-year framework agreements secure upgrade paths, cybersecurity support, and operator training, providing suppliers with predictable cash flows for development. Commercial momentum is far from stalled, though: Maersk’s 2025 retrofit of 12 intra-European feeders demonstrates that where voyage lengths and port states align, economics close quickly even under tight charter-party clauses. Expect other regional carriers to replicate the model once payback case studies are published.
By Propulsion: Electric Systems Gain as Battery Costs Fall
Conventional diesel engines powered 79.10% of the autonomous ships market size in 2025, and battery prices and port-side charging grants are tilting future build sheets. Fully electric drivetrains are expected to surge at a 16.30% CAGR to 2031, as energy-dense lithium-ion packs now reach 250 Wh/kg and large ports install megawatt chargers, funded by green corridor coalitions. Corvus Energy’s 6.2 MWh Orca ESS keeps Norwegian fjord ferries running 24 hours on 50-nautical-mile loops, hitting the 2026 zero-emission fjord mandate without payload trade-offs. Electric motors also pair naturally with autonomous control because instant throttle response allows collision-avoidance software to hold tighter corridors and optimize station-keeping without requiring crew thruster inputs.
Hybrid powerplants bridge the endurance gap for longer coastal hauls. ABB’s Onboard DC Grid integrates battery banks, variable-speed generators, and shore power into a single bus, reducing fuel consumption by 15-20% on dynamic positioning tasks while enabling silent, emission-free port entry. For blue-water liners, diesel will remain until solid-state or metal-air chemistries crack 600 Wh/kg. Every battery tranche added displaces auxiliary generator hours and lowers the vessel’s Carbon Intensity Indicator rating. Owners hedge by specifying future-proof conduit runs and switchgear in 2026 newbuild contracts, even when ordering conventional engines, betting that drop-in battery upgrades will clear class rules later in the decade.
Geography Analysis
Asia-Pacific held 41.35% of the autonomous ships market share in 2025, anchored by China’s intelligent-ship stimulus packages, Japan’s coastal-ferry consortia, and South Korea’s yard-level autonomy options baked into export contracts. Regional builders deliver nine out of every ten deep-sea vessels worldwide, so embedding sensor trunks and AI racks during block assembly helps keep incremental costs low. Ministries top up demand with subsidies and green-shipping tax breaks, pushing small regional lines to trial autonomy that would be uneconomic elsewhere. China’s provincial ports also carve dedicated test lanes, shortening approval lead times compared with slower flag states.
The Middle East and Africa are expected to experience the fastest growth, clocking a 13.60% CAGR through 2031. Saudi Arabia’s NEOM aims for an emissions-free logistics spine and has earmarked USD 500 million for electric, autonomous harbor craft, as well as shore-power microgrids. Meanwhile, DP World’s automation pilot at Jebel Ali has reduced berth-to-gate cycle times by 18%, convincing regional carriers to budget for similar kits. South Africa’s Transnet is upgrading six harbor tugs to enable night-shift autonomy, allowing experienced crews to focus on heavy-weather salvage.
North America and Europe advance at stable mid-single-digit rates as regulators move from sandbox to permanent codes. US Coast Guard rules that demand redundant sensor types now guide shipyard specification lists, and Norway’s twelve fjord trial zones give builders real-world data for actuarial tables. South America stays nascent; Petrobras’ 2025 offshore-support drone trial highlights the value case, but suppliers still face import tariffs and inconsistent bandwidth on Amazon and South Atlantic routes.

Competitive Landscape
The autonomous ships market exhibits moderate concentration, as compelling offerings require expertise in naval architecture, reliable supply chains for marine-rated sensors, and early access to classification society auditors. Kongsberg, Wärtsilä, and Rolls-Royce leverage decades of experience in propulsion and automation integration to package hardware, software, and lifecycle support in a single signed contract. BAE Systems and L3Harris dominate the defense corner; L3Harris’ USD 35 million 2024 order for ASView sensor-fusion suites anchors future upgrade tails and validates its IP for NATO export. Challenger firms Sea Machines Robotics and Marine AI target operators unwilling to dry-dock; their under-USD 500,000 kits bolt onto legacy bridges and have become popular on pilot boats and dredgers, where capital budgets are tight.
Patent filings spotlight hybrid control. ABB lodged 12 applications in 2025 covering LiDAR-guided autonomous docking sequences that promise to reduce tug expenses and berth damages, signaling a shift toward shoreside cost centers rather than relying solely on blue-water routing. Classification societies, led by DNV, wield growing influence; their 2025 tiered class rulebook defines what insurers will or will not cover, effectively setting technical baselines that newer ventures must meet before quoting customers. As a result, the next wave of differentiation shifts landside: vendors offering turnkey control-center build-outs with cyber-resilience, operator training, and bandwidth guarantees are finding receptive clients that view shore infrastructure as the final bottleneck to multi-vessel autonomy at fleet scale.
Autonomous Ships Industry Leaders
Kongsberg Gruppen ASA
Rolls-Royce plc
Wärtsilä Corporation
HD Hyundai Heavy Industries Co., Ltd.
BAE Systems plc
- *Disclaimer: Major Players sorted in no particular order

Recent Industry Developments
- July 2025: HD Hyundai Group and H-Line Shipping announced a strategic partnership to develop AI-powered, autonomous, and eco-friendly vessel technologies. This development highlights a strategic move towards sustainable maritime innovation, with potential to influence industry standards and drive broader adoption of AI-led solutions in the global shipping market.
- February 2024: Türkiye's Tersan Shipyard secured a contract from Norwegian ferry operator Fjord1 AS to construct four battery-powered, autonomous double-ended ferries.


Research Methodology Framework and Report Scope
Market Definitions and Key Coverage
Our study defines the autonomous ships market as all new-build and retrofit Maritime Autonomous Surface Ships (MASS) that navigate under Degree 1-4 autonomy prescribed by the International Maritime Organization, along with their required onboard and shoreside control systems, sensors, and integrated software suites.
Any human-crewed vessels equipped only with decision-support tools yet lacking remote or independent navigation functions are excluded.
Segmentation Overview
- By Autonomy Level
- Partially Autonomous
- Remotely Controlled
- Fully Autonomous
- By Component
- Hardware
- Software
- By Ship Type
- Cargo
- Passenger
- Offshore Support and Energy
- Defense
- Special Purpose
- By End User
- Commercial
- Government and Military
- By Propulsion
- Fully Electric
- Hybrid
- Conventional
- By Geography
- North America
- United States
- Canada
- South America
- Brazil
- Rest of South America
- Europe
- United Kingdom
- Germany
- France
- Italy
- Russia
- Rest of Europe
- Middle East and Africa
- Middle East
- Saudi Arabia
- United Arab Emirates
- Rest of Middle East
- Africa
- South Africa
- Rest of Africa
- Middle East
- Asia-Pacific
- China
- India
- Japan
- South Korea
- Australia
- Rest of Asia-Pacific
- North America
Detailed Research Methodology and Data Validation
Desk Research
We began with audited data sets from bodies such as the International Maritime Organization, UNCTAD's Review of Maritime Transport, Eurostat fleet registries, and U.S. Maritime Administration vessel lists, which helped outline the global population of cargo, passenger, and defense hulls that could migrate to autonomous operations. Trade association white papers (for example, BIMCO and SEA-Europe), classification-society incident logs, and company 10-K filings supplied unit costs, retrofit ratios, and regulatory milestones. Subscriber databases, D&B Hoovers for corporate revenue splits and Dow Jones Factiva for deal flow, were mined to benchmark supplier revenues and order books. The sources cited here illustrate the wider set reviewed; many additional publications were tapped for cross-checks.
Primary Research
Mordor analysts interviewed shipbuilders, autonomy-system integrators, fleet managers, insurance underwriters, and naval procurement officers across Asia-Pacific, Europe, and North America. These conversations clarified adoption timelines, average selling prices, and safety-case hurdles, letting us fine-tune penetration curves and validate secondary findings.
Market-Sizing & Forecasting
A top-down capacity and trade-flow reconstruction was first run, using annual newbuild deliveries, retrofit propensity, average autonomy kit price, defense procurement budgets, LNG-electric conversion trends, and IMO GHG rules as primary drivers. Outputs were then stress-tested against sampled bottom-up checks, supplier revenue roll-ups and port authority pilot project counts, to align totals. Multivariate regression models, with variables such as global seaborne trade ton-miles, autonomous sensor cost index, and military modernization outlays, generated the 2025-2030 forecast path. Where bottom-up evidence was thin, conservative gap fillers drew on median historical growth of adjacent marine automation segments.
Data Validation and Update Cycle
Results pass a three-layer review: model variance scans, senior-analyst sign-off, and pre-publication refresh. We reconvene expert respondents when anomalies exceed preset thresholds. Full revisions release annually, while material events (for instance, a binding IMO code) trigger interim updates.
Why Mordor's Autonomous Ships Baseline Earns Trust
Published figures often differ because firms pick varied autonomy scopes, price assumptions, or refresh cadences.
Key gap drivers include whether retrofit revenues are counted, if defense hull values are converted at replacement or procurement cost, and how learning-curve price erosion is modeled. Mordor reports current-year values in real 2025 dollars and updates our base every twelve months; others may anchor to older exchange rates or single-scenario demand views.
Benchmark comparison
| Market Size | Anonymized source | Primary gap driver |
|---|---|---|
| USD 6.96 B (2025) | Mordor Intelligence | - |
| USD 6.11 B (2024) | Global Consultancy A | Excludes military retrofits; uses fixed ASP through forecast |
| USD 8.50 B (2024) | Regional Consultancy B | Counts port service drones and small USVs outside IMO MASS scope |
| USD 6.26 B (2024) | Industry Journal C | Converts revenues at 2023 FX rates; refresh cadence biennial |
In sum, our disciplined scope, annually refreshed inputs, and dual-lens (top-down plus selective bottom-up) modeling give decision-makers a balanced, traceable baseline that stands up to scrutiny.


Key Questions Answered in the Report
What is the projected value of the autonomous ships market in 2031?
The autonomous ships market is forecasted to reach USD 12.05 billion by 2031, expanding at a 9.58% CAGR during 2026-2031.
Which segment is growing fastest within the autonomous ships market?
Fully autonomous vessels are advancing at a 17.54% CAGR, reflecting rising insurer confidence and maturing classification frameworks.
Why are defense agencies investing in autonomous ships?
Navies use USVs to extend surveillance range, conduct mine countermeasures, and enhance distributed lethality without adding crew risk.
How do low-Earth-orbit satellites benefit autonomous vessels?
LEO constellations provide 100 Mbps connectivity with sub-50 ms latency, enabling real-time telemetry, software updates, and remote supervision even on mid-ocean routes.
What factors limit rapid retrofits of bulk carriers and tankers?
High capital costs of USD 2-5 million per ship and payback periods exceeding financier thresholds discourage adoption on low-margin routes.
Which region is expected to grow fastest through 2031?
The Middle East and Africa will post a 13.60% CAGR, propelled by Saudi and UAE investments in autonomous port and corridor infrastructure.
Page last updated on:


