Market Overview
| Study Period | 2021 - 2031 |
|---|---|
| Forecast Data Period | 2026 - 2031 |
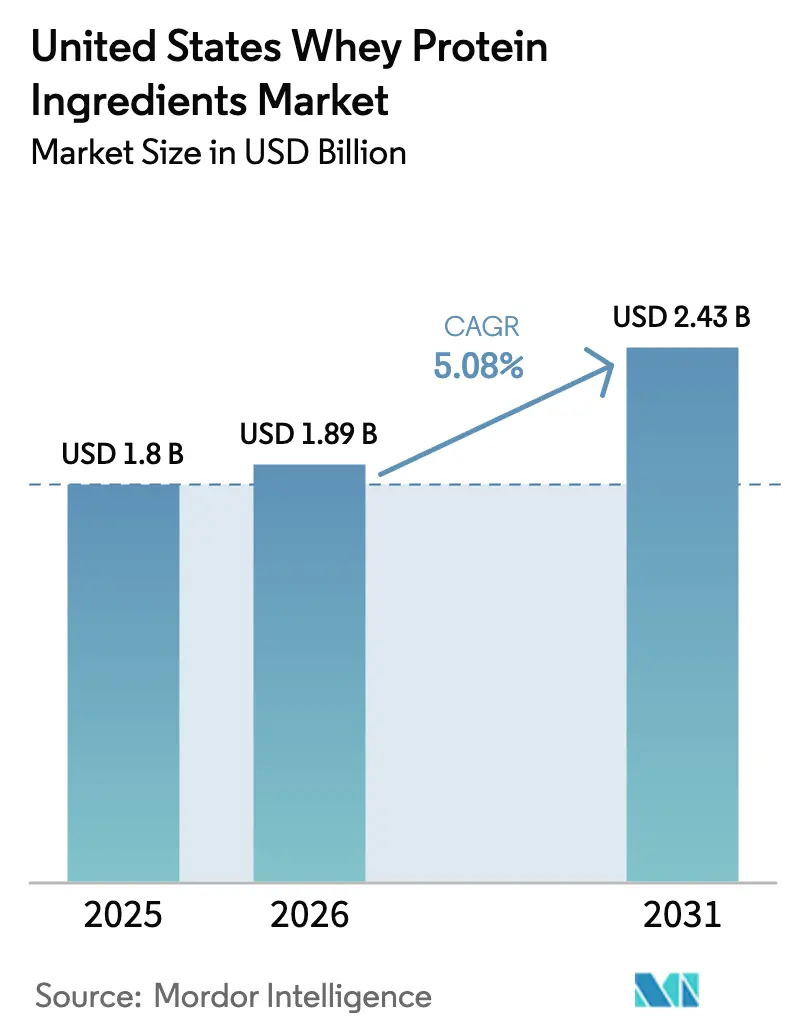
| Base Year Market Size (2025) | USD 1.8 Billion |
| Market Size (2026) | USD 1.89 Billion |
| Market Size (2031) | USD 2.43 Billion |
| Growth Rate (2026 - 2031) | 5.08% CAGR |
| Market Concentration | Medium |
Major Players
*Disclaimer: Major Players sorted in no particular order Image © Mordor Intelligence. Reuse requires attribution under CC BY 4.0. |
|
United States Whey Protein Ingredients Market Analysis by Mordor Intelligence
In 2025, the U.S. whey protein ingredients market was valued at USD 1.80 billion. Projections indicate a rise to USD 1.89 billion in 2026, eventually reaching USD 2.43 billion by 2031, marking a CAGR of 5.08% from 2026 to 2031. A notable shift towards higher-protein diets, coupled with capacity expansions in pivotal dairy states, is enhancing domestic availability and reducing reliance on imports. USDA data reveals a 4.8% year-over-year increase in whey protein concentrate output as of June 2025, with whey protein isolate volumes surging by 11.1%. This uptick underscores the confidence processors have in whey. Brands are now integrating whey beyond its traditional bodybuilding supplement realm, incorporating it into fortified coffees, infant formulas, meal-replacement snacks, and even high-end skincare products. While Glanbia faced pricing challenges in the first half of 2025, the dairy giant's optimism is evident in the USD 11 billion worth of U.S. dairy processing investments announced through 2028. These investments suggest a belief in long-term gains, even amidst short-term margin pressures.
Key Report Takeaways
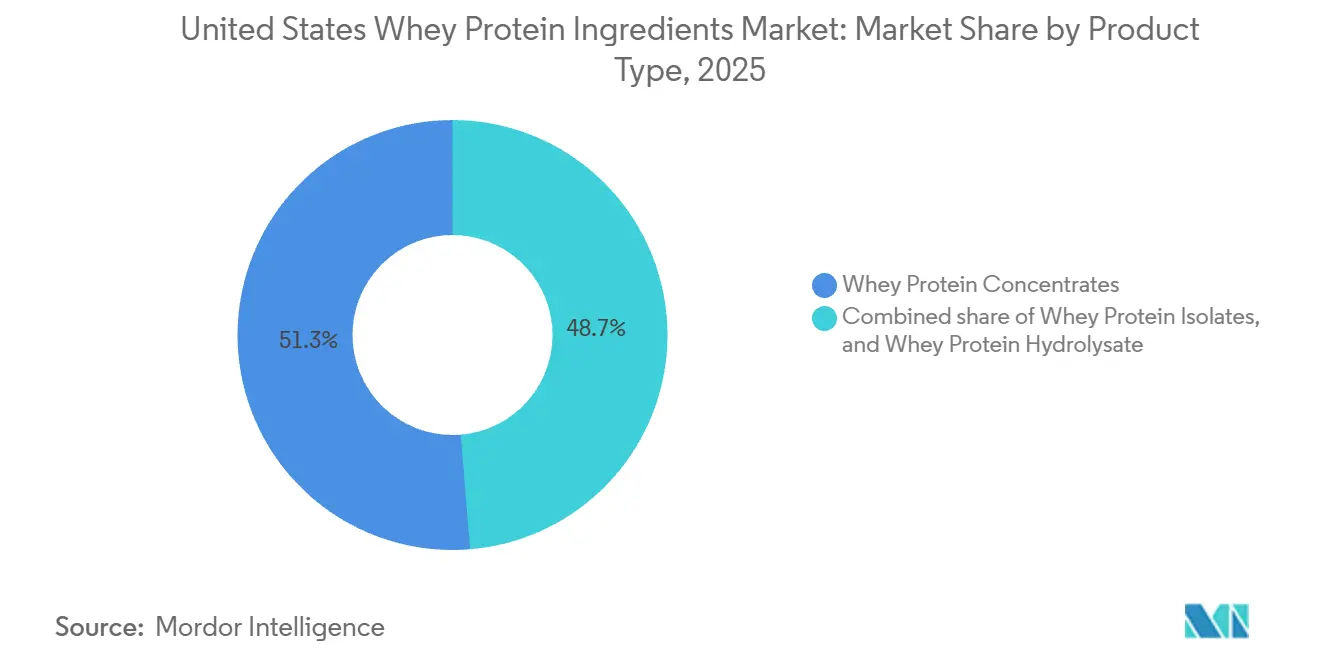
- By product type, whey protein concentrates led with 51.31% of the United States whey protein ingredients market share in 2025, while whey protein hydrolysates are projected to grow the fastest at a 5.57% CAGR through 2031.
- By form, powders captured 85.6% of the United States whey protein ingredients market size in 2025, whereas liquid formats are advancing at a 6.01% CAGR between 2026 and 2031.
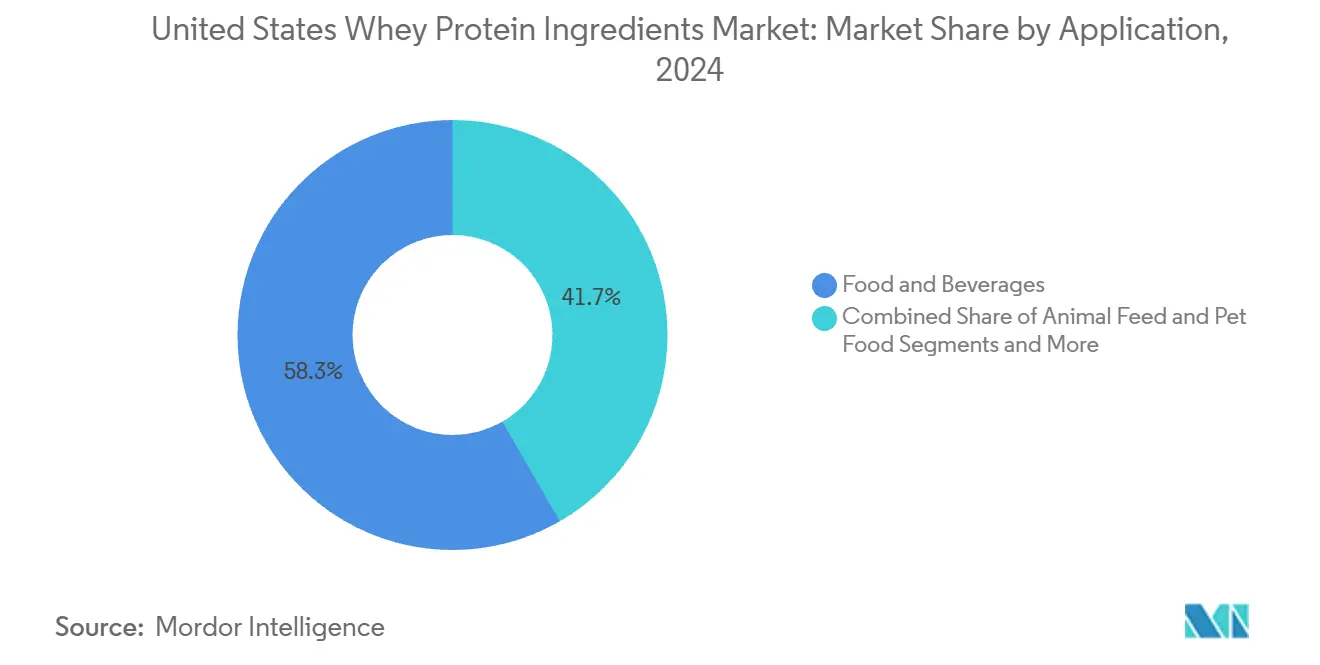
- By application, food and beverages accounted for 58.32% of the United States whey protein ingredients market size in 2025, and personal care and cosmetics is expanding at a 5.98% CAGR to 2031.
Note: Market size and forecast figures in this report are generated using Mordor Intelligence’s proprietary estimation framework, updated with the latest available data and insights as of January 2026.
United States Whey Protein Ingredients Market Trends and Insights
Drivers Impact Analysis*
| Drivers | (~) % Impact on CAGR Forecast | Geographic Relevance | Impact Timeline |
|---|---|---|---|
| Surge in health consciousness and demand for protein-rich diets | +1.2% | National, concentrated in coastal urban centers and Sun Belt states | Medium term (2-4 years) |
| Integration into functional foods and beverages for daily nutrition | +1.0% | National, with early adoption in California, Texas, Florida | Long term (≥ 4 years) |
| Expansion of sports nutrition and fitness supplement sector | +0.9% | National, strongest in metropolitan areas with high gym density | Short term (≤ 2 years) |
| Clean-label preferences driving minimally processed whey options | +0.7% | National, premium segments in Northeast and West Coast | Medium term (2-4 years) |
| Innovation in flavored and ready-to-mix protein formulations | +0.6% | National, retail-driven in convenience and grocery channels | Short term (≤ 2 years) |
| Technological advancements in whey processing for higher purity | +0.5% | National, led by Wisconsin, Idaho, California production hubs | Long term (≥ 4 years) |
| Source: Mordor Intelligence | |||


Surge in Health Consciousness and Demand for Protein-Rich Diets
Health-conscious Americans are shifting away from carbohydrate-heavy diets and increasingly prioritizing protein consumption. According to data from the Centers for Disease Control and Prevention's National Health and Nutrition Examination Survey, adults aged 19-50 increased their daily protein intake by an average of 8 grams between 2019 and 2024[1]Source: The Centers for Disease Control and Prevention (CDC), "Ultra-processed Food Consumption in Youth and Adults: United States, August 2021–August 2023", cdc.gov. This rise is primarily driven by the growing adoption of whey-based supplements and fortified foods. The demand for protein is no longer limited to athletes; it now includes office workers, seniors addressing sarcopenia, and parents seeking convenient, nutritious options for their children. Whey, with its complete amino acid profile and high leucine content, is particularly effective in promoting muscle protein synthesis—a benefit that has gained recognition among mainstream consumers beyond the bodybuilding community. The increasing availability of high-protein snack bars, yogurt drinks, and breakfast cereals containing whey concentrates highlights the integration of sports nutrition science into everyday eating habits.
Integration into Functional Foods and Beverages for Daily Nutrition
Whey protein is making its way from the supplement aisle into mainstream grocery categories, broadening its market reach but reducing the protein content per serving. Beverage makers are infusing coffee drinks, plant-based milk alternatives, and even sparkling waters with whey isolates, achieving 10-15 grams of protein per serving while maintaining taste and texture. The U.S. Dairy Export Council noted in its 2025 annual report that domestic use of whey protein in functional beverages surged by 14% year-over-year, outpacing the growth of exports. In bakeries, whey protein concentrates are now partially substituting wheat flour in bread and muffin recipes, enhancing protein density and moisture retention. This subtle enhancement strategy resonates with consumers seeking nutritional advantages without the overt associations of a protein shake, seamlessly integrating whey into everyday pantries rather than relegating it to a specialized supplement.
Expansion of Sports Nutrition and Fitness Supplement Sector
Whey protein, traditionally dominated by competitive athletes, is now increasingly favored by casual gym-goers and home fitness enthusiasts. According to the American Dairy Products Institute's 2025 market overview, demand for whey protein isolate in sports supplements surged by 9% in 2024, predominantly driven by ready-to-drink formats. The post-pandemic landscape, with its emphasis on home workouts and boutique studio memberships, has expanded the audience for recovery-focused nutrition. Premium pre-workout and intra-workout formulations are now embracing whey protein hydrolysates, celebrated for their rapid digestion and lower allergenic properties. As the segment matures, brands are shifting their competitive focus. No longer solely emphasizing protein content, they now highlight sourcing transparency, grass-fed certifications, and third-party testing, marking a transition from commodity-based competition to a value-added approach.
Clean-Label Preferences Driving Minimally Processed Whey Options
As consumers grow wary of artificial ingredients and lengthy additive lists, whey protein formulation strategies are evolving. In response, processors are introducing "clean-label" whey concentrates and isolates, emphasizing minimal processing, steering clear of synthetic sweeteners, and obtaining non-GMO or organic certifications. While the U.S. Food and Drug Administration's guidance on "natural" claims lacks formal standardization in 2025, it has nonetheless spurred manufacturers to reformulate products, aligning with consumer desires for ingredient simplicity[2]Source: The U.S. Food and Drug Administration, "FDA Finalizes Updated “Healthy” Nutrient Content Claim", fda.gov. Grass-fed whey, derived from pasture-raised cows, is priced at a 15-20% premium over its conventional counterpart, yet it's witnessing swifter growth in natural and specialty retail channels. This surge is intertwined with sustainability narratives, as clean-label branding often champions animal welfare and environmental stewardship. However, processors face a dilemma: how to uphold clean labels while ensuring solubility, flavor neutrality, and shelf stability for mass-market appeal. This challenge tends to benefit technically adept suppliers, sidelining more commodity-focused producers.
Restraints Impact Analysis*
| Restraints | (~) % Impact on CAGR Forecast | Geographic Relevance | Impact Timeline |
|---|---|---|---|
| Regulatory complexity for infant nutrition and medical food application | -0.4% | National, FDA jurisdiction with state-level enforcement variations | Long term (≥ 4 years) |
| Rising popularity of plant-based and alternative proteins | -0.8% | National, strongest in urban coastal markets | Medium term (2-4 years) |
| Lactose intolerance and dairy sensitivity among a portion of the population | -0.5% | National, higher prevalence in Asian-American and Hispanic communities | Long term (≥ 4 years) |
| Increasing scrutiny around animal agriculture and sustainability concerns | -0.6% | National, concentrated in environmentally conscious demographics | Medium term (2-4 years) |
| Source: Mordor Intelligence | |||
Rising Popularity of Plant-Based and Alternative Proteins
In categories like sports nutrition and meal replacements, where whey once reigned supreme, pea, soy, and rice proteins are now taking center stage. Data from the American Dairy Products Institute reveals that in 2024, sales of plant-based proteins in the U.S. not only grew but did so at a rate surpassing that of whey proteins. This trend underscores a dual shift: a growing embrace of dietary choices like veganism and flexitarianism, and a calculated move by food brands to resonate with eco-conscious consumers. While whey’s animal origin was once heralded as a mark of quality, it has become a drawback in markets increasingly swayed by sustainability narratives. The gap between plant-based and whey proteins is closing; advancements in processing are softening the once-dominant earthy flavors and gritty textures of plant proteins. In response, whey processors are launching transparency initiatives, such as carbon footprint labeling and collaborations in regenerative agriculture. However, these initiatives demand significant capital and a unified approach across the diverse dairy supply chains.
Regulatory Complexity for Infant Nutrition and Medical Food Application
Stringent FDA regulations dictate the use of whey protein in infant formulas and medical nutrition products, focusing on protein quality, microbiological standards, and labeling. In 2024, the FDA, responding to a 2022 supply crisis, issued new guidance for infant formula manufacturing. This guidance introduced heightened testing and traceability mandates, leading to increased compliance costs for whey suppliers. Medical foods, as defined by the Orphan Drug Act, must adhere to specific nutrient profiles and follow Good Manufacturing Practice regulations, which are more stringent than those for standard foods. These regulatory complexities pose challenges for smaller whey processors, hindering product innovation cycles. Any formulation change necessitates validation studies and regulatory review. The situation is further complicated by state-level enforcement discrepancies. For example, California's Proposition 65 mandates warnings for trace contaminants, imposing labeling challenges not seen in other states. Such a fragmented regulatory landscape benefits larger, vertically integrated suppliers with specialized compliance teams, resulting in a market share consolidation among a select few players.
*Our forecasts treat driver/restraint impacts as directional, not additive. The impact forecasts reflect baseline growth, mix effects, and variable interactions.
Segment Analysis
By Product Type: Concentrates Dominate, Hydrolysates Accelerate
In 2025, Whey Protein Concentrates dominated 51.31% of the U.S. market due to their cost-effective protein ratio and versatility. With 35-80% protein content by weight, they retain lactose and bioactive compounds, enhancing flavors and textures in bakery, confectionery, and processed meat products. USDA data reported 40,715 thousand pounds of whey protein concentrate production in March 2025, an 8.5% year-over-year decline, reflecting inventory adjustments after overproduction. Prices averaged USD 0.357 per pound in Saputo's fiscal 2024, down from prior-year peaks as Hilmar Cheese Company's USD 600 million Dodge City, Kansas plant began operations. Commoditization pressures highlight the need for differentiation through non-GMO certifications, grass-fed sourcing, and customized protein-to-lactose ratios.
Whey Protein Hydrolysate, growing at a 5.57% CAGR through 2031, is driven by demand in medical nutrition and elite sports recovery for rapid amino acid delivery. Enzymatic pre-digestion breaks peptide bonds, forming di- and tri-peptides for faster absorption. In November 2024, Arla Foods launched a hydrolysate line targeting infant formula and clinical nutrition, citing FDA recognition of reduced allergenicity as a key driver. With a 40-60% price premium over isolates, hydrolysates are limited to high-value applications where performance outweighs cost. Production requires precise pH and temperature control to avoid bitterness, historically limiting supply. As techniques improve and economies of scale develop, hydrolysates are expected to expand into mainstream sports nutrition, though bitterness remains a challenge for formulation.


By Form: Powder Leads, Liquid Gains Momentum
In 2025, powder formats dominated 85.6% of the U.S. whey protein ingredients market due to their cost efficiency, long shelf life, and ease of transport. Powdered whey concentrates and isolates, with protein densities of 70-90% and low moisture content, remain the preferred choice for supplement manufacturers, food processors, and animal feed formulators. This dominance is supported by extensive spray-drying infrastructure in key dairy hubs like Wisconsin, California, and Idaho, enabling bulk storage and global distribution. However, the market share of powders is gradually declining as ready-to-drink protein beverages and liquid supplements gain traction. According to the U.S. Dairy Export Council's 2025 trade summary, domestic liquid whey protein usage rose by 18% in 2024, driven by convenience retail and e-commerce growth.
Liquid whey protein formats, growing at a 6.01% CAGR through 2031, are the fastest-expanding segment as consumers prioritize convenience and taste. Ready-to-drink shakes, coffee creamers, and fortified beverages eliminate mixing and texture issues, appealing to on-the-go consumers and those avoiding traditional supplement routines. The FDA's 2024 updates on liquid dietary supplement labeling and stability testing reduced regulatory hurdles for manufacturers. While liquid formats face challenges like protein aggregation during thermal processing and shorter shelf life, advancements in ultra-high-temperature processing and aseptic packaging have extended stability to 12-18 months. Growth is further fueled by private-label products, with retailers offering store-brand liquid protein items at 20-30% lower prices than national brands, making liquid formats more accessible and mainstream.
By Application: Food Dominates, Personal Care Emerges
In 2025, the Food and Beverages sector accounted for 58.32% of U.S. whey protein applications, spanning bakery, dairy, beverages, snacks, and supplements. Sports and performance nutrition remains the largest sub-application, though its growth is stabilizing as the market matures. Infant formula and medical nutrition, while smaller in volume, are critical due to regulatory barriers and premium pricing. Domestic production mandates, introduced after the 2022 supply crisis, drove a 7% increase in whey protein usage in infant formulas in 2024, according to the American Dairy Products Institute. Bakery applications now utilize whey concentrates to enhance dough elasticity, extend shelf life, and reduce fat in products like muffins and cookies. Beverages are the fastest-growing sub-segment, with protein-fortified coffee, tea, and juice drinks gaining popularity in convenience stores and vending machines. The International Dairy Foods Association's 2025 survey shows 22% of planned whey protein capacity additions are focused on beverage fortification.
The Personal Care and Cosmetics segment, growing at a 5.98% CAGR through 2031, is a high-value niche where whey peptides are used in anti-aging serums, hair conditioners, and body lotions. Rich in cysteine and glutamic acid, whey-derived peptides support collagen synthesis and offer antioxidant benefits. The Personal Care Products Council lists over 40 approved whey-derived ingredients, including hydrolyzed whey protein and whey protein isolate. Whey's clean-label appeal and biocompatibility position it as a natural alternative to synthetic peptides, with growth concentrated in premium skincare brands offering products priced at USD 50-150 per ounce. Despite this growth, cosmetics account for a small share of whey usage, with a single sports nutrition brand consuming more whey protein annually than the entire U.S. cosmetics industry.
Geography Analysis
In 2024, the United States remains the leading hub for whey protein production and consumption, driven by dairy farming concentration, processing infrastructure, and consumer demographics. California, Wisconsin, and Idaho together produced 42% of U.S. milk, according to USDA data, and host most large-scale whey processing facilities. California's Central Valley generates significant whey volumes as a cheese manufacturing byproduct, with Hilmar Cheese Company operating one of the world's largest whey protein plants. Wisconsin, known as the dairy capital, houses Agropur's Lake Norden facility and several smaller custom whey processors. Idaho's rapidly growing dairy industry has seen Idaho Milk Products invest USD 200 million (2023-2025) in capacity upgrades to meet rising demand for high-purity isolates. While this regional concentration enhances logistics, it also exposes the market to risks like California's water scarcity and rural labor shortages.
Consumption patterns vary regionally. Coastal urban centers prefer premium whey products, while the Midwest and South favor value-oriented concentrates. The Northeast, particularly the New York-Boston corridor, shows strong demand for organic and grass-fed whey proteins, reflecting higher incomes and health awareness. Texas and Florida, with large Hispanic populations, are growth markets for whey-fortified foods like protein-enriched tortillas and dairy beverages. The U.S. Dairy Export Council reported a 6.2% rise in domestic whey protein consumption in 2024, outpacing population growth and indicating higher per-capita intake. Export trends also impact domestic supply, as rising global whey prices prompt U.S. processors to prioritize exports, tightening local availability and supporting prices. This is especially evident for whey protein isolates, where demand from China and Southeast Asia competes with U.S. buyers.
Regulatory compliance significantly shapes geographic market dynamics, particularly for infant formula and medical nutrition. FDA inspections are concentrated in states with large dairy processing sectors, and infant formula suppliers must meet stricter standards than conventional food-grade whey. The International Dairy Foods Association's 2025-2028 plan allocates USD 11 billion for dairy processing upgrades, focusing on regulatory compliance infrastructure like advanced testing labs and traceability systems. State-level policies also influence the market. California's strict environmental regulations have led some processors to source whey from out-of-state suppliers, fragmenting supply chains. Conversely, Wisconsin's Dairy Innovation Hub funds research into whey protein applications and processing efficiencies, strengthening the state's position in high-value segments.
Competitive Landscape
The United States whey protein ingredients market is moderately concentrated, with large dairy processors and specialized nutrition ingredient suppliers coexisting. Established players leverage integrated dairy sourcing, advanced filtration technologies, and strong distribution networks to ensure consistent quality and large-scale production. Key players in the market include Arla Foods amba, Fonterra Co-operative Group Limited, Glanbia PLC, Groupe Lactalis, and Koninklijke FrieslandCampina NV. Mid-sized manufacturers and niche formulators compete by focusing on applications like sports nutrition, medical nutrition, and functional food fortification.
Competition centers on product differentiation and technological innovation rather than price. Leading companies offer value-added products such as whey protein isolates, hydrolysates, and clean-label or low-lactose variants to meet consumer demand for digestibility and performance nutrition. Emerging brands and contract manufacturers focus on innovations like flavor masking, solubility, and customized protein blends, forming partnerships with food and beverage companies. This drives continuous investment in processing efficiency and research, keeping both large and mid-tier players competitive.
Moderate entry barriers, including capital-intensive processing, regulatory compliance, and raw milk supply challenges, limit new entrants. However, smaller players find opportunities in private-label manufacturing, specialty formulations, and premium or niche segments. Rising demand for high-protein functional products in sports nutrition, healthy snacks, and clinical applications supports diverse supplier participation. The market remains balanced, with established leaders benefiting from scale and innovative firms driving competition.
United States Whey Protein Ingredients Industry Leaders
-
Arla Foods amba
-
Fonterra Co-operative Group Limited
-
Glanbia PLC
-
Groupe Lactalis
-
Koninklijke FrieslandCampina NV
- *Disclaimer: Major Players sorted in no particular order

Recent Industry Developments
- August 2025: Silver Star Nutrition has launched its new Select Proformance ELITE Whey Protein Isolate (WPI), a clean and fast-digesting protein designed specifically for performance-driven individuals and athletes.
- March 2025: Arla Foods Ingredients has signed a contract manufacturing agreement with Valley Queen, strengthening its ability to meet the growing demand for protein-enriched dairy in the US. According to the company, the South Dakota-based dairy processor will produce ingredients from the Nutrilac ProteinBoost product range. The patented microparticulate whey protein concentrate is used to increase protein levels in food and beverage products while retaining texture and taste.
- October 2024: Ascent Protein has expanded its product line with the launch of its latest innovation: Clear Whey Protein Isolate. According to the brand, the product is available in two flavors - Pineapple Coconut and Orange Mango. Each serving delivers 20 grams of clean, fast-digesting whey protein to support muscle recovery, and with only 100 calories.


United States Whey Protein Ingredients Market Report Scope
Concentrates, Hydrolyzed, Isolates are covered as segments by Form. Animal Feed, Food and Beverages, Personal Care and Cosmetics, Supplements are covered as segments by End User.
By Product Type
| Whey Protein Concentrates |
| Whey Protein Isolates |
| Whey Protein Hydrolysate |
By Form
| Powder |
| Liquid |
By Application
| Food and Beverages | Bakery |
| Beverages | |
| Breakfast Cereals | |
| Condiments/Sauces | |
| Dairy and Dairy Alternatives Products | |
| RTE/RTC/ Food Products | |
| Snacks | |
| Animal Feed and Pet Food | |
| Personal Care and Cosmetics | |
| Supplements | Baby Food and Infant Formula |
| Elderly and Medical Nutrition | |
| Sports/Performance Nutrition |
| By Product Type | Whey Protein Concentrates | |
| Whey Protein Isolates | ||
| Whey Protein Hydrolysate | ||
| By Form | Powder | |
| Liquid | ||
| By Application | Food and Beverages | Bakery |
| Beverages | ||
| Breakfast Cereals | ||
| Condiments/Sauces | ||
| Dairy and Dairy Alternatives Products | ||
| RTE/RTC/ Food Products | ||
| Snacks | ||
| Animal Feed and Pet Food | ||
| Personal Care and Cosmetics | ||
| Supplements | Baby Food and Infant Formula | |
| Elderly and Medical Nutrition | ||
| Sports/Performance Nutrition | ||


Market Definition
- End User - The Protein Ingredients Market operates on a B2B basis. Food, Beverages, Supplements, Animal Feed, and Personal Care & Cosmetic manufacturers are considered to be end-consumers in the market studied. The scope excludes manufacturers buying liquid/dry whey to be used for application as a binding agent or thickener or other non-protein applications.
- Penetration Rate - Penetration Rate is defined as the percentage of Protein-Fortified End User Market Volume in the Overall End User Market Volume.
- Average Protein Content - Average protein content is the average protein content present per 100 g of product manufactured by all end-user companies considered under the scope of this report.
- End User Market Volume - End-user market volume is the consolidated volume of all types and forms of end-user products in the country or region.
| Keyword | Definition |
|---|---|
| Alpha-lactalbumin (α-Lactalbumin) | It is a protein that regulates the production of lactose in the milk of almost all mammalian species. |
| Amino acid | It is an organic compound that contains both amino and carboxylic acid functional groups, which are required for the synthesis of body protein and other important nitrogen-containing compounds, such as creatine, peptide hormones, and some neurotransmitters. |
| Blanching | It is the process of briefly heating vegetables with steam or boiling water. |
| BRC | British Retail Consortium |
| Bread improver | It is a flour-based blend of several components with specific functional properties designed to modify dough characteristics and give quality attributes to bread. |
| BSF | Black Soldier Fly |
| Caseinate | It is a substance produced by adding an alkali to acid casein, a derivative of casein. |
| Celiac disease | Celiac disease is an immune reaction to eating gluten, a protein found in wheat, barley, and rye. |
| Colostrum | It is a milky fluid that’s released by mammals that have recently given birth before breast milk production begins. |
| Concentrate | It is the least processed form of protein and has a protein content ranging from 40-90% by weight. |
| Dry protein basis | It refers to the percentage of "pure protein" present in a supplement after the water in it is completely removed through heat. |
| Dry whey | It is the product resulting from drying fresh whey which has been pasteurized and to which nothing has been added as a preservative. |
| Egg protein | It is a mixture of individual proteins, including ovalbumin, ovomucoid, ovoglobulin, conalbumin, vitellin, and vitellenin. |
| Emulsifier | It is a food additive that facilitates the blending of foods that are immiscible with one another, such as oil and water. |
| Enrichment | It is the process of addition of micronutrients that are lost during the processing of the product. |
| ERS | Economic Research Service of the USDA |
| Extrusion | It is the process of forcing soft mixed ingredients through an opening in a perforated plate or die designed to produce the required shape. The extruded food is then cut to a specific size by blades. |
| Fava | Also known as Faba, it is another word for yellow split beans. |
| FDA | Food and Drug Administration |
| Flaking | It is a process in which typically a cereal grain (like corn, wheat, or rice) is broken down into grits, cooked with flavors and syrups, and then pressed into flakes between cooled rollers. |
| Foaming agent | It is a food ingredient that makes it possible to form or maintain a uniform dispersion of a gaseous phase in a liquid or solid food. |
| Foodservice | It refers to the part of the food industry which includes businesses, institutions, and companies which prepare meals outside the home. It includes restaurants, school and hospital cafeterias, catering operations, and many other formats. |
| Fortification | It is the deliberate addition of micronutrients that are not found in them naturally or which are lost during processing, to improve a food product's nutritional value. |
| FSANZ | Food Standards Australia New Zealand |
| FSIS | Food Safety and Inspection Service |
| FSSAI | Food Safety and Standards Authority of India |
| Gelling agent | It is an ingredient that functions as a stabilizer and thickener to provide thickening without stiffness through the formation of gel. |
| GHG | Greenhouse Gas |
| Gluten | It is a family of proteins found in grains, including wheat, rye, spelt, and barley. |
| Hemp | It is a botanical class of Cannabis sativa cultivars grown specifically for industrial or medicinal use. |
| Hydrolysate | It is a form of protein manufactured by exposing the protein to enzymes that can partially break the bonds between the protein's amino acids and break down large, complicated proteins into smaller pieces. Its processing makes it easier and quicker to digest. |
| Hypoallergenic | It refers to a substance that causes fewer allergic reactions. |
| Isolate | It is the purest and most processed form of protein which has undergone separation to obtain a pure protein fraction. It typically contains ≥ 90% of protein by weight. |
| Keratin | It is a protein that helps form hair, nails, and the outer layer of skin. |
| Lactalbumin | It is the albumin contained in milk and obtained from whey. |
| Lactoferrin | It is an iron‑binding glycoprotein that is present in the milk of most mammals. |
| Lupin | It is the yellow legume seeds of the genus Lupinus. |
| Millenial | Also known as Generation Y or Gen Y, it refers to the people born from 1981 to 1996. |
| Monogastric | It refers to an animal with a single-compartmented stomach. Examples of monogastric include humans, poultry, pigs, horses, rabbits, dogs, and cats. Most monogastric are generally unable to digest much cellulose food materials such as grasses. |
| MPC | Milk protein concentrate |
| MPI | Milk protein isolate |
| MSPI | Methylated soy protein isolate |
| Mycoprotein | Mycoprotein is a form of single-cell protein, also known as fungal protein, derived from fungi for human consumption. |
| Nutricosmetics | It is a category of products and ingredients that act as nutritional supplements to care for skin, nails, and hair natural beauty. |
| Osteoporosis | It is a medical condition in which the bones become brittle and fragile from loss of tissue, typically as a result of hormonal changes, or deficiency of calcium or vitamin D. |
| PDCAAS | Protein digestibility-corrected amino acid score (PDCAAS) is a method of evaluating the quality of a protein based on both the amino acid requirements of humans and their ability to digest it. |
| Per-capita consumption of animal protein | It is the average amount of animal protein (such as milk, whey, gelatin, collagen, and egg proteins) that is readily available for consumption by each person in an actual population. |
| Per-capita consumption of plant protein | It is the average amount of plant protein (such as soy, wheat, pea, oat, and hemp proteins) that is readily available for consumption by each person in an actual population. |
| Quorn | It is a microbial protein manufactured using mycoprotein as an ingredient, in which the fungus culture is dried and mixed with egg albumen or potato protein, which acts as a binder, and then is adjusted in texture and pressed into various forms. |
| Ready-to-Cook (RTC) | It refers to food products that include all of the ingredients, where some preparation or cooking is required through a process that is given on the package. |
| Ready-to-Eat (RTE) | It refers to a food product prepared or cooked in advance, with no further cooking or preparation required before being eaten. |
| RTD | Ready-to-Drink |
| RTS | Ready-to-Serve |
| Saturated fat | It is a type of fat in which the fatty acid chains have all single bonds. It is generally considered unhealthy. |
| Sausage | It is a meat product made of finely chopped and seasoned meat, which may be fresh, smoked, or pickled and which is then usually stuffed into a casing. |
| Seitan | It is a plant-based meat substitute made out of wheat gluten. |
| Softgel | It is a gelatin-based capsule with a liquid fill. |
| SPC | Soy protein concentrate |
| SPI | Soy protein isolate |
| Spirulina | It is a biomass of cyanobacteria that can be consumed by humans and animals. |
| Stabilizer | It is an ingredient added to food products to help maintain or enhance their original texture, and physical and chemical characteristics. |
| Supplementation | It is the consumption or provision of concentrated sources of nutrients or other substances that are intended to supplement nutrients in the diet and is intended to correct nutritional deficiencies. |
| Texturant | It is a specific type of food ingredient that is used to control and alter the mouthfeel and texture of food and beverage products. |
| Thickener | It is an ingredient that is used to increase the viscosity of a liquid or dough and make it thicker, without substantially changing its other properties. |
| Trans fat | Also called trans-unsaturated fatty acids or trans fatty acids, it is a type of unsaturated fat that naturally occurs in small amounts in meat. |
| TSP | Textured soy protein |
| TVP | Textured vegetable protein |
| WPC | Whey protein concentrate |
| WPI | Whey protein isolate |


Research Methodology
Mordor Intelligence follows a four-step methodology in all our reports.
- Step-1: Identify Key Variables: The quantifiable key variables (industry and extraneous) pertaining to the specific product segment and country are selected from a group of relevant variables & factors based on desk research & literature review; along with primary expert inputs. These variables are further confirmed through regression modeling (wherever required).
- Step-2: Build a Market Model: In order to build a robust forecasting methodology, the variables and factors identified in Step-1 are tested against available historical market numbers. Through an iterative process, the variables required for market forecast are set and the model is built on the basis of these variables.
- Step-3: Validate and Finalize: In this important step, all market numbers, variables and analyst calls are validated through an extensive network of primary research experts from the market studied. The respondents are selected across levels and functions to generate a holistic picture of the market studied.
- Step-4: Research Outputs: Syndicated Reports, Custom Consulting Assignments, Databases & Subscription Platforms


