
Automotive Tires Market Size and Share
Market Overview
| Study Period | 2020 - 2031 |
|---|---|
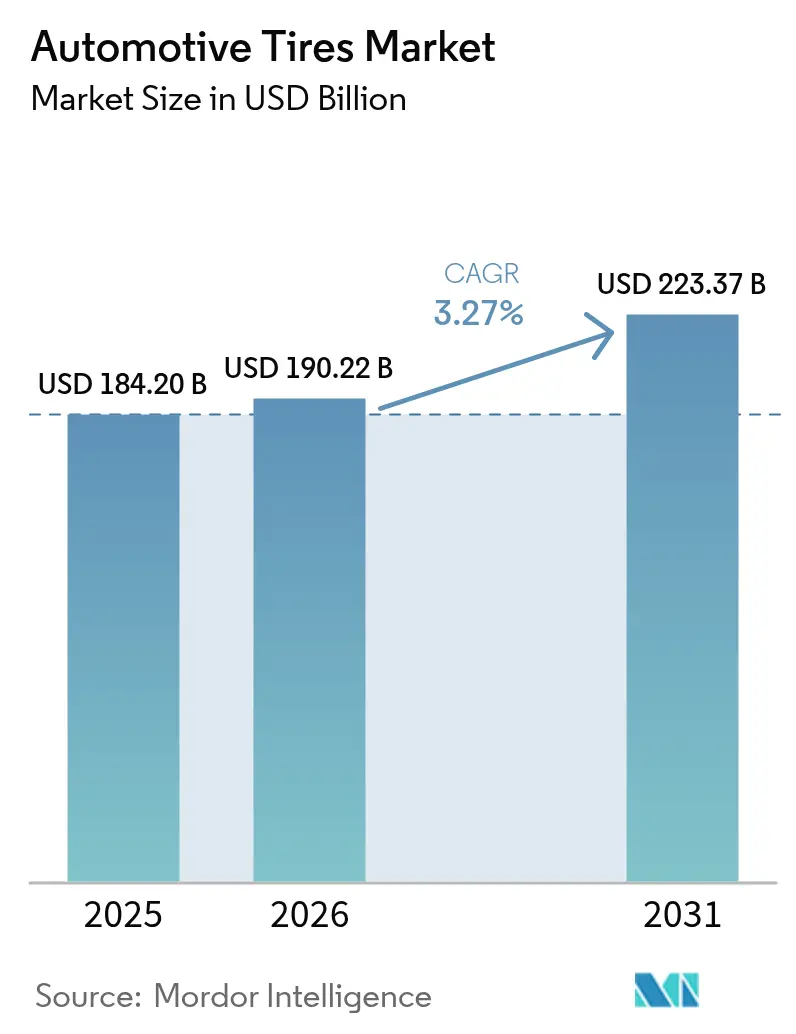
| Market Size (2026) | USD 190.22 Billion |
| Market Size (2031) | USD 223.37 Billion |
| Growth Rate (2026 - 2031) | 3.27% CAGR |
| Fastest Growing Market | Asia-Pacific |
| Largest Market | Asia-Pacific |
| Market Concentration | High |
Major Players
*Disclaimer: Major Players sorted in no particular order Image © Mordor Intelligence. Reuse requires attribution under CC BY 4.0. |
|
Automotive Tires Market Analysis by Mordor Intelligence
Automotive Tire Market size market size in 2026 is estimated at USD 190.22 billion, growing from 2025 value of USD 184.20 billion with 2031 projections showing USD 223.37 billion, growing at 3.27% CAGR over 2026-2031. Multiple dynamics shape this trajectory: electric-vehicle adoption raises demand for ultra-low-noise and low-rolling-resistance products; sustainability policies encourage domestic synthetic-rubber investment; and consumer preference for larger rim diameters lifts average selling prices. Asia’s manufacturing depth and rising vehicle ownership keep it the geographic anchor, while North America and Europe innovate around connectivity and premium performance. Supply-side pressures from Southeast-Asian rubber-leaf disease and European carbon-black logistics highlight the need for supply-chain resilience. Yet, the overall automotive tire market continues to expand as fleets modernize and data-rich smart-tire contracts unlock new revenue streams.
Key Report Takeaways
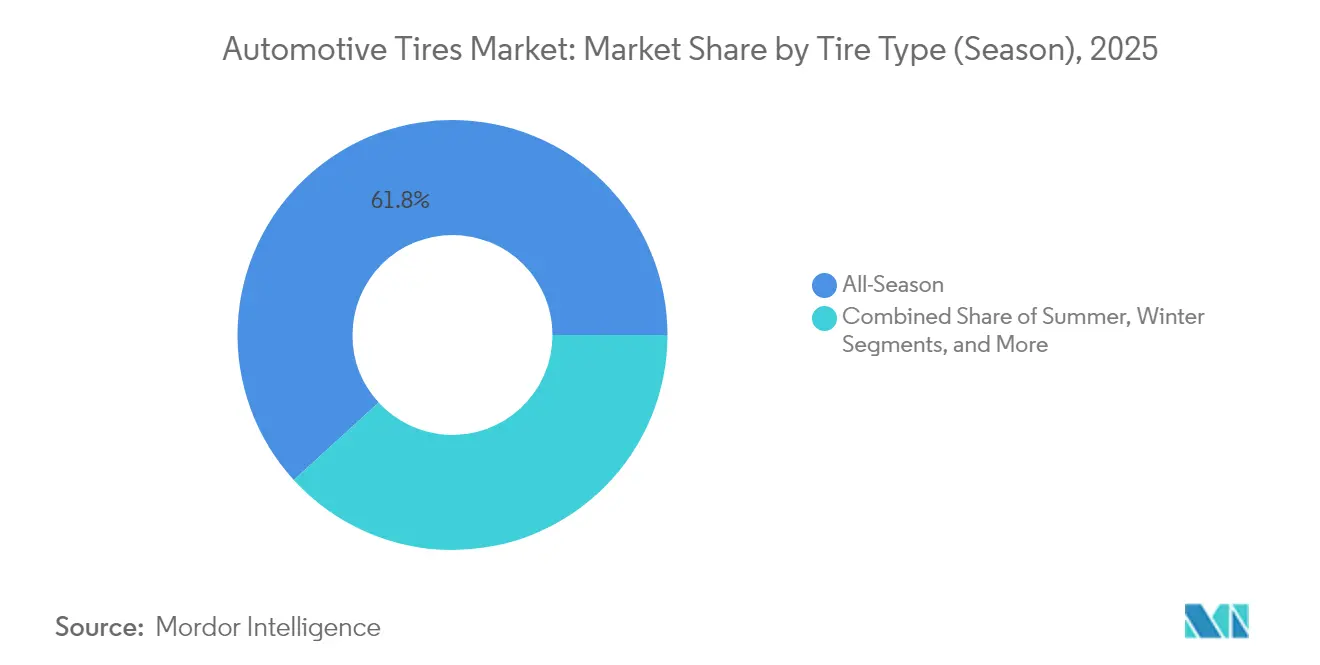
- By tire type (season), all-season products led with 61.78% of the automotive tire market share in 2025, while winter tires are forecast to post the fastest 4.12% CAGR through 2031.
- By tire design, radial tires accounted for 85.72% of the automotive tire market share in 2025; non-pneumatic/airless options are projected to expand at a 5.49% CAGR to 2031.
- By vehicle type, passenger cars captured 56.63% of the automotive tire market share in 2025, whereas BEV-specific tires are advancing at a 10.63% CAGR over 2026-2031.
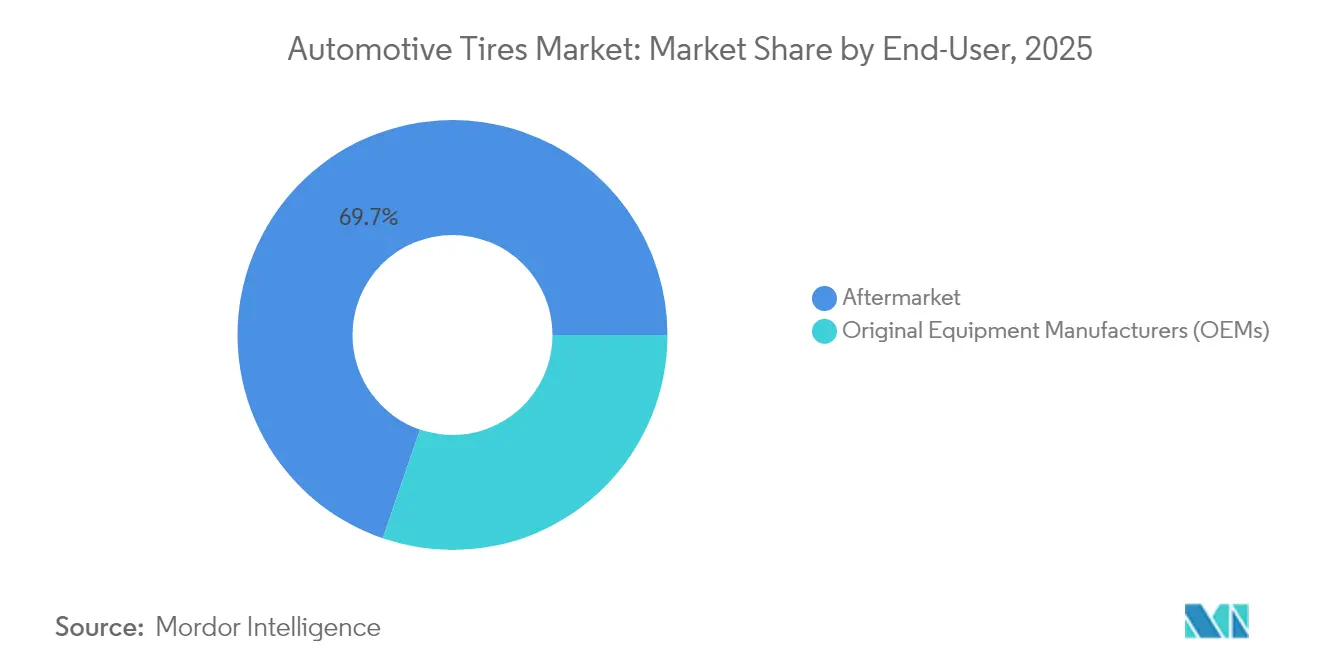
- By end user, the replacement/aftermarket channel held 69.74% share of the automotive tire market size in 2025, while OEM demand is rising at a 7.2% CAGR through 2031.
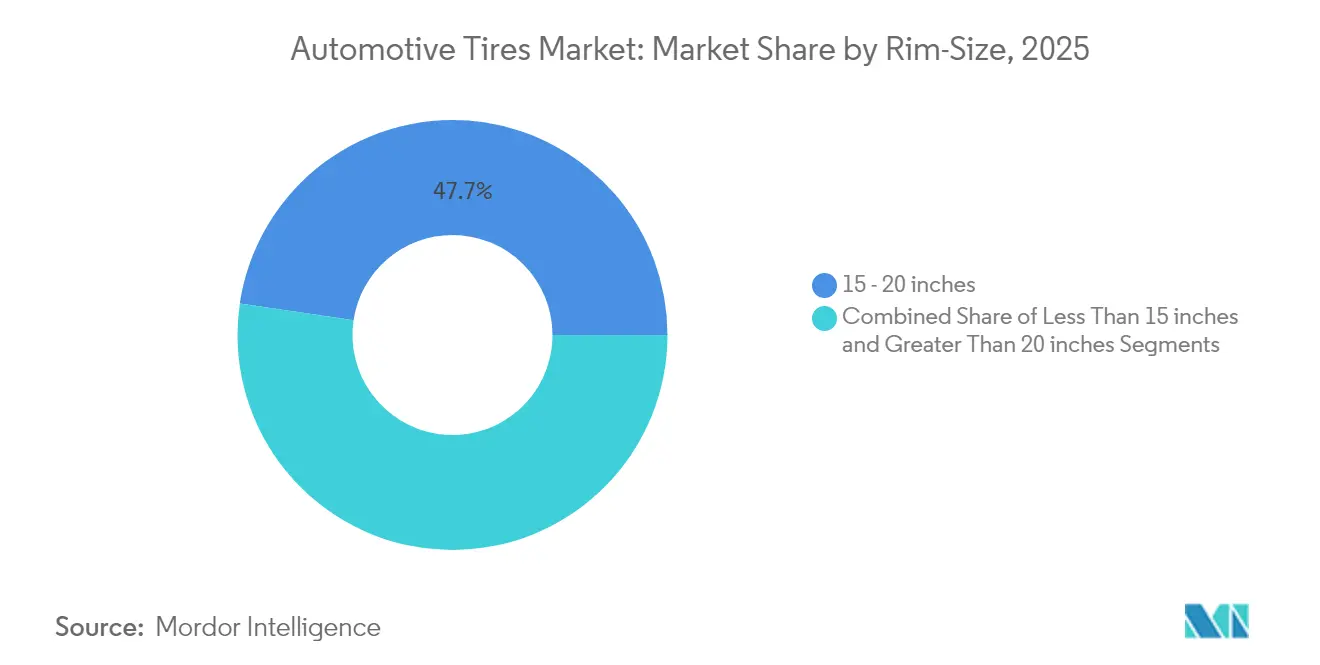
- By rim size, the 15–20-inch segment commanded a 47.66% share of the automotive tire market in 2025; >20-inch tires formed the fastest-growing band with an 7.98% CAGR.
- By propulsion, ICE vehicles retained 91.62% of the automotive tire market share in 2025, yet battery-electric vehicle tires are set for a robust 10.62% CAGR to 2031.
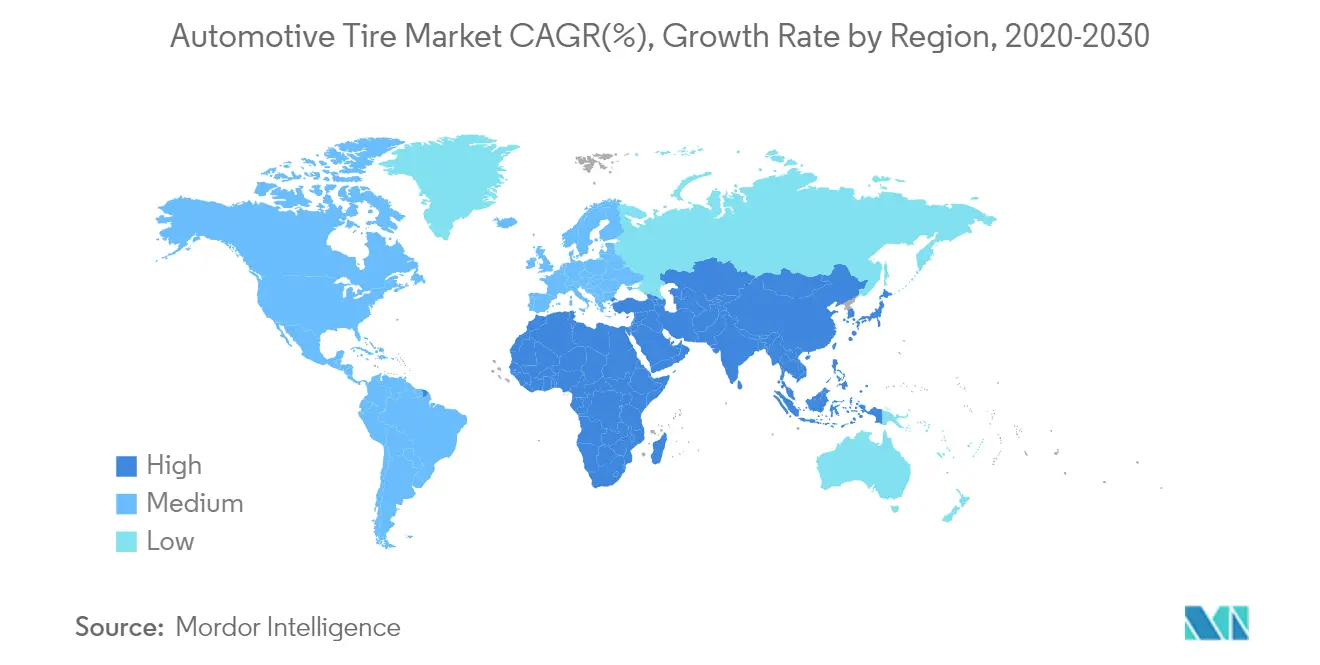
- By geography, Asia secured 54.12% of automotive tire market share in 2025 and continues to grow at a 6.31% CAGR through 2031.
Note: Market size and forecast figures in this report are generated using Mordor Intelligence’s proprietary estimation framework, updated with the latest available data and insights as of 2026.
Global Automotive Tires Market Trends and Insights
Drivers Impact Analysis*
| Driver | (~) % Impact on CAGR Forecast | Geographic Relevance | Impact Timeline |
|---|---|---|---|
| Electrification-Led Demand for Ultra-Low-Noise Tires | +1.8% | European Union | Medium term (2-4 years) |
| Mandatory Low-RRR Tire Adoption Under China Phase-6 Norms | +1.2% | China; spillover Asia-Pacific | Medium term (2-4 years) |
| IoT-Enabled Smart-Tire Contracts In North-American Fleets | +0.9% | North America | Long term (≥ 4 years) |
| On-Shored Synthetic-Rubber Capacity Via U.S. IRA | +0.7% | United States; spillover North America | Medium term (2-4 years) |
| 18-Inch-Plus Rim Boom in Indian SUVs | +0.5% | India; spillover Asia-Pacific | Short term (≤ 2 years) |
| EU-2024 Tire-Label Reform Boosting A-Rated Replacements | +0.3% | European Union | Short term (≤ 2 years) |
| Source: Mordor Intelligence | |||


Electrification-Led Demand for Ultra-Low-Noise Tires
Electric drivetrains remove engine masking noise, placing tire-road interaction at the acoustic forefront. Premium EV makers pay more premiums for noise-canceling foam products and tuned tread patterns that cut in-cabin decibels by up to 20%.[1]"Electric Mobility Guide, " MICHELIN, michelin.caThe European Union’s stricter exterior-noise limits reinforce this trend, and the automotive tire market now sees mainstream segments requesting similar technology for compliance and comfort. Suppliers can meet performance and regulation, secure coveted OE fitments, and maintain price discipline despite higher raw-material costs.
Mandatory low-RRR Rire Adoption in China
Phase-6 fuel-efficiency rules mandate a 15% consumption improvement, spotlighting rolling resistance. Domestic and global brands are compressing R&D cycles to 18 months to deliver silica-rich compounds capable of 8% fuel-economy gains. Gains achieved for Chinese homologation rapidly cascade into broader Asian production, elevating baseline technology across the automotive tire market without duplicative R&D spend.
18-inch-plus Rim Boom in Indian SUVs
India’s SUV registrations jumped 34% in FY24, and 18–20 inch wheels earn margins 40–60% above standard sizes. Local capacity expansions and premium SKUs capture value as customers perceive larger rims as status and performance upgrades. The mix shift trickles into the broader automotive tire market by increasing average selling price and encouraging further product segmentation by diameter.
EU-2024 Tire-Label Revamp
Clearer A-to-E grades on rolling resistance, wet grip, and noise raise consumer awareness. Premium A-rated lines now outpace lower grades in replacement sales, cutting premature disposal and pushing manufacturers to invest in advanced compounds that satisfy both efficiency and grip requirements across the automotive tire market.[2]"Michelin supports the new European regulation R117-04, " MICHELIN, michelin.com
Restraints Impact Analysis*
| Restraint | (~) % Impact on CAGR Forecast | Geographic Relevance | Impact Timeline |
|---|---|---|---|
| Southeast-Asian Rubber-Leaf Disease Inflating Raw-Material Costs | -1.2% | Southeast Asia, with global impact | Medium term (2-4 years) |
| Excess EV Curb-Weight Accelerating Warranty Claims | -0.8% | Global, with concentration in North America and Europe | Short term (≤ 2 years) |
| Carbon-Black Shipping Bottlenecks in Europe | -0.5% | Europe, with spillover to Middle East and Africa | Short term (≤ 2 years) |
| Impending US PFAS Ban on Fluorinated Mould-Release Agents | -0.3% | United States, with potential global impact | Medium term (2-4 years) |
| Source: Mordor Intelligence | |||
Southeast-Asian Rubber-Leaf Disease Impact
Pestalotiopsis infestation has cut latex yields in Indonesia, pushing natural-rubber spot prices up 33% year-on-year and squeezing margins for tire plants worldwide. Recovery is slow because affected trees need up to 10 years to reach tapping maturity. Producers diversify toward guayule and Russian dandelion sources, yet commercial scale remains several seasons away, sustaining cost pressure through the medium term.
Excess EV Curb-Weight Accelerating Warranty Claims
Battery packs add 1,000 lb or more to many electric SUVs and pickups, a ccelerating tread wear by 15-20% and triggering higher warranty payouts. Specialized EV compounds and reinforced constructions offer warranties up to 50,000 miles, but their 15-30% price premium narrows the affordability gap, particularly in entry-level EV segments.
*Our forecasts treat driver/restraint impacts as directional, not additive. The impact forecasts reflect baseline growth, mix effects, and variable interactions.
Segment Analysis
By Tire Type: Versatility Keeps All-Season in Front
All-season products maintained leadership in 2025 with 61.78% of the automotive tire market share, helped by their year-round convenience in varied climates. Winter tires, although smaller, are projected to post the fastest 4.12% CAGR between 2026 and 2031 as safety mandates in Europe widen adoption. Summer lines remain popular in regions with consistently high temperatures, while all-terrain/mud-terrain patterns capture SUV owners who value off-road capability. Manufacturers now blend high-silica compounds with adaptive sipes so a single tread can tolerate both heat and light snow, lowering inventory complexity for dealers.
R&D spending also targets electric-vehicle needs: foam inserts reduce cabin noise and rubber chemistries hold flexibility below freezing, making premium winter SKUs attractive to EV buyers. More fleets specify three-peak-mountain-snowflake certification on delivery vans, underscoring growing regulatory reach. Meanwhile, data-driven tire rotation services lengthen tread life, shifting revenue toward value-added winter-changeover packages. These interplay trends ensure seasonal lines evolve well beyond simple temperature bands.


By Tire Design: Radial Dominance Faces Airless Experiments
Radial construction captured 85.72% of the automotive tire market share in 2025, due to fuel efficiency, stable handling, and long tread life. Bias ply endures in low-speed, heavy-load niches, yet its influence keeps shrinking. The most disruptive advance is the non-pneumatic/airless segment, which is forecast to grow 5.49% annually through 2031 as construction, military, and grounds-maintenance fleets seek puncture-proof uptime. Thermoplastic spokes and composite webs are narrowing the rolling-resistance gap with conventional radials.
Pilot programs show airless tires delivering lifecycle cost savings once puncture repairs and downtime are factored in, persuading OEMs to schedule passenger-car trials in the next development cycle. Radial suppliers answer with reinforced bead fillers and slimmer steel belts that trim mass without sacrificing strength, aiming to defend share while EV curb weights climb. Regulations on recyclability further elevate interest in single-material airless designs that simplify end-of-life processing. The outcome is a two-track innovation race rather than an outright substitution.
By Vehicle Type: Passenger Cars Still Rule, but BEV Tires Race Ahead
Passenger cars accounted for 56.63% of the 2025 volume, cementing their place at the core of automotive tire market size. SUVs and crossovers continue encroaching, nudging tire makers toward higher load indices and taller diameters. The standout growth story is BEV-specific tires, slated for a robust 10.63% CAGR as global electric-vehicle registrations soar. Added battery mass and instant torque drive demand for stronger casings, silica-rich treads, and acoustic dampers.
During early platform engineering, premium automakers increasingly co-develop bespoke BEV tires, embedding brand-exclusive dimensions that lock in replacement revenue. In the replacement channel, range-optimization marketing persuades cost-sensitive buyers to accept 15-30% price premiums when they can verify extra miles per charge. Meanwhile, light-commercial-vehicle electrification sparks new SKUs with reinforced sidewalls for parcel-delivery duty. This vehicle-mix evolution accelerates product complexity throughout the supply chain.
By Application: On-road Segment Embraces Connectivity
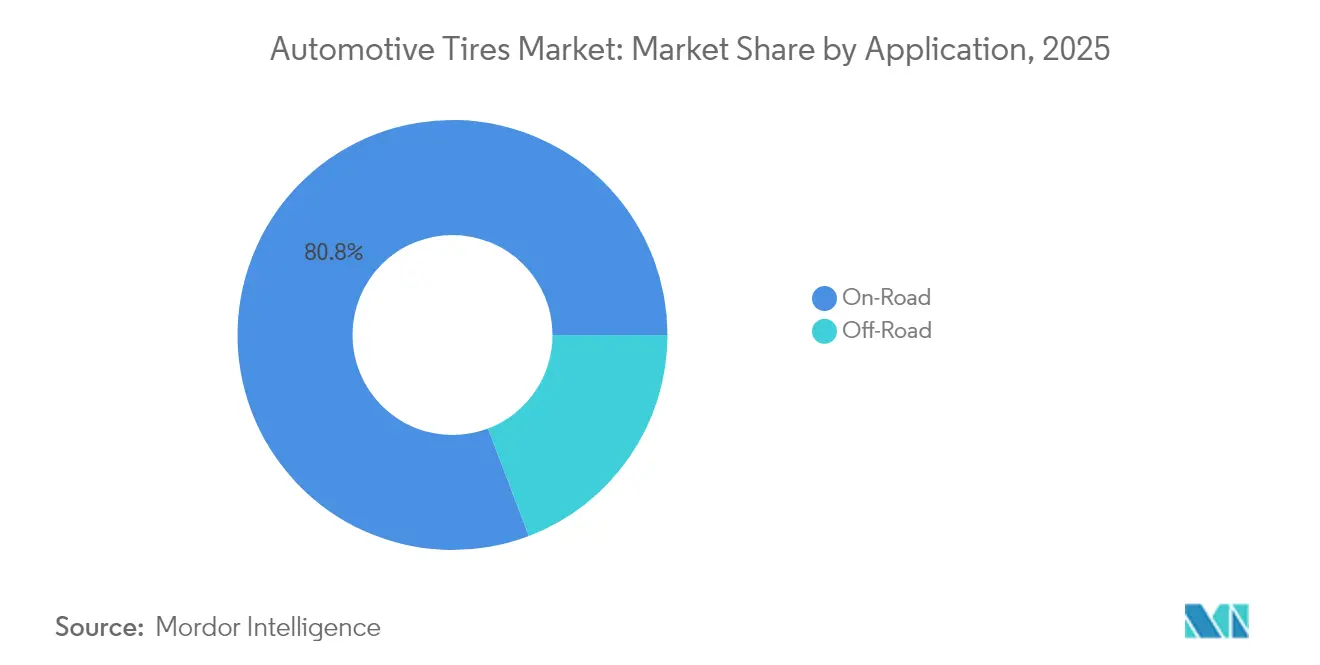
The on-road segment retained the leading position in 2025 with 80.78% of the automotive tire market share, reflecting the dominance of passenger cars, light trucks, and buses on paved networks. Smart-tire adoption is accelerating as fleets integrate embedded sensors that relay pressure, temperature, and tread data, extending service intervals and trimming fuel use. Automakers now specify OE fitments that meet digital-readiness standards, prompting suppliers to embed RFID tags and Bluetooth modules at scale. City-fleet managers report lower downtime after switching to connected tires that trigger predictive maintenance alerts, reinforcing the segment’s value proposition within the overall automotive tire market size. Growing regulatory scrutiny of rolling resistance and wet grip further raises the technology bar. These steering development budgets toward advanced polymers, acoustic foams, and data interfaces enhance efficiency and cabin comfort.
The off-road category, although smaller, is forecast to register the fastest 3.67% CAGR between 2026 and 2031 as construction, mining, and agricultural operators upgrade machinery fleets. Demand centers on reinforced carcasses, deep-lug patterns, and cut-resistant compounds designed for harsh terrain, driving premium price realization. Autonomous haulage in mines accelerates uptake of IoT-enabled tires that transmit real-time load and temperature metrics to centralized control rooms, safeguarding uptime. Agricultural users lean on stubble-resistant sidewalls and flexible footprints that minimize soil compaction, widening product specialization. As sustainability goals intensify, manufacturers explore bio-oil-based rubber blends and recovered carbon black for heavy-duty casings, ensuring the off-road segment’s rapid growth aligns with broader environmental imperatives.
By End User: Aftermarket challenged by OEM growth
Replacement and aftermarket outlets commanded 69.74% of automotive tire market share in 2025, underpinned by mature vehicle fleets and recurring wear-and-tear needs. However, OEM shipments are pacing ahead at a 7.2% CAGR as automakers push higher build schedules post-chip-shortage and specify tailored EV fitments. Greater vehicle specialization lifts OE margins because tires now contribute measurably to range, handling, and noise targets baked into showroom brochures.
Digital retail reshapes the aftermarket: price-comparison engines erode dealer markups, so brick-and-mortar shops bundle alignment, nitrogen inflation, and subscription rotation to maintain profitability. Automakers counter by offering lifetime-service tire packages within financing plans, extending their grip past initial sale. Both channels therefore innovate on services rather than rubber alone, tightening the contest for lifetime customer value.
By Rim Size: Mid-Diameter Dominance Meets Premium Upsizing
The 15–20-inch bracket held 47.66% share in 2025, balancing ride comfort, tire cost, and brake-package fit for most passenger cars. Demand for wheels above 20 inches is climbing fastest at an 7.98% CAGR, fueled by luxury SUVs and performance EVs where aesthetics and caliper clearance trump fuel-efficiency concerns. Larger diameters command 40-60% higher average selling prices, lifting revenue even when unit growth cools.
OEMs experiment with aerodynamic wheel covers to recapture range lost to heavier rims, while tire engineers offset shorter sidewalls by adding aramid or rayon reinforcement to preserve ride quality. The result is a premium tier where styling, handling, and branding outweigh traditional cost calculus. Entry-level segments still favor sub-15-inch sizes, but their share dwindles each model year, confirming the upsizing drift.
By Propulsion: Electric Vehicles Drive Specialized Development
Internal-combustion-engine vehicles represented 91.62% of units in 2025, but they expand the slowest as governments legislated carbon targets. Although smaller in absolute terms, battery-electric models are projected to log a 10.62% CAGR, creating a lucrative sub-category within the broader automotive tire market size. EV tires integrate reinforced bead bundles, low-rolling-resistance compounds, and cavity-foam inserts to handle weight, torque, and noise, which explains their 15-30% price premium.
Hybrid and plug-in hybrid platforms occupy a middle ground, adopting partial EV tire attributes without full redesign, allowing suppliers to amortize R&D across multiple propulsion systems. As charging networks spread, consumers gain confidence to opt for full BEVs, reinforcing demand for specialized rubber. This propulsion pivot underpins a multi-decade upgrade cycle likely to reshape revenue patterns for tire makers worldwide.
Geography Analysis
Asia held 54.12% of the automotive tire market in 2025 and sustained the highest 6.31% CAGR to 2031. China anchors regional dominance through its vast OEM base, while India’s SUV boom fuels demand for 18-20-inch sizes and premium imports. Rubber-leaf disease in Southeast Asia constrains natural rubber supply, encouraging synthetic rubber diversification and alternative crops such as guayule.
North America ranks second, supported by mature replacement sales and rapid adoption of smart-tire platforms in commercial fleets. Domestic synthetic-rubber capacity fostered by the U.S. IRA reduces supply-chain risk, while rising EV penetration spurs specialized tire lines that prioritize range and noise reduction.
Europe continues to prioritize premium and sustainable products. The 2024 label overhaul guides consumers toward high-grade replacements, rewarding brands with technology-rich portfolios. Carbon-black logistics challenges, however, lengthen lead times and boost inventory costs, prompting interest in recovered carbon black and tighter supplier collaboration.

Regulatory Landscape
Tire regulation is tightening around measurable safety, efficiency, and environmental externalities. In March 2026, UNECE adopted new abrasion limits for new pneumatic passenger-car (C1) and light-commercial (C2) tires to curb microplastic emissions, reinforcing a shift toward standardized performance thresholds that shape global type-approval practices. In Europe, the EU tire-label framework remains a key demand-side lever, and the European Commission published COM(2026) 326 final in June 2026 assessing the Tire Labelling Regulation and its linkage to UNECE minimum performance requirements (rolling resistance, wet grip, and noise).
North American rules are also evolving alongside vehicle-technology change. In February 2026, the US Federal Motor Carrier Safety Regulations were amended (effective March 23, 2026) to clarify that load restriction markings are not required on commercial-motor-vehicle tire sidewalls, aligning enforcement with NHTSA safety standards. Canada set November 1, 2026 as the mandatory compliance date for Transport Canada Technical Standards Document No. 139 (Revision 1) covering new pneumatic radial tires for light vehicles. Trade remedies add another layer: the UK Trade Remedies Authority implemented countervailing duty measures in July 2025 on certain bus and lorry tires from China, while the US Department of Commerce issued May 2026 final results in an expedited sunset review on antidumping duties for certain passenger vehicle and light truck tires from China.
Value Chain Analysis
The automotive tire value chain runs from upstream feedstocks and reinforcements through manufacturing, then into OEM fitment and the replacement and aftermarket channel. Upstream, tires typically blend natural and synthetic rubber (about 50:50), plus reinforcing materials such as silica and carbon black (about 20% to 25%), extender oils (about 12% to 15%), and vulcanization agents (about 1% to 2%). Supply risk remains concentrated in natural rubber: Reuters reported in March 2025 that 2025 global natural-rubber output was projected to rise only 0.3% to 14.9 million metric tons while demand was projected to grow 1.8%, creating procurement volatility for global tire plants.
In midstream manufacturing, companies are using portfolio and capability moves to defend margins and cycle times. In January 2025, Goodyear agreed to sell Dunlop brand trademarks and assets in Europe, North America, and Oceania to Sumitomo Rubber Industries for USD 526 million, reflecting brand and channel refocusing among majors. OEM-facing development increasingly ties tire design to vehicle-dynamics simulation: in November 2025, Hyundai Motor Group signed a three-year MOU with Michelin for extreme-low rolling resistance tires, EV-specific performance, and virtual development systems. Downstream distribution spans OE logistics, dealer networks, fleet programs, and digital retailers, and connected-tire services add software and data partners alongside traditional wholesale and service channels.
Competitive Landscape
Top Companies in Automotive Tire Market
Bridgestone, Michelin, Goodyear, Continental, and Pirelli hold a significant amount of global revenue, underscoring a concentrated hierarchy in premium and OE channels. Brand equity, R&D scale, and worldwide distribution networks protect their positions, even as local manufacturers in China and India erode entry-level segments on cost. Technology convergence around EV, airless, and sensor-equipped tires intensifies R&D outlays, giving incumbents a scale edge, although agile challengers leverage lower overhead to commercialize niche opportunities rapidly.
Strategic alliances illustrate the shift: autonomous truck pilots featuring Bridgestone tires reached 50,000 accident-free miles, validating data-informed tire selection for emerging transport modes.[3]“Autonomous long-haul collaboration hits 50,000 miles,” J.B. Hunt Transport Services, jbhunt.comMeanwhile, Sailun's global top-10 entry signals rising competitive pressure from fast-improving Chinese brands, especially in sustainability-themed portfolios.
Automotive Tires Industry Leaders
-
Bridgestone Corp.
-
Michelin Group
-
Goodyear Tire & Rubber Company
-
Continental AG
-
Pirelli & C. SpA
- *Disclaimer: Major Players sorted in no particular order


Market Opportunities and Future Outlook
Capacity additions and premium radial mix upgrades in Asia-Pacific create whitespace for localized EV, SUV, and higher rim-size fitments, while reducing lead times and import exposure for regional OEMs and replacement networks. In India, multiple producers announced large capex programs tied to passenger car radial and truck and bus radial expansion. Apollo Tyres disclosed an Rs 5,810 crore plan (February 2026) for its Andhra Pradesh facility, CEAT committed an additional Rs 1,300 crore (March 2026) to expand passenger car radial capacity at Chennai, and JK Tyre approved Rs 4,980 crore (May 2026) for expansions in Chennai and Mysuru through December 2029. In Southeast Asia, Continental inaugurated a Rayong, Thailand plant expansion in May 2026, adding 3 million passenger car and light truck tires of annual capacity with investment exceeding EUR 300 million, which strengthens the regional supply base for high-efficiency products.
A second opportunity band is software-defined capability, where tire makers monetize intelligence such as braking, range, and maintenance without relying solely on incremental rubber volumes. Michelin unveiled a universal tire digital twin in May 2026 that uses existing in-vehicle data to deliver real-time tire intelligence without adding hardware sensors, aligning with OEM demand for integrated efficiency and safety functions. Hankook outlined a digital-twin roadmap in June 2026 (traction work in 2026, wet-asphalt validation in 2027, lifecycle digital twins by 2029-2030), pointing to a multi-year shift toward virtual validation and data services. These moves support product and service differentiation in EV-focused OE programs and fleet contracts where rolling resistance, noise, and uptime are procurement criteria.
Recent Industry Developments
- July 2026: Continental launched the CrossContact A/T2 tire for on- and off-road use, expanding its portfolio in light truck and SUV applications. The product targets mixed-duty consumers and fleets seeking durability without giving up on-road comfort, supporting premiumization in a segment that overlaps with larger rim sizes and higher load indices.
- June 2026: Goodyear confirmed it will supply lunar tires for the Lunar Outpost Pegasus Lunar Terrain Vehicle linked to NASA Artemis missions. The program reinforces Goodyear’s credentials in extreme-environment tire engineering, with spillover into high-load, puncture-resistant materials and validation methods relevant to off-road and specialty tire designs.
- December 2024: Yokohama India commenced local production of 19-inch Geolandar X-CV tires for luxury SUVs. Localizing this rim size supports faster fulfillment for premium replacement demand and strengthens domestic OE and aftermarket supply continuity for higher-margin SUV fitments.


Research Methodology Framework and Report Scope
Market Definition and Coverage
For this study, the automotive tires market counts the sales value of tires used on road and off road vehicles. Coverage includes OEM fitment and aftermarket replacement demand, using the major regional breakdown used in vehicle production and parc reporting.
Scope exclusions: We exclude non-automotive tires and tire related services such as installation labor, wheel rims, and vehicle maintenance bundles.
Segmentation Overview
-
By Tire Type
- Summer
- Winter
- All-Season
- All-Terrain / Mud-Terrain
-
By Tire Design
- Radial
- Bias
- Non-pneumatic / Airless
-
By Vehicle Type
- Passenger Cars
- SUVs & Crossovers
- Light Commercial Vehicles
- Heavy Commercial Trucks & Buses
- Two-Wheelers
- Off-the-Road & Specialty (OTR, Agriculture, Mining, Racing)
-
By Application
- On-Road
- Off-Road (Construction, Mining, Agriculture)
-
By End User
- OEM
- Aftermarket (Replacement & Retread)
-
By Rim Size
- Below 15 inches
- 15 - 20 inches
- Above 20 inches
-
By Propulsion
- Internal-Combustion Vehicles
- Battery-Electric Vehicles
- Hybrid & Fuel-Cell Vehicles
-
Geography
-
North America
- United States
- Canada
- Rest of North America
-
Europe
- Germany
- United Kingdom
- France
- Italy
- Rest of Europe
-
Asia-pacific
- China
- Japan
- India
- South Korea
- Rest of Asia-Pacific
-
South America
- Brazil
- Argentina
- Rest of South America
-
Middle East
- GCC
- Turkey
- Rest of Middle East
-
Africa
- South Africa
- Nigeria
- Rest of Africa
-
North America
Data Sources, Market Sizing, and Validation
Desk Research
Desk work starts by mapping the demand pool and the supply chain, then selecting public time series that track tire demand drivers. We typically use sources such as national transport and road safety agencies for vehicle parc and usage proxies, customs and trade statistics for tire and rubber flows, and energy or environment agencies for regulatory signals that affect rolling resistance and noise requirements. Production and macro indicators are also cross checked using public statistics portals run by government statistical offices and multilateral bodies.
In parallel, we review company filings, earnings decks, and reputable press coverage to understand price moves, capacity additions, and channel mix shifts between OEM and replacement. Where public data is thin, we use paid subscriptions focused on company financials and intelligence, news and financials, patent databases, and shipment level import and export records to validate directionally. The desk sources listed here are illustrative only, and we also used other public documents and datasets to collect, validate, and clarify the analysis.
Primary Interviews and Surveys
Primary work is used to test the assumptions behind the demand split, pricing, and channel behavior, especially where replacement cycles and rim size mix can change quickly. We spoke with a mix of tire manufacturers and their channel partners, plus fleet and service side participants, across APAC, EMEA, and the Americas to confirm what is selling and the price bands it is selling within. These discussions also helped us validate how EV adoption, larger wheel sizes, and retreading intensity are changing the value pool by region.
Distribution of primary research fieldwork respondents
| Company type | Respondent position | Region |
|---|---|---|
| Top tier: 32% | CXOs: 12% | APAC: 42% |
| Mid tier: 49% | Functional/Unit leaders: 34% | EMEA: 36% |
| Smaller Players: 19% | Managers: 54% | Americas: 22% |
Market-Sizing & Forecasting
Sizing is built using top down and bottom up logic. The top down view reconstructs tire demand from vehicle production and in use parc, then applies fitment factors and replacement cycles by vehicle class. We then check the outputs using selective bottom up approximations, such as rolling up sampled supplier and channel revenues, and validating implied volumes through average selling price ranges by rim size bands.
Key inputs in this market include new vehicle output by region, running vehicle parc, average annual mileage, replacement frequency by tire type and road conditions, and the rim size and tire design mix that drives price per unit. We also track OEM versus aftermarket share, plus off road demand signals linked to construction and agriculture activity, since those can shift volumes even when passenger car demand is soft. For forecasting, we run scenario analysis around the highest swing factors, mainly vehicle production outlook, replacement intensity, and pricing progression, then apply a smoothing approach to reduce one time spikes from raw material or freight shocks. When a bottom up check shows gaps, we bridge it with conservative ranges from interviews and public price lists, and we scale only when implied volumes remain consistent with the stated demand pool.
Data Validation & Update Cycle
Outputs are validated through triangulation across demand signals, supply side capacity direction, and price sanity checks, and we review the largest variances before sign off. We also run anomaly checks by region and by end use, so a sudden share jump is questioned unless it is supported by a clear trigger, such as a policy change, plant expansion, or a step up in replacement demand.
Reports are refreshed annually, with interim updates when material events can move the market, such as sharp raw material price changes or major trade disruptions. Before delivery, we recheck the model with the latest public releases and trigger a quick re contact if a key assumption appears out of date, so clients receive a current view.
Mordor Intelligence's Automotive Tires Market Size Versus Other Published Estimates
It is common to see different market sizes for automotive tires because researchers do not always use the same demand pool, and they can also select different base years and pricing logic. Differences also come from how OEM versus replacement is treated, whether off road applications are included, and how currency timing and inflation are handled.
By tracking fitment rates, replacement cycles, and rim size driven ASP shifts, Mordor Intelligence keeps the estimate tied to tires actually sold for automotive use across OEM and aftermarket channels, rather than blending in adjacent non-automotive categories. In some external approaches, the gap often comes from narrower vehicle coverage, applying a single global price curve, or retaining older price assumptions even when rim size mix and EV tire specifications are changing, which can move the total up or down.
Benchmark comparison
| Source | Market Size | Gaps in Research Methodology |
|---|---|---|
| Mordor Intelligence | USD 190.22 B (2026) | |
| Industry Research House A | USD 143.06 B (2024) | Uses an earlier base year and a broader tires framing that can differ in what is counted as automotive, and the value outcome is highly sensitive to how OEM versus replacement pricing is averaged across regions. |
| Global Research House B | USD 113.90 B (2023) | Starts from a 2023 base and applies category splits that can undercount off road demand and premiumization from larger rim sizes, and it can also compress the total if regional ASP progression is not updated frequently. |
The spread across sources mainly reflects year selection, what is included in the automotive boundary, and how pricing is carried forward when mix changes. Our approach is designed so the final total can be traced back to clear demand drivers, and then rechecked using grounded price and channel signals before the forecast is extended.


Key Questions Answered in the Report
What is the current size of the Automotive Tire Market?
The Automotive Tire Market is valued at USD 190.22 billion in 2026 and is forecast to reach USD 223.37 billion by 2031.
How fast is the electric-vehicle tire segment growing?
Tires engineered for battery-electric vehicles are advancing at a 10.62% CAGR, outpacing the broader market thanks to specialized design requirements.
Which region leads global sales?
Asia accounts for 54.12% of worldwide revenue and is expanding at a 6.31% CAGR, supported by strong production hubs in China and India.
Why are larger rim sizes becoming more popular?
The boom in SUVs and premium vehicles elevates demand for 18-inch-plus wheels, with the Above 20 inch category growing at an 7.98% CAGR and commanding higher margins.
How are smart tires changing fleet economics?
IoT-enabled models reduce tire-related downtime by up to 30% and improve fuel efficiency by around 15%, encouraging fleets to adopt subscription-based service contracts.
Page last updated on:




