
Market Overview
| Study Period | 2021 - 2031 |
|---|---|
| Forecast Data Period | 2026 - 2031 |
| Base Year Market Size (2025) | USD 43.69 Billion |
| Market Size (2026) | USD 46.45 Billion |
| Market Size (2031) | USD 63.11 Billion |
| Growth Rate (2026 - 2031) | 6.32 % |
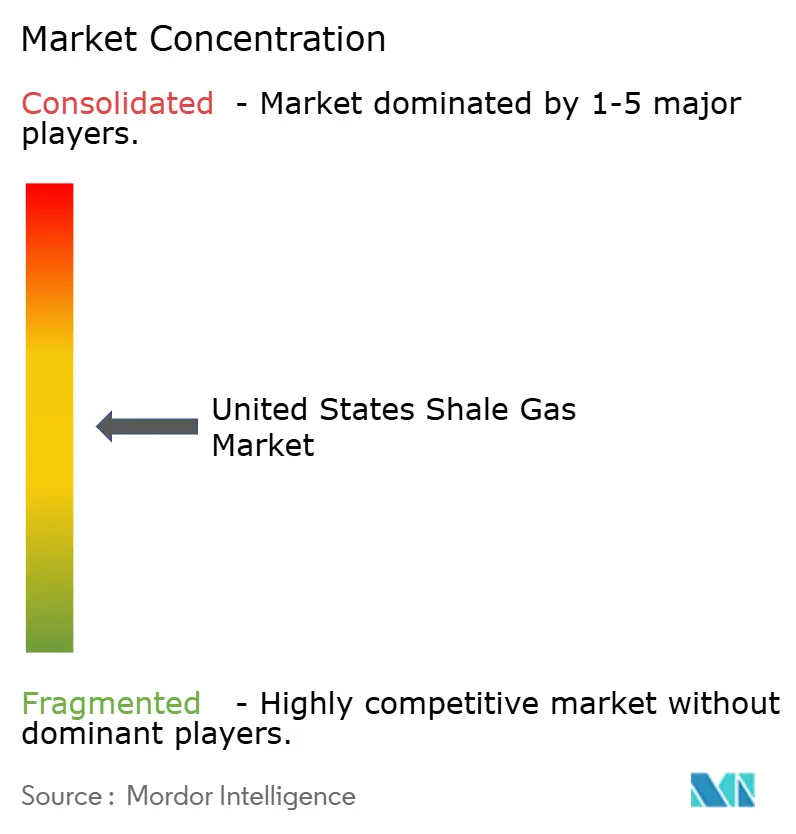
| Market Concentration | Medium |
Major Players *Disclaimer: Major Players sorted in no particular order Image © Mordor Intelligence. Reuse requires attribution under CC BY 4.0. | |
United States Shale Gas Market Analysis by Mordor Intelligence
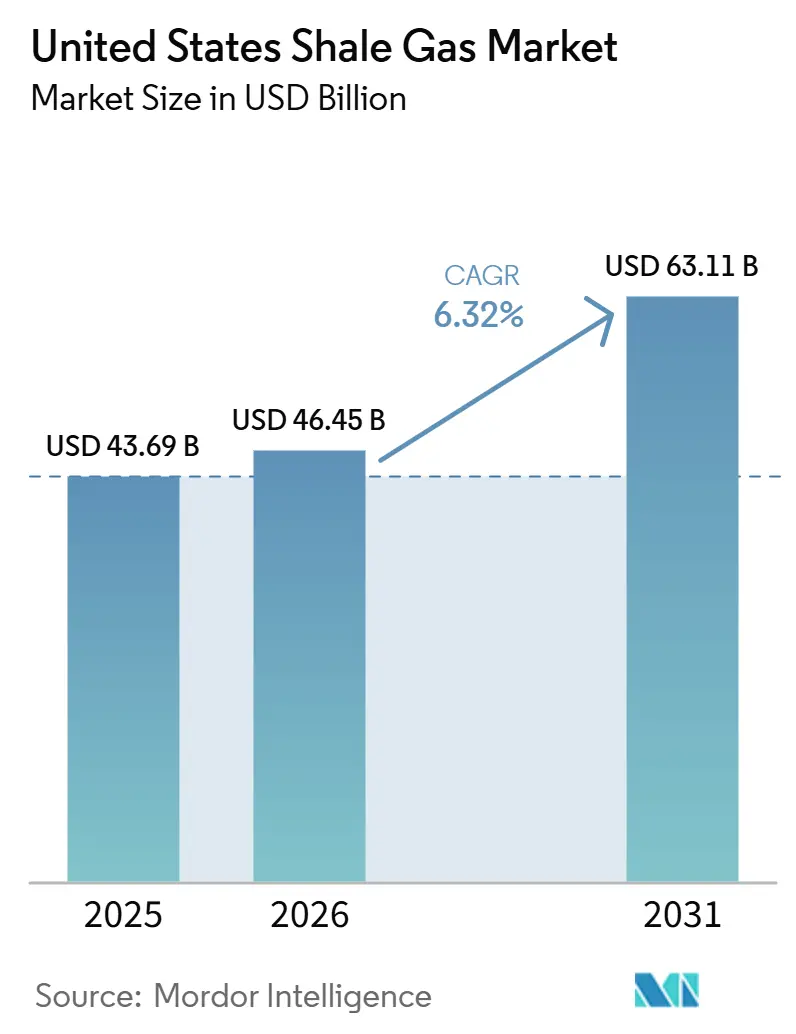
The United States Shale Gas Market size was valued at USD 43.69 billion in 2025 and is estimated to grow from USD 46.45 billion in 2026 to reach USD 63.11 billion by 2031, at a CAGR of 6.32% during the forecast period (2026-2031). Robust LNG export commitments, rising blue-hydrogen projects, and multi-year power-purchase agreements (PPAs) signed by data-center operators have created structural demand, cushioning the United States shale gas market against short-term price swings.[1] Marketed production climbed to 118.5 Bcf/d in 2025 as the Mountain Valley Pipeline (MVP) relieved Appalachian takeaway constraints and Permian associated-gas output rose 11% alongside oil drilling.[2] Operators now compete less on wellhead economics than on access to gathering, processing, and LNG liquefaction infrastructure. Federal leasing cadence and methane-intensity certification frameworks, which can secure 5-10% price premiums over Henry Hub, further shape capital allocation.
Key Report Takeaways
- By hydrocarbon type, shale gas commanded 78.8% of the United States shale gas market share in 2025, while shale oil recorded the fastest CAGR at 6.8% through 2031.
- By extraction technology, combined horizontal drilling and hydraulic fracturing captured 83.7% of the United States shale gas market size in 2025 and is advancing at a 6.5% CAGR to 2031.
- By application, industrial and petrochemical feedstock accounted for 41.5% of the United States shale gas market size in 2025 and is expanding at a 6.6% CAGR through 2031, outpacing power generation.
Note: Market size and forecast figures in this report are generated using Mordor Intelligence’s proprietary estimation framework, updated with the latest available data and insights as of January 2026.
United States Shale Gas Market Trends and Insights
Drivers Impact Analysis*
| Driver | (≈) % Impact on CAGR Forecast | Geographic Relevance | Impact Timeline |
|---|---|---|---|
| Robust LNG export capacity additions post-2026 | +1.8% | Gulf Coast (Texas, Louisiana) with global links to Asia-Pacific and Europe | Medium term (2-4 years) |
| Rising demand from blue-hydrogen projects | +0.9% | Gulf Coast industrial corridors, emerging Appalachian hubs | Long term (≥ 4 years) |
| Depletion-driven shift from conventional to shale resources | +0.7% | National, with accelerated transitions in Permian, Haynesville, Marcellus basins | Long term (≥ 4 years) |
| Methane-intensity certification premiums | +0.6% | Appalachia, Haynesville, Permian | Short term (≤ 2 years) |
| Digital twin-enabled well optimization | +0.5% | Permian, Haynesville, Marcellus | Medium term (2-4 years) |
| CO₂-based fracturing gaining regulatory support | +0.3% | Permian Basin, select Appalachian counties | Long term (≥ 4 years) |
| Source: Mordor Intelligence | |||
Robust LNG Export Capacity Additions Post-2026
Golden Pass LNG began service in early 2026 with 2.3 Bcf/d, while Cheniere’s Corpus Christi Stage 3 expansion adds 2.7 Bcf/d by 2029.[3] Together with Plaquemines and Calcasieu Pass, these projects absorb 7–8 Bcf/d of incremental supply, tightening balances and lifting Henry Hub from USD 2.21/MMBtu in 2024 to USD 3.52/MMBtu in 2025. The Federal Energy Regulatory Commission trimmed pre-construction timelines by up to 18 months, enabling faster final-investment decisions.[4]
Rising Demand from Blue-Hydrogen Projects
Chevron’s USD 5 billion Project Labrador in Baytown will consume 0.3 Bcf/d of gas when it reaches 1.2 million t/yr of low-carbon hydrogen capacity in 2027. Air Products’ Louisiana complex follows a comparable scale. The Inflation Reduction Act’s 45V credit of up to USD 3/kg steers investors toward gas-fed projects where pipeline CO₂ storage is available.
Depletion-Driven Shift from Conventional to Shale
Conventional Gulf Coast fields now decline 8–12% yearly, pushing operators toward shale volumes with shorter cycle times. Appalachia delivered 36.6 Bcf/d in 2025 after MVP eased basis penalties, while Permian gas rose 2.7 Bcf/d despite flaring constraints.
Growth in Data-Center Power-Purchase Agreements
Data centers consumed 17 GW of electricity in 2023 and are projected to reach 35 GW by 2030, a demand surge that has triggered a wave of multi-year PPAs linked to natural-gas-fired generation. Dominion Energy plans 2,600 MW of new gas capacity in Virginia to supply hyperscale campuses concentrated along the I-95 corridor, while American Electric Power is advancing a 1,000 MW combined-cycle plant in Ohio to serve similar loads. These projects secure firm offtake for producers, insulating volumes from spot-market swings and supporting pipeline expansions that underpin the United States shale gas market. Power developers structure 10- to 15-year PPAs that reference Henry Hub plus a fixed capacity adder, effectively creating a price floor and improving bankability for midstream investments. The concentration of data-center growth in Virginia, Texas, and Ohio links incremental gas demand directly to regions already rich in shale supply, shortening transport distances and reducing basis risk for operators. Taken together, these PPAs add roughly 0.4% to the forecast CAGR by locking in baseload demand that would otherwise be subject to economic dispatch or renewable intermittency constraints.
Restraints Impact Analysis*
| Restraint | (≈) % Impact on CAGR Forecast | Geographic Relevance | Impact Timeline |
|---|---|---|---|
| Federal leasing pauses on public lands | -0.8% | Western states with high federal mineral ownership | Short term (≤ 2 years) |
| Growing ESG-led capital flight | -0.6% | National, with acute effects in Appalachia and Permian | Medium term (2-4 years) |
| Persistent sand & water logistics bottlenecks | -0.5% | Permian Basin, Haynesville | Short term (≤ 2 years) |
| Community opposition in Appalachia | -0.4% | Pennsylvania, West Virginia, Ohio | Medium term (2-4 years) |
| Source: Mordor Intelligence | |||
Federal Leasing Pauses on Public Lands
BLM’s Instruction Memorandum IM-2025-028 shortened parcel reviews to six months and reinstated quarterly sales, reversing an 80% decline in lease volumes between 2021 and 2024. The One Big Beautiful Bill Act locked in a 12.5% royalty floor, unlocking inventory in New Mexico and Wyoming for United States shale gas market participants.
Escalating EPA Waste Emissions Charge
The U.S. Environmental Protection Agency’s final methane rule imposes a Waste Emissions Charge that rises from USD 900 per ton in 2024 to USD 1,200 in 2025 and USD 1,500 from 2026 onward for facilities emitting more than 25,000 metric tons of CO₂e annually. Operators with older pneumatic controllers and high-bleed equipment face the greatest exposure because retrofit timelines can span 12–18 months, often clashing with drilling schedules and capital budgets. Mid-tier producers report that the charge adds USD 0.05–0.07 per MMBtu to full-cycle costs, narrowing margins in sub-USD 3.50 markets while integrated majors leverage larger capital programs to accelerate emissions-abatement projects. Although sustainability-linked credit facilities can offset some financing costs, lenders reduce interest-rate incentives when borrowers exceed methane-intensity thresholds, amplifying the rule’s financial impact. The near-term cash drain diverts capital from drilling toward leak detection and repair, reducing rig counts and trimming 0.3% from the forecast CAGR.
*Our forecasts treat driver/restraint impacts as directional, not additive. The impact forecasts reflect baseline growth, mix effects, and variable interactions.
Segment Analysis
By Hydrocarbon Type : Liquids-Focused Drilling Tempers Gas Dominance
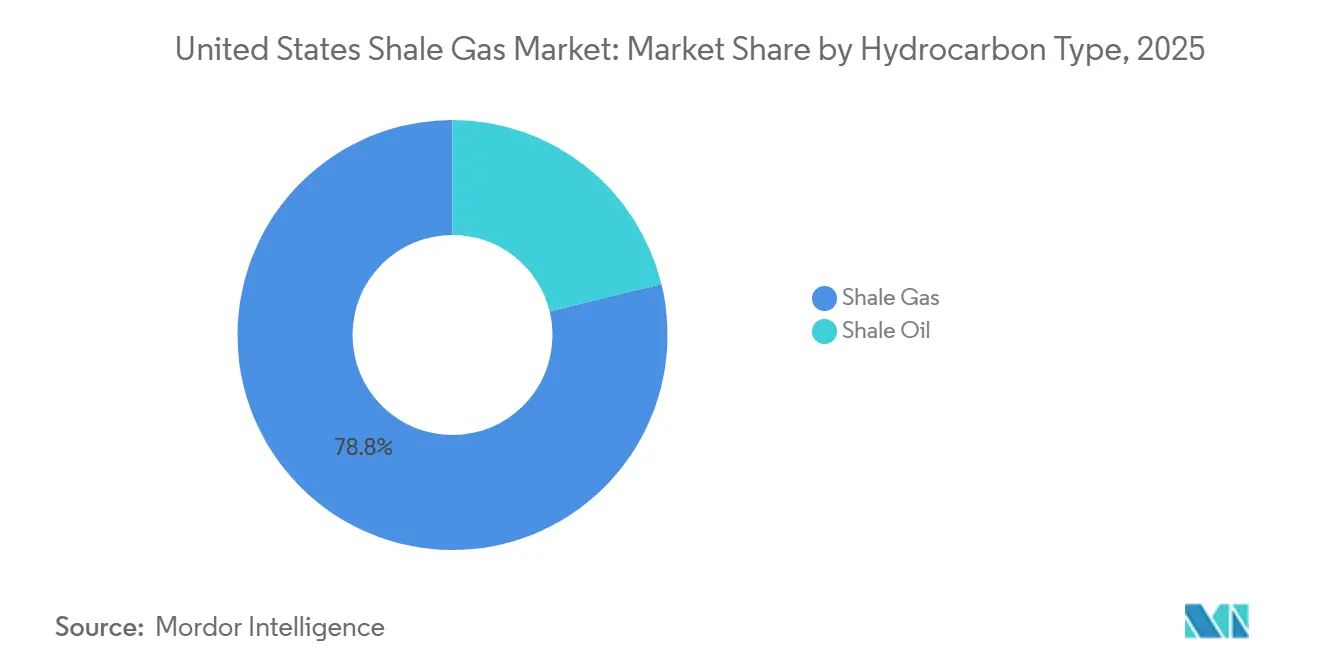
Shale gas retained a 78.8% United States shale gas market share in 2025, but shale oil is expanding at a 6.8% CAGR through 2031 as Permian operators chase liquids-rich zones where breakevens sit below USD 40 per barrel. Devon Energy told investors in February 2026 that it would “stay as oily as we can,” a stance that redirected rigs from the Haynesville to the Delaware Basin even though associated gas output still climbed 11% year over year to 27.7 Bcf/d. This pivot compressed the basin’s gas-to-oil drilling ratio to 1:5 by early 2026, yet it did not erode total gas supply because liquids development inevitably lifts methane volumes. Appalachia’s Marcellus and Utica formations remain almost entirely dry gas; EQT produced 6.2 Bcf/d in mid-2025 and locked 4.5 MTPA into long-term LNG contracts that hedge one-third of its output against spot volatility.
The liquids premium also influences capital flows outside the Permian. Chevron’s USD 6.5 billion divestiture of Canadian oil sands and Duvernay shale assets in October 2024 freed cash for U.S. Permian drilling where infrastructure is ready and regulatory timelines are short. In contrast, Haynesville operators drilled deeper, higher-cost intervals only after Henry Hub recovered to USD 3.52/MMBtu in 2025, proving commodity prices still steer activity despite corporate statements about “disciplined growth”. Even so, liquids-rich drilling narrows but does not eliminate the volume gap; dry-gas provinces continue to anchor the United States shale gas market size because of their low finding costs and existing pipeline networks. The result is a bifurcated supply stack in which dry-gas basins provide price stability while liquids-heavy plays offer margin upside during oil rallies.

By Extraction Technology : Combined Techniques Secure Productivity Edge
Combined horizontal drilling and shale gas hydraulic fracturing accounted for 83.7% of production methods in 2025 and is forecast to grow at a 6.5% CAGR through 2031, underscoring that neither technique alone can commercialize tight rock. Average laterals have stretched to 10,000–15,000 feet, and stage spacing tightened to 150–200 feet, doubling per-well proppant demand to as much as 30 million pounds and boosting initial production rates by 15–20% when paired with real-time fiber-optic monitoring. Electric frac fleets introduced by Schlumberger in 2025 lowered diesel consumption 60% and proved compatible with CO₂-water blends, solving viscosity limits that once hampered non-water fracturing. ProFrac Services and Seismos added a closed-loop workflow in late 2025 that tweaks pump rates based on microseismic feedback, raising perforation efficiency 7% and cutting water use 12% per stage.
Vertical reservoirs that rely on hydraulic fracturing only, such as Powder River coalbeds, and isolated horizontal wells in naturally fractured chalks now represent a minority niche. Their lower capital requirements are offset by higher decline curves and limited scalability, so investors favor the productivity edge of the combined-technique segment, preserving its dominant slice of the United States shale gas market size. Logistics is the principal brake on further gains; Delta Sands’ 3 million t/yr Haynesville mine and Atlas Energy Solutions’ 42-mile DuneExpress conveyor reduce sand trucking miles, yet completion crews still idle up to two weeks during peak demand when sand or water is short. As operators digitize well pads and embed twin models, the performance gulf widens between producers that can afford high-frequency data and those that cannot, reinforcing the scale advantage already baked into the combined-technique cohort.
By Application : Petrochemical Feedstock Outpaces Power Generation
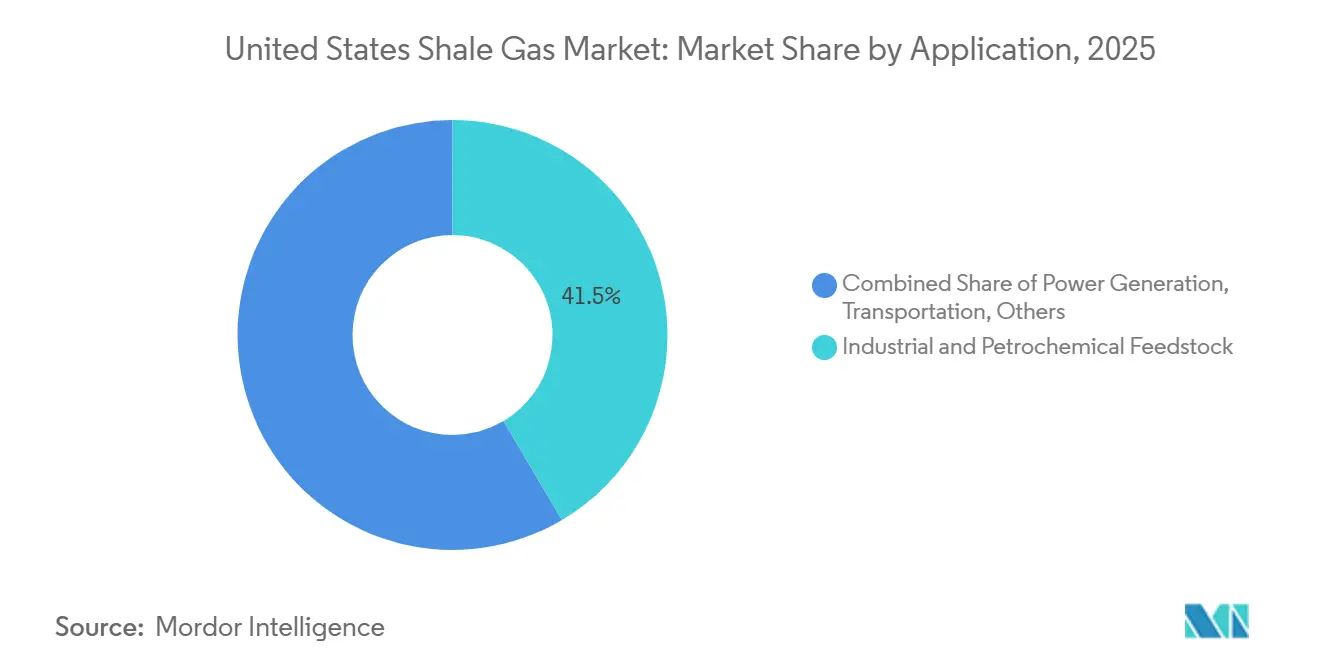
Industrial and petrochemical feedstock absorbed 41.5% of 2025 demand and is projected to expand at a 6.6% CAGR, eclipsing power growth as Gulf Coast crackers hit full stride. Chevron Phillips Chemical’s Cedar Bayou line reached 1.5 million t/yr of ethylene in 2026, drawing roughly 0.4 Bcf/d of ethane, while Shell’s Monaca plant locks in 20-year supply agreements that price ethane at a 3–5% premium over Mont Belvieu hub values. These take-or-pay contracts shield producers from weak spot liquids pricing and anchor additional NGL pipeline expansions out of the Permian and Eagle Ford. Blue-hydrogen projects compound the trend: Chevron’s Project Labrador will consume 0.3 Bcf/d when fully online, and Air Products’ Louisiana complex mirrors that volume on a 30-year term.
Power generation remains the single largest outlet, but its relative share shrinks because interconnection queues average three to five years and local opposition delays gas-fired buildouts in Virginia and Ohio. Data-center developers still favor gas for reliability, yet many procure electricity through behind-the-meter PPAs that bypass regulated utilities, softening load growth visible in public capacity filings. Transportation applications gain slowly as Cummins’ X15N engine reaches fleets that can absorb its USD 50,000–70,000 price premium, and residential usage drifts sideways as heat-pump adoption offsets population growth. The net effect is a demand stack increasingly anchored by long-dated industrial contracts, reinforcing price floors and lifting the United States shale gas market share of feedstock users even as total end-use diversity preserves market resilience.
Geography Analysis
Texas and Louisiana together captured more than half of incremental value gains in the United States shale gas market size between 2025 and 2026 as new LNG trains at Golden Pass, Calcasieu Pass and the Corpus Christi Stage 3 expansion absorbed an additional 7–8 Bcf/d of Gulf Coast output. Production in the Permian portion of Texas rose 11% year over year to 27.7 Bcf/d, helped by the Permian Highway and Matterhorn Express pipelines that added 3.5 Bcf/d of takeaway in 2026. Louisiana’s Haynesville Basin contributed 14.9 Bcf/d in 2025, a 4% increase after higher Henry Hub prices justified 15,000–18,000-foot laterals that tap deeper intervals. The concentration of liquefaction, petrochemical and blue-hydrogen projects along the Gulf Coast anchors long-dated feed-gas contracts that reduce basis volatility and shorten payback periods for gathering and processing investments.
Appalachia, led by Pennsylvania, West Virginia and Ohio, delivered 36.6 Bcf/d in 2025 and commanded a 31% United States shale gas market share after the Mountain Valley Pipeline eased multi-year takeaway bottlenecks. EQT alone supplied 6.2 Bcf/d and shielded one-third of that volume with 4.5 MTPA of long-term LNG offtake, insulating cash flow from spot swings. Nevertheless, the region’s growth pace trails the Gulf Coast because community groups cite more than 500 MVP water-quality violations to challenge new gathering lines and generation projects. Legal uncertainty over subsurface rights, highlighted by the Tera v. Rice Drilling remand, further slows pad development and keeps well counts below 2022 peaks.
Western federal-lands output rebounded after the July 2025 policy reset that unlocked 3.5 million acres across New Mexico and Wyoming, yet earlier leasing pauses still leave an inventory hole that will take several years to refill. Producers that depend on Bureau of Land Management acreage shifted rigs to private lands during 2022-2024, so the near-term uplift is modest even though royalty rates fell to a 12.5% floor. Colorado’s DJ Basin and Utah’s Uinta Basin add niche volumes but face ozone non-attainment rules that cap rig counts, while North Dakota’s Bakken sends most associated gas north via the Northern Border system, limiting local price gains. Combined, western states are expected to contribute just 0.4 Bcf/d of net new supply in 2026, underscoring that future growth hinges on resolving permitting timelines and expanding gathering infrastructure rather than on drill-bit productivity alone.
Competitive Landscape
Mega-mergers have re-shaped producer rankings since late 2024, raising concentration at the top of the United States shale gas market. Chesapeake Energy and Southwestern Energy closed a USD 7.4 billion stock deal in October 2024 and rebranded as Expand Energy, instantly becoming the nation’s largest gas supplier at 7.9 Bcfe/d. Devon Energy followed by announcing a USD 21.4 billion all-equity merger with Coterra Energy in February 2026, a transaction that combines 750,000 net Delaware Basin acres and targets USD 1 billion of annual cost synergies. ConocoPhillips expanded through a USD 16.5 billion purchase of Marathon Oil in November 2024, then monetized USD 1.3 billion of Oklahoma assets to Stone Ridge Energy, signaling a disciplined focus on core Permian and Eagle Ford acreage. Enverus ranked ExxonMobil, Expand Energy and ConocoPhillips as the top three domestic producers in January 2026 with a combined 5.5 MMboe/d, leaving mid-tier independents well below the scale required to negotiate firm LNG offtake or pipeline capacity on equal footing.
Technology adoption now serves as a second dividing line. Precision Drilling’s digital-twin platform cut non-productive time 50% on Haynesville rigs, while Chevron and Halliburton reported 15–20% uplift in initial production from intelligent fracturing pilots in the Permian. EQT intends to reclaim the top-producer spot by adding 2.5 Bcf/d of output this decade, underpinned by 4.5 MTPA of LNG sales and a field-wide digital-twin rollout that optimizes stage designs in real time. Methane-intensity certification creates another wedge: Centrica pays 5–7% premiums for MiQ-certified volumes, and U.S. lenders trim interest margins 5–10 basis points for borrowers that hold emissions below 0.15%, advantages most visible among large, data-rich operators. Smaller firms lacking continuous-monitoring infrastructure struggle to access the same pricing or credit terms.
Private-equity groups exploit asset sales triggered by mega-mergers, carving out lean operators that hedge 70–80% of production and thrive below USD 3.00/MMBtu. Stone Ridge Energy’s purchase of ConocoPhillips’ Oklahoma position typifies this strategy and adds a cash-flowing foothold in the Anadarko Basin. Service-sector innovation further widens the capability gap: Schlumberger’s fully electric frac fleet lowers diesel consumption 60% and accommodates CO₂-water blends, a differentiator for operators pursuing 45Q tax credits. Atlas Energy Solutions’ DuneExpress conveyor and Delta Sands’ in-basin mines trim sand costs by USD 2–3 per ton, but smaller producers still endure 10-day completion delays during peak seasons when logistics pinch. Collectively, the five largest companies now control roughly 75% of marketed supply, confirming a moderately consolidated arena in which scale, infrastructure access and data analytics determine competitive advantage.
United States Shale Gas Industry Leaders
-
Exxon Mobil Corporation
-
EQT Corporation
-
Chesapeake Energy Corp.
-
Chevron Corporation
-
Shell plc
- *Disclaimer: Major Players sorted in no particular order
Recent Industry Developments
- February 2026: Devon Energy and Coterra Energy announced a USD 21.4 billion equity merger aimed at USD 1 billion annual cost synergies, creating a 1.6 MMboe/d super-independent.
- January 2026: Chevron approved the Leviathan gas field expansion, reaffirming its pivot toward gas-weighted assets.
- December 2025: EPA’s interim rule extended Super Emitter deadlines, saving industry USD 750 million over 11 years while retaining its escalating Waste Emissions Charge.
- August 2025: ConocoPhillips bought Marathon Oil for USD 16.5 billion and later sold USD 1.3 billion in Oklahoma assets to Stone Ridge Energy.
United States Shale Gas Market Report Scope
Shale gas is an unconventional natural gas found within shale formations, which are fine-grained sedimentary rocks. Unlike conventional gas that migrates to porous reservoir rocks such as sandstone, shale gas remains confined in its original source rock due to the rock's very low permeability.
The United States Shale Gas Market is segmented into hydrocarbon type, extraction technology, and application. By hydrocarbon type, the market is segmented into shale gas and shale oil. By extraction technology, the market is segmented into horizontal drilling only, hydraulic fracturing only, and combined horizontal and hydraulic fracturing. By application, the market is segmented into power generation, industrial and petrochemical feedstock, residential and commercial heating, and transportation. For each segment, the market sizing and forecasts have been done on the basis of value (USD).
By Hydrocarbon Type
| Shale Gas |
| Shale Oil |
By Extraction Technology
| Horizontal Drilling Only |
| Hydraulic Fracturing Only |
| Combined Horizontal and Hydraulic Fracturing |
By Application
| Power Generation |
| Industrial and Petrochemical Feedstock |
| Residential and Commercial Heating |
| Transportation (LNG and CNG) |
| By Hydrocarbon Type | Shale Gas |
| Shale Oil | |
| By Extraction Technology | Horizontal Drilling Only |
| Hydraulic Fracturing Only | |
| Combined Horizontal and Hydraulic Fracturing | |
| By Application | Power Generation |
| Industrial and Petrochemical Feedstock | |
| Residential and Commercial Heating | |
| Transportation (LNG and CNG) |
Key Questions Answered in the Report
What is the market size of United States shale gas market?
The United States shale gas market stands at USD 46.45 billion in 2026 and is expected to reach USD 63.11 billion by 2031, expanding at a 6.32% CAGR over 2026-2031.
What is driving new investment in Gulf Coast gas infrastructure?
Golden Pass, Corpus Christi, Plaquemines, and Calcasieu Pass LNG terminals, together absorbing 7-8 Bcf/d, plus blue-hydrogen complexes that secure long-term feedstock contracts.
Which segment is expanding the fastest inside the United States shale gas market?
Industrial and petrochemical feedstock, led by Gulf Coast ethane crackers, is advancing at 6.6% CAGR, outpacing power generation.
How are producers monetizing certified low-methane gas?
European buyers such as Centrica pay 5-7% premiums for MiQ-certified volumes, while U.S. banks offer cheaper credit to operators meeting methane-intensity thresholds.
What impact do federal leasing policies have on future supply?
The July 2025 One Big Beautiful Bill Act restored quarterly lease sales and lowered royalties, unlocking 3.5 million acres but leaving a two-year inventory gap from earlier pauses.
Why are mega-mergers accelerating?
Scale allows firms to secure firm-transport capacity, negotiate LNG offtake, deploy digital twins, and lower cost of capital, advantages that mid-tier independents struggle to replicate.