Market Overview
| Study Period | 2021 - 2031 |
|---|---|
| Forecast Data Period | 2026 - 2031 |
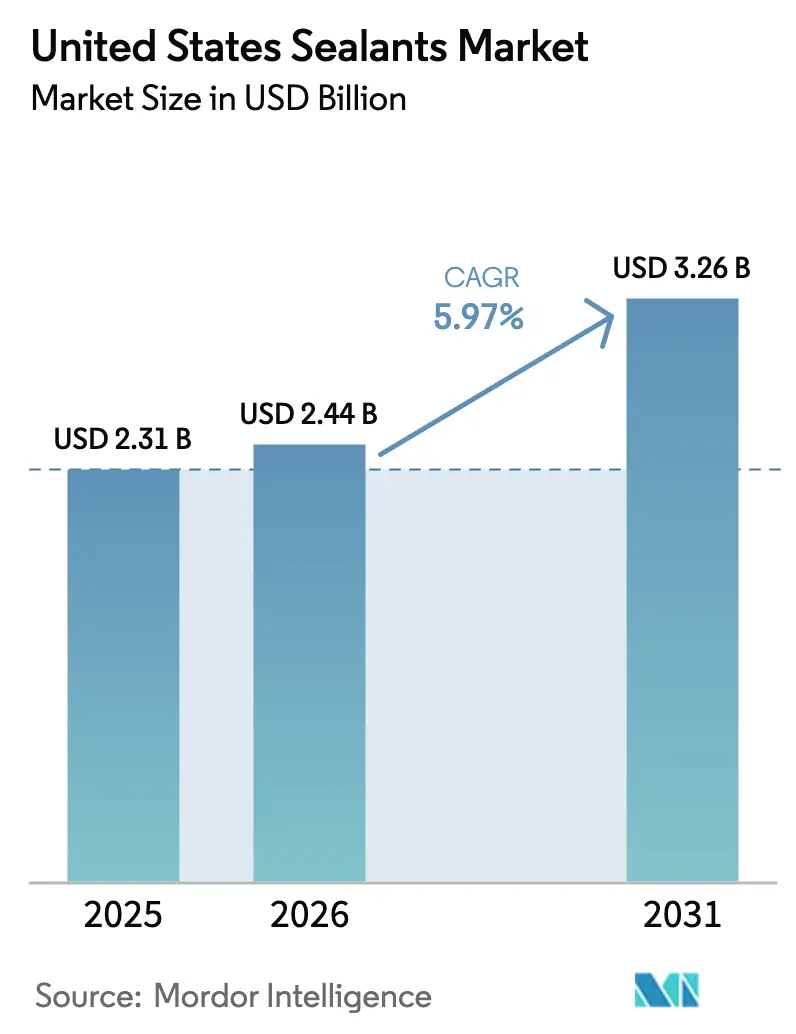
| Base Year Market Size (2025) | USD 2.31 Billion |
| Market Size (2026) | USD 2.44 Billion |
| Market Size (2031) | USD 3.26 Billion |
| Growth Rate (2026 - 2031) | 5.97% CAGR |
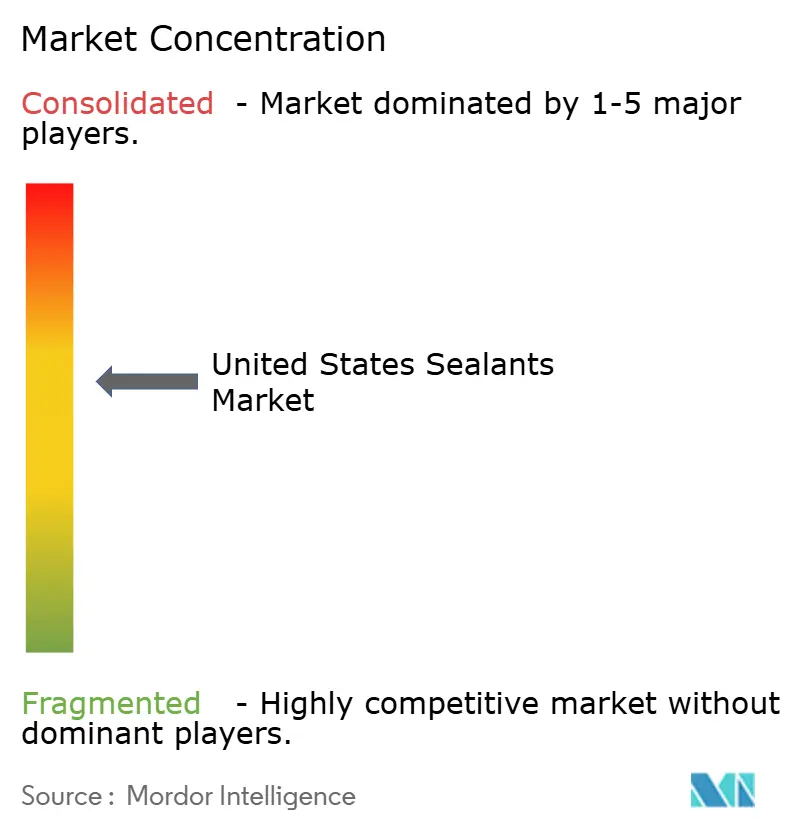
| Market Concentration | Medium |
Major Players *Disclaimer: Major Players sorted in no particular order Image © Mordor Intelligence. Reuse requires attribution under CC BY 4.0. | |
United States Sealants Market Analysis by Mordor Intelligence
The United States Sealants Market size is projected to expand from USD 2.31 billion in 2025 and USD 2.44 billion in 2026 to USD 3.26 billion by 2031, registering a CAGR of 5.97% between 2026 to 2031. Federal infrastructure appropriations, a rapid pivot toward electric-vehicle (EV) battery-pack production, and stricter volatile-organic-compound (VOC) limits that favor water-borne chemistries are the three structural forces most responsible for the current trajectory of the United States sealants market. Silicone grades remain the revenue leader, yet hybrid and silyl-modified-polymer (SMP) options are expanding quickly because they cure without isocyanates, tolerate a wider substrate mix, and simplify workplace-safety compliance. Healthcare construction is emerging as the fastest-growing end-use segment, supported by hospital capital-expenditure programs that emphasize sterile, low-VOC interior assemblies. Regional demand is strongest in the South, although the West is registering the sharpest gains as battery-cell gigafactories and modular-construction pilots cluster in Mountain and Pacific states.
Key Report Takeaways
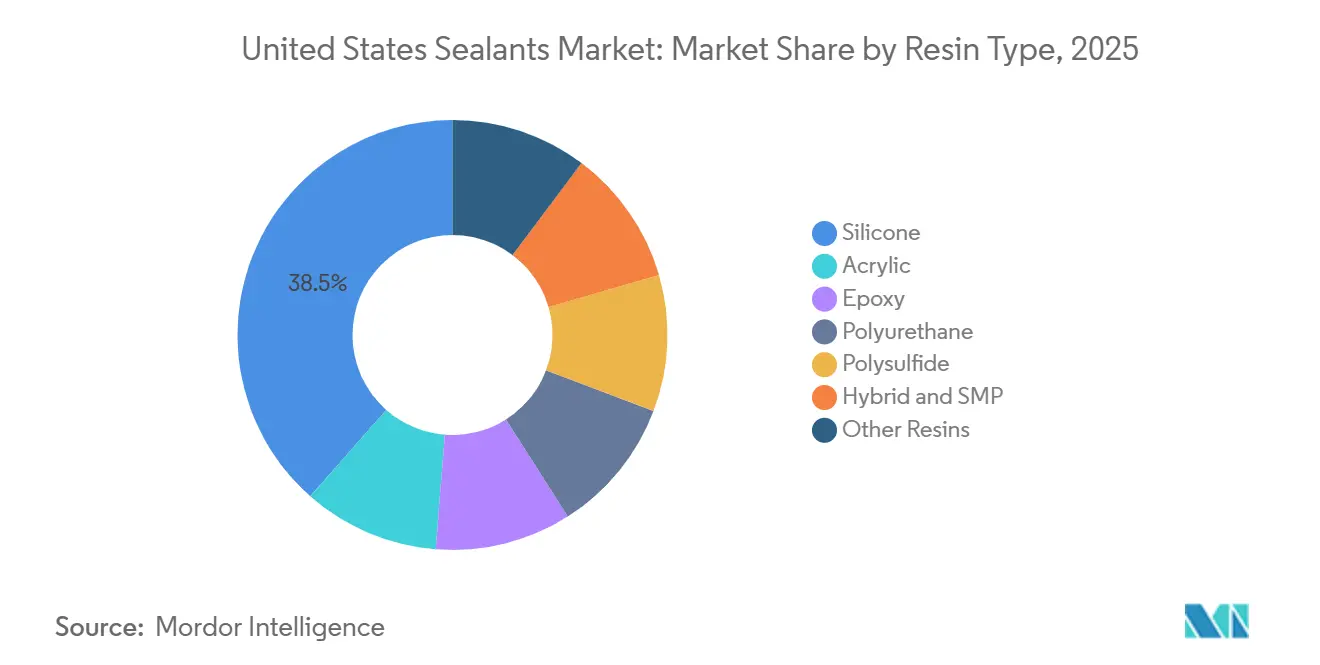
- Silicone formulations accounted for 38.50% of 2025 revenue, while hybrid and SMP chemistries are advancing at a 7.76% CAGR through 2031, signaling a decisive formulation shift toward isocyanate-free cures.
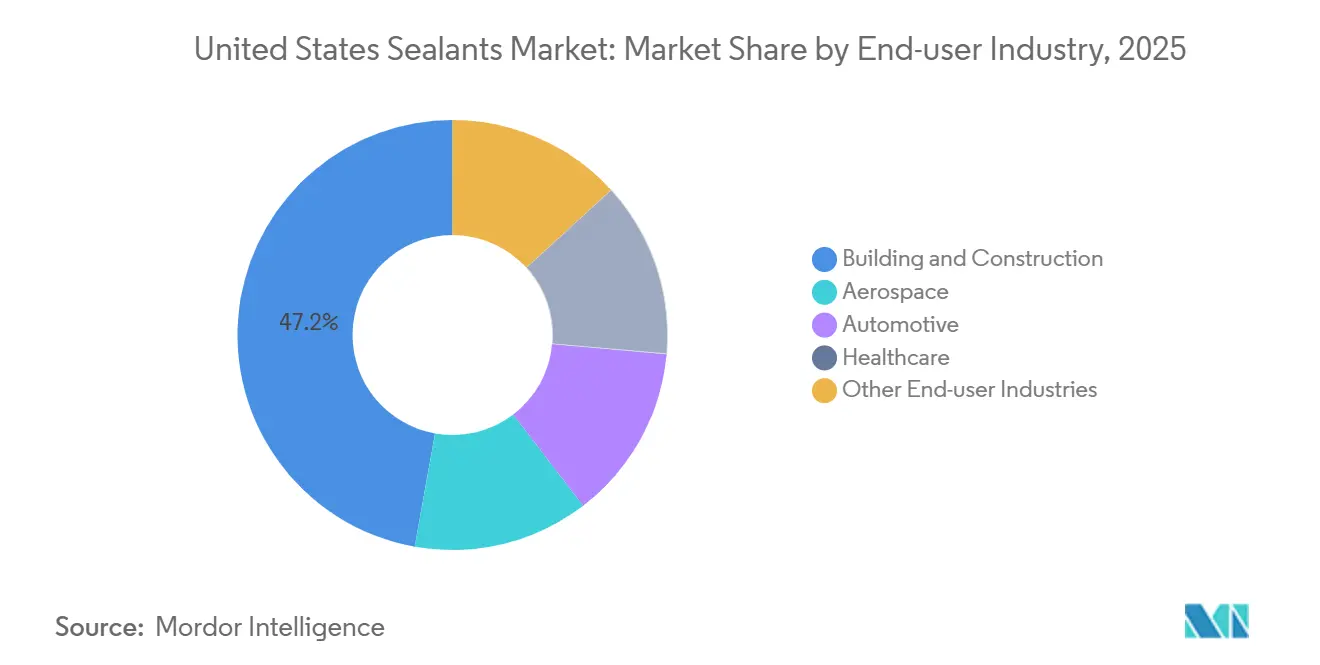
- Building and construction absorbed 47.20% of 2025 volume, yet healthcare applications are projected to rise at a 7.41% CAGR through 2031 on the back of USD 30.7 billion in 2026 hospital capital spending.
- Water-borne technology represented 37.60% of 2025 demand; reactive systems are set to grow 7.35% annually through 2031 as aerospace and EV producers adopt two-part and moisture-cure products.
- The South captured 34.50% of 2025 revenue, but the West is forecast to expand at a 7.20% CAGR through 2031 on the strength of EV battery-pack manufacturing and modular-building activity.
Note: Market size and forecast figures in this report are generated using Mordor Intelligence’s proprietary estimation framework, updated with the latest available data and insights as of January 2026.
United States Sealants Market Trends and Insights
Drivers Impact Analysis*
| Drivers | (~) % Impact on CAGR Forecast | Geographic Relevance | Impact Timeline |
|---|---|---|---|
| Surge in residential renovation driving demand for flexible sealant solutions | +1.2% | National, with outsized gains in South and West regions | Medium term (2-4 years) |
| Federal infrastructure funding accelerating highway and bridge maintenance sealant use | +0.9% | National, concentrated in states with aging Interstate corridors | Short term (≤ 2 years) |
| Rising adoption of EV battery pack liquid gasketing in US manufacturing plants | +1.5% | West and South, anchored by Michigan, Tennessee, Georgia, Texas battery-cell gigafactories | Medium term (2-4 years) |
| Growth of modular construction requiring pre-applied sealant tapes and foams | +0.8% | National, early momentum in Northeast and Pacific Northwest | Long term (≥ 4 years) |
| Shift to healthcare facility expansion boosting sterile and biocompatible sealant demand | +0.7% | National, led by Sun Belt states with population in-migration | Medium term (2-4 years) |
| Source: Mordor Intelligence | |||
Surge in Residential Renovation Driving Demand for Flexible Sealant Solutions
Homeowners constrained by mortgage lock-in effects are channeling discretionary income into kitchen, bath, and exterior upgrades that rely on easy-to-apply acrylic latex and silicone caulks. NAHB forecasts a 3% lift in remodeling outlays in 2026 and another 2% in 2027, while CivicScience polling shows 58% of owners plan a project within twelve months[1]National Association of Home Builders, “Remodeling Market Forecast,” nahb.org. Water-borne acrylics that meet Environmental Protection Agency Method 24 dominate interior work because they cure quickly and allow rapid repainting. Manufacturers are responding with mildew-resistant, low-modulus sealants that hold color stability and offer soap-and-water cleanup. These attributes help capture retail shelf space where price-per-linear-foot displays influence contractor and DIY buyer choices[2]Environmental Protection Agency, “Method 24 Guidance,” epa.gov .
Federal Infrastructure Funding Accelerating Highway and Bridge Maintenance Sealant Use
The Infrastructure Investment and Jobs Act (IIJA) earmarks roughly USD 350 billion for highway programs through FY 2026, driving contract lettings for concrete-joint repair and expansion-joint upgrades. Even though the FY 2026 federal budget proposes rescinding USD 4 billion in unobligated charging-infrastructure grants, state transportation departments continue to specify hot-applied rubberized-asphalt, silicone, and polysulfide sealants that pass ASTM movement requirements. National performance-based specifications, including adhesion per ASTM C794 and ±25% movement capability, are consolidating demand among suppliers able to fund third-party testing and manage multi-state approvals. Smaller, regional compounders that lack accredited laboratories face increasing barriers to entry.
Rising Adoption of EV Battery-Pack Liquid Gasketing in US Manufacturing Plants
Automotive OEMs are replacing compression-molded gaskets with form-in-place liquid gasketing (FIPG) dispensed directly onto battery-pack flanges. The method supports higher throughput because cure times fall below thirty minutes and eliminates secondary fasteners that add weight. Henkel’s LOCTITE platform and RAMPF solutions lead current installations, including Rivian’s 9-million-square-foot Georgia assembly complex backed by a USD 6.57 billion Department of Energy loan. Although potential NEVI grant rescissions inject short-term uncertainty, long-term electrification plans keep investment pipelines active. Sealants featuring thermal-conductivity additives and UL 94 V-0 compliance are now regarded as integral thermal-management components rather than commodity consumables, supporting premium price points.
Growth of Modular Construction Requiring Pre-Applied Sealant Tapes and Foams
Labor shortages, 82% of contractors report craft-worker gaps and wage inflation at 4.5% year-over-year, sharpen the appeal of factory-built wall panels and bathroom pods that arrive with pre-applied butyl tapes or one-component polyurethane foams. Controlled indoor fabrication improves ASTM E2357 air-barrier results and can trim on-site caulking labor by up to 40%. Early adoption is strongest in the Pacific Northwest and Northeast, yet broader uptake awaits code-official acceptance of third-party test data and manufacturer willingness to offer envelope-service-life warranties. Hot-melt beads applied during panel assembly are gaining share because they cure during transit and arrive installation-ready.
Restraints Impact Analysis*
| Restraints | (~) % Impact on CAGR Forecast | Geographic Relevance | Impact Timeline |
|---|---|---|---|
| Volatility in silicone raw-material costs impacting pricing strategies | -0.6% | National, with acute exposure for West Coast formulators reliant on Asian monomer imports | Short term (≤ 2 years) |
| Stricter VOC regulations limiting use of solvent-based sealants | -0.9% | California and Northeast states with CARB-aligned rules; spillover to national product portfolios | Medium term (2-4 years) |
| Emergent biobased adhesive technologies cannibalizing traditional sealant volumes | -0.4% | National, concentrated in early-adopter segments (green building, institutional procurement) | Long term (≥ 4 years) |
| Source: Mordor Intelligence | |||
Volatility in Silicone Raw-Material Costs Impacting Pricing Strategies
Dimethyldichlorosilane and polydimethylsiloxane feedstock prices swing with energy and silicon-metal costs in China’s Xinjiang and Inner Mongolia hubs. The Bureau of Labor Statistics noted a 25% rise in aluminum mill-shape prices through November 2025, a proxy for broader metals inflation that cascades into packaging and production overheads. Formulators without vertical integration or long-term feedstock contracts face gross-margin compression and must pass costs to distributors. Competitive responses include dual sourcing, captive monomer investments, and portfolio shifts toward premium acetoxy-cure silicones for glass and metal façades, where higher unit value can absorb raw-material volatility.
Stricter VOC Regulations Limiting Use of Solvent-Based Sealants
The South Coast Air Quality Management District’s Rule 1168 caps architectural sealant VOC content at 250 g/L for nonporous and 20 g/L for porous substrates, effectively phasing out many solvent-borne polyurethane and neoprene products in Southern California. California Air Resources Board (CARB) alignment and Ozone Transport Commission harmonization in the Northeast extend the limitation nationally because formulators rationalize SKUs for logistics efficiency. Mid-tier suppliers unable to finance reformulation or production-line retrofits face market-share erosion to multinationals whose European portfolios already comply with the EU Paints Directive. Compliance timelines spread research and development costs over multiple years, yet inventory write-offs and new packaging requirements compress working capital in the near term.
*Our forecasts treat driver/restraint impacts as directional, not additive. The impact forecasts reflect baseline growth, mix effects, and variable interactions.
Segment Analysis
By Resin Type: Hybrids Gain as Isocyanate-Free Cures Attract OEMs
Silicones held 38.50% of 2025 revenue, anchoring the United States sealants market share in applications that demand UV stability and temperatures from -60 °C to +200 °C. Hybrids and SMPs are projected to deliver a 7.76% CAGR through 2031 as automotive and facade-glazing specifiers prioritize primer-less adhesion and isocyanate-free workplace profiles. Polyurethanes retain highway-joint and industrial-floor niches, while water-borne acrylics dominate interior remodeling because they are paintable and clean up with water.
Hybrid and SMP offerings benefit from regulatory scrutiny of phthalate plasticizers, driving reformulation momentum. PPG’s USD 380 million Shelby, North Carolina, plant scheduled for H1 2027 underpins specialty polysulfide and epoxy programs for composite aircraft, confirming ongoing demand even as commodity volumes migrate toward SMPs. Henkel’s EUR 270 million acquisition of ATP Adhesive Systems strengthens its hybrid-technology roster for EV battery enclosures, advancing the United States sealants market size in transportation end uses.


By Technology: Reactive Systems Surge on Aerospace and EV Demand
Water-borne systems accounted for 37.60% of 2025 demand, propelled by nationwide VOC compliance mandates. Reactive chemistries, including moisture-cure, two-part, and UV-cure technologies, are forecast to expand 7.35% annually through 2031 as aerospace OEMs adopt fuel-resistant polysulfides and EV assemblers integrate two-part silicone beads for battery-pack sealing.
Hot-melt formulations, once siloed in packaging, are migrating into prefabricated panels where factory lines apply beads that cure en route, lowering onsite labor. Solvent-borne volumes face structural decline under Rule 1168 and CARB regulations, compelling formulators to focus research and development on reactive or water-borne alternatives. The transition improves average selling prices and elevates the value mix across the United States sealants market.
By End-User Industry: Healthcare Outpaces as Sterile Builds Accelerate
Building and construction retained 47.20% of the 2025 volume; however, healthcare projects will log a 7.41% CAGR through 2031, fueled by USD 38.8 billion in forecast 2030 capital outlays. Projects such as Geisinger’s USD 900 million campus expansion specify antimicrobial silicones and low-VOC acrylics that comply with ASTM C920 and LEED IEQ credits.
Automotive demand is bifurcating; while traditional internal-combustion body-seam applications decline, higher-value liquid gaskets for EV battery packs offset lost tonnage, sustaining the United States sealants market size for transportation segments. Aerospace remains a niche but high-margin arena, evidenced by PPG’s investment in a dedicated polysulfide facility that targets FAA-certified composite fuselage assemblies.
Geography Analysis
The South captured 34.50% of 2025 revenue, anchored by USD 293.7 billion in nonresidential starts and robust single-family permitting that continues to fortify the United States sealants market. High in-migration, favorable tax policies, and ongoing highway expansions under the IIJA sustain acrylic-latex consumption for exterior cladding and joint-seal repairs. Healthcare facility construction, exemplified by Methodist Stone Oak’s USD 104 million investment, amplifies sterile-grade silicone demand in surgical suites.
The West enjoys the fastest regional expansion at 7.20% CAGR through 2031, driven by battery-pack manufacturing clusters and modular-panel fabrication shops that specify low-VOC or pre-applied seals. Strict VOC rules under SCAQMD Rule 1168 force suppliers to innovate water-borne and reactive offerings, creating a technology leadership position that ripples nationwide. Labor shortages, 82% of builders report craft-worker gaps, accelerate modular adoption, translating into higher hot-melt-sealant volumes for pre-fabricated panels.
Northeast and Midwest markets together hold just over 30% of 2025 revenue. Slower population growth and an aging housing stock tilt spending toward renovation, where premium hybrid and silicone products with superior adhesion profiles gain traction. Ozone Transport Commission alignment with California VOC caps accelerates water-borne migration, simplifying national distribution and reinforcing consistency across the United States sealants market.
Competitive Landscape
The United States sealants market is moderately consolidated. Competitive intensity centers on three themes: securing low-carbon feedstocks, expanding domestic capacity, and merging to gain distribution depth. Henkel’s EUR 270 million ATP Adhesive Systems takeover fortifies its isocyanate-free hybrid portfolio for EV lines. Sika closed its CHF 220 million Akkim deal and unveiled plans for a new U.S. plant to meet near-shoring demand, underscoring its ambition to capture incremental market share.
PPG’s USD 380 million Shelby, North Carolina, facility targets high-value polysulfide aerospace products and differentiates the firm via FAA-qualified, fuel-resistant chemistries. BASF’s biomass-balance polyols offer an 18–20% carbon-footprint reduction and align with customer ESG scorecards, illustrating how upstream feedstock strategy now influences downstream sealant brand preference.
Emerging disruptors leverage reversible chemistries and bio-based inputs to satisfy LEED v5 or Living Building Challenge credits. Start-ups focusing on dynamic-covalent networks promote dismantlable joints attractive to institutional buyers bound by circular-economy targets. Regional compounders without captive monomer assets face margin pressure from raw-material spikes, accelerating consolidation, and potentially lifting the United States sealants market share of multinationals in the coming years.
United States Sealants Industry Leaders
Henkel AG & Co. KGaA
3M
Dow
Sika AG
H.B. Fuller Company
- *Disclaimer: Major Players sorted in no particular order

Recent Industry Developments
- March 2026: Henkel acquired ATP Adhesive Systems for approximately EUR 270 million (USD 290 million), broadening its EV-assembly gasket portfolio in North America.
- January 2025: PPG Industries broke ground on a USD 380 million, 198,000-square-foot aerospace-sealant plant in Shelby, North Carolina, targeting H1 2027 commissioning and more than 110 new jobs.


United States Sealants Market Report Scope
Sealants are elastomeric materials used to fill gaps, joints, or cracks, preventing water, air, dust, and fluid passage. Widely applied in construction and industrial sectors, they ensure waterproofing and structural flexibility in buildings, windows, automotive components, and appliances.
The United States sealants market is segmented by resin type, technology, and end-user industry. By resin type, the market is segmented into epoxy, polyurethane, silicone, polysulfide, hybrid and SMP, and other resins. By technology, the market is segmented into solvent-borne, water-borne, hot-melt, and reactive and others. By end-user industry, the market is segmented into aerospace, automotive, building and construction, healthcare, and other end-user industries. The report also covers the market size and forecasts for the four major regions of the country. For each segment, the market sizing and forecasts have been done based on revenue (USD).
By Resin Type
| Acrylic |
| Epoxy |
| Polyurethane |
| Silicone |
| Polysulfide |
| Hybrid and SMP |
| Other Resins |
By Technology
| Solvent-borne |
| Water-borne |
| Hot-melt |
| Reactive and Others |
By End-user Industry
| Aerospace |
| Automotive |
| Building and Construction |
| Healthcare |
| Other End-user Industries |
By Region
| Northeast |
| Midwest |
| South |
| West |
| By Resin Type | Acrylic |
| Epoxy | |
| Polyurethane | |
| Silicone | |
| Polysulfide | |
| Hybrid and SMP | |
| Other Resins | |
| By Technology | Solvent-borne |
| Water-borne | |
| Hot-melt | |
| Reactive and Others | |
| By End-user Industry | Aerospace |
| Automotive | |
| Building and Construction | |
| Healthcare | |
| Other End-user Industries | |
| By Region | Northeast |
| Midwest | |
| South | |
| West |


Market Definition
- End-user Industry - Building & Construction, Automotive, Aerospace, Healthcare, and Others are the end-user industries considered under the sealants market.
- Product - All sealant products are considered in the market studied
- Resin - Under the scope of the study, resins like Polyurethane, Epoxy, Acrylic, Silicone, and Others are considered
- Technology - For the purpose of this study, One component and Two component sealant technologies are taken into consideration.
| Keyword | Definition |
|---|---|
| Hot-melt Adhesive | Hot melt adhesives are generally 100% solid formulations, based on thermoplastic polymers. They are solid at room temperature and are activated upon heating above their softening point, at which stage they are liquid, and hence, can be processed. |
| Reactive Adhesive | A reactive adhesive is made up of monomers that react in the adhesive curing process and do not evaporate from the film during use. Instead, these volatile components become chemically incorporated into the adhesive. |
| Solvent-borne Adhesive | Solvent-borne adhesives are mixtures of solvents and thermoplastic, or slightly cross-linked polymers, such as polychloroprene, polyurethane, acrylic, silicone, and natural and synthetic rubbers (elastomers). |
| Water-borne Adhesive | Water-borne adhesives use water as a carrier or diluting medium to disperse a resin. They are set by allowing the water to evaporate or be absorbed by the substrate. These adhesives are compounded with water as a diluent, rather than a volatile organic solvent. |
| UV Cured Adhesive | UV curing adhesives induce curing and create a permanent bond without heating by using ultraviolet (UV) light or other radiation sources. An aggregation of monomers and oligomers is cured or polymerized by ultraviolet (UV) or visible light in a UV adhesive. Because UV is a radiating energy source, UV adhesives are often referred to as radiation curing or rad-cure adhesives. |
| Heat-resistant Adhesive | Heat-resistant Adhesives refer to those that do not break down under high temperatures. One aspect of a complicated system of circumstances is the adhesive's capacity to withstand disintegration brought on by high temperatures. As the temperature rises, adhesives may liquefy. They can withstand stresses resulting from differing coefficients of expansion and contraction, which might be an additional advantage. |
| Reshoring | Reshoring is the practice of moving commodity production and manufacturing back to the nation where the business was founded. Onshoring, inshoring, and back shoring are further terms used. Offshoring, the practice of producing items abroad to lower labor and manufacturing costs, is the opposite of this. |
| Oleochemicals | Oleochemicals are compounds produced from biological oils or fats. They resemble petrochemicals, which are substances made from petroleum. The oleochemical business is built on the hydrolysis of oils or fats. |
| Nonporous Materials | Nonporous materials are substances that do not permit the passage of liquid or air. Nonporous materials are those that are not porous, such as glass, plastic, metal, and varnished wood. Since no air can get through, less airflow is required to raise these materials, negating the requirement for high airflow. |
| EU-Vietnam Free Trade Agreement | A trade agreement and an investment protection agreement were concluded between the European Union and Vietnam on June 30, 2019. |
| VOC content | Compounds with limited solubility in water and high vapor pressure are known as Volatile Organic Compounds (VOCs). Many VOCs are human-made chemicals that are used and produced in the manufacture of paints, pharmaceuticals, and refrigerants. |
| Emulsion Polymerization | Emulsion polymerization is a method of producing polymers or connected groups of smaller chemical chains known as monomers, in a water solution. The method is often used to make water-based paints, adhesives, and varnishes, in which the water stays with the polymer and is marketed as a liquid product. |
| 2025 National Packaging Targets | In 2018, the Australian Environment Ministry set the following 2025 National Packaging Targets: 100% of the packaging must be reusable, recyclable, or compostable by 2025, 70% of plastic packaging must be recycled or composted by 2025, 50% of average recycled content must be included in packaging by 2025, and problematic and unnecessary single-use plastic packaging must be phased out by 2025. |
| Russian Government’s Import Substitution Policy | The Western sanctions suspended the distribution of several high-tech items to Russia, including those required by the raw material export sectors and the military-industrial complex. In response, the government launched an "import substitution" scheme, appointing a special commission to oversee its implementation in early 2015. |
| Paper Substrate | Paper substrates are paper sheets, reels, or boards with a base weight of up to 400 g/m2 that has not been converted, printed or otherwise altered. |
| Insulation Material | A material that inhibits or blocks heat, sound, or electrical transmission is known as Insulation Material. The variety of insulation materials includes thick fibers like fiberglass, rock and slag wool, cellulose, and natural fibers as well as stiff foam boards and sleek foils. |
| Thermal Shock | A temperature change known as thermal shock generates stress in a material. It commonly results in material breakdown and is especially prevalent in brittle materials like ceramics. When there is a quick temperature change, either from hot to cold or vice versa, this process occurs abruptly. It occurs more frequently in materials with poor heat conductivity and insufficient structural integrity. |


Research Methodology
Mordor Intelligence follows a four-step methodology in all our reports.
- Step-1: Identify Key Variables: The quantifiable key variables (industry and extraneous) pertaining to the specific product segment and country are selected from a group of relevant variables & factors based on desk research & literature review; along with primary expert inputs. These variables are further confirmed through regression modeling (wherever required).
- Step-2: Build a Market Model: In order to build a robust forecasting methodology, the variables and factors identified in Step-1 are tested against available historical market numbers. Through an iterative process, the variables required for market forecast are set and the model is built on the basis of these variables.
- Step-3: Validate and Finalize: In this important step, all market numbers, variables and analyst calls are validated through an extensive network of primary research experts from the market studied. The respondents are selected across levels and functions to generate a holistic picture of the market studied.
- Step-4: Research Outputs: Syndicated Reports, Custom Consulting Assignments, Databases & Subscription Platforms


