Market Overview
| Study Period | 2019 - 2031 |
|---|---|
| Forecast Data Period | 2026 - 2031 |
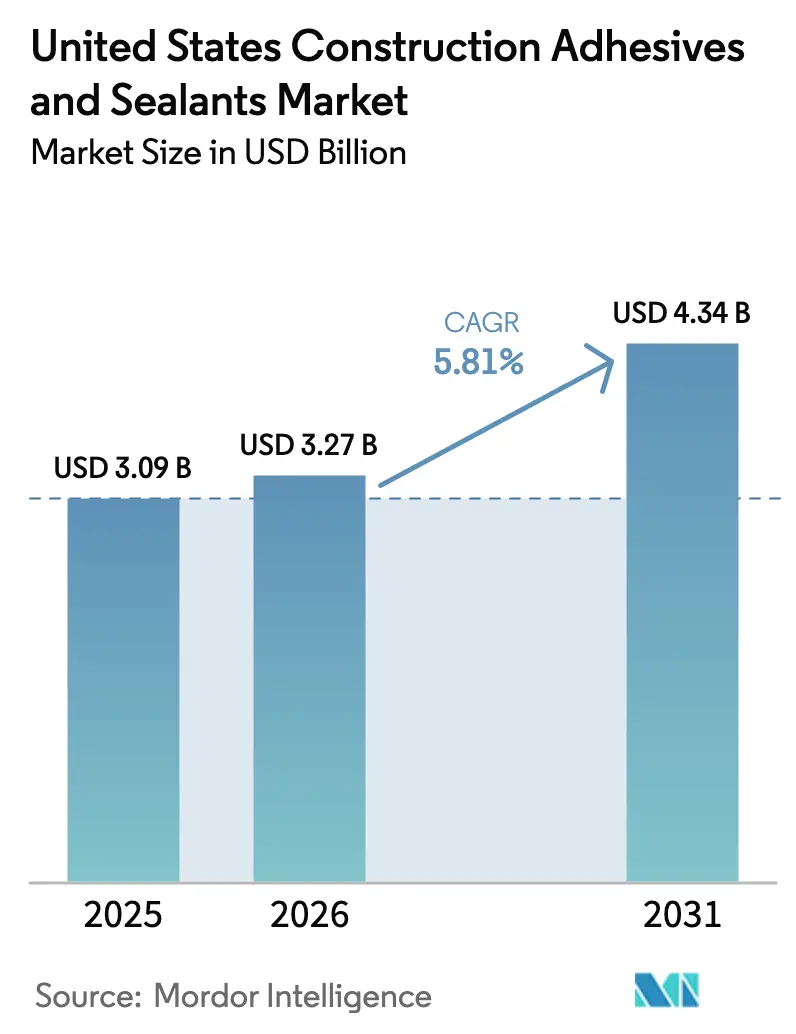
| Base Year Market Size (2025) | USD 3.09 Billion |
| Market Size (2026) | USD 3.27 Billion |
| Market Size (2031) | USD 4.34 Billion |
| Growth Rate (2026 - 2031) | 5.81% CAGR |
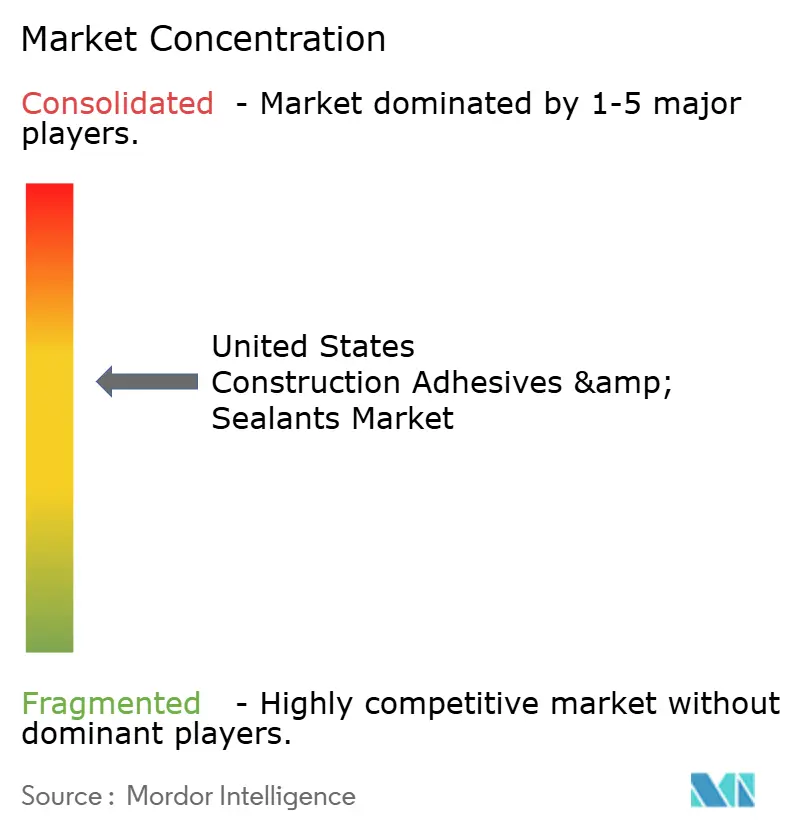
| Market Concentration | Medium |
Major Players *Disclaimer: Major Players sorted in no particular order Image © Mordor Intelligence. Reuse requires attribution under CC BY 4.0. | |
United States Construction Adhesives And Sealants Market Analysis by Mordor Intelligence
The United States Construction Adhesives and Sealants Market size is expected to increase from USD 3.09 billion in 2025 to USD 3.27 billion in 2026 and reach USD 4.34 billion by 2031, growing at a CAGR of 5.81% over 2026-2031. Implementation of tighter energy-code mandates, the steady rise of off-site modular construction, and fast-maturing bio-based polyurethane chemistries are expanding product demand as stakeholders pursue higher performance and lower embodied carbon targets. Water-borne technology already leads the United States construction adhesives & sealants market, and continued VOC (Volatile Organic Compound) caps under South Coast AQMD (Air Quality Management District) Rule 1168 keep shifting specifications away from solvent-borne systems. Rapid-cure reactive systems are gaining ground because they shorten installation cycles in panelized builds, while silicone and polyurethane chemistries remain indispensable for high-movement façades that must withstand seismic loading and UV exposure. Competitive positioning now hinges on research and development for bio-content, accelerated test approvals, and regional capacity expansions that avert supply bottlenecks in high-growth Sunbelt and Pacific Northwest corridors.
Key Report Takeaways
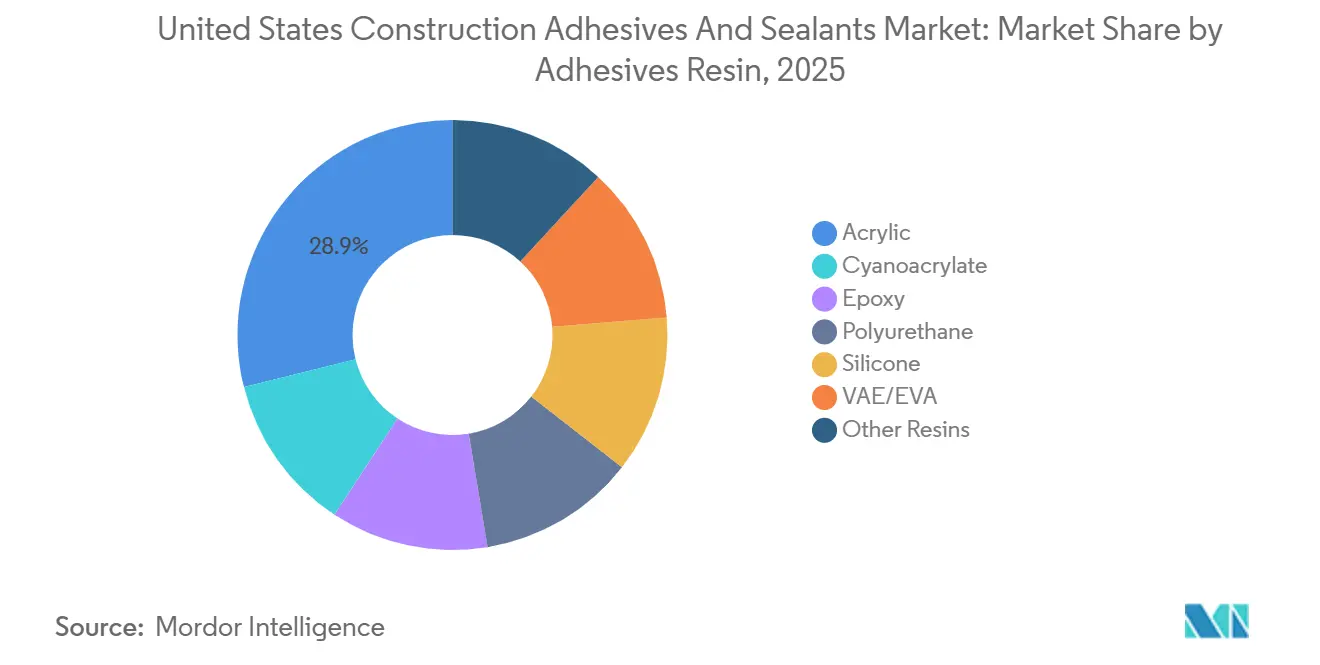
- By adhesive resin, acrylics commanded 28.89% of demand in 2025, while polyurethane grades are forecast to expand at a 6.24% CAGR during the forecast period (2026-2031).
- By adhesive technology, water-borne systems led with 35.12% of the United States Construction Adhesives and Sealants market share in 2025, whereas reactive systems are projected to pace the segment with a 6.31% CAGR during the forecast period (2026-2031).
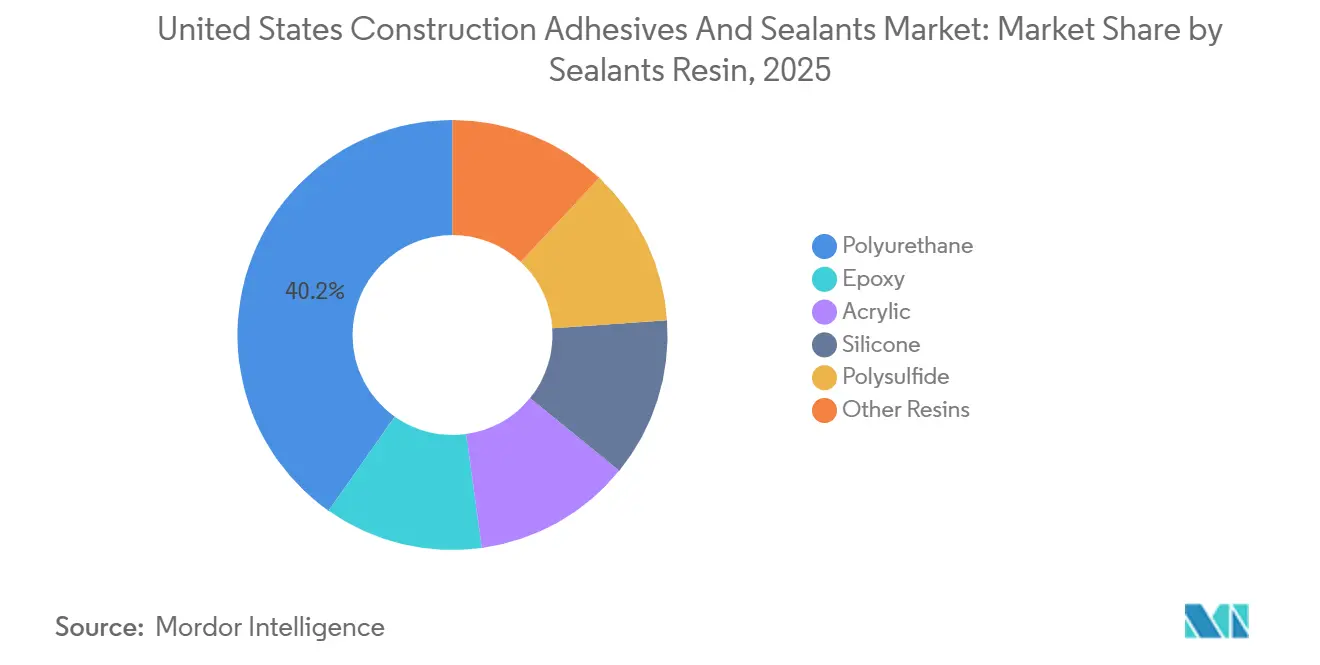
- By sealant resin, polyurethane held 40.22% share of the United States Construction Adhesives and Sealants market size in 2025; silicone grades exhibit the fastest growth at a 6.18% CAGR during the forecast period (2026-2031).
Note: Market size and forecast figures in this report are generated using Mordor Intelligence’s proprietary estimation framework, updated with the latest available data and insights as of January 2026.
United States Construction Adhesives And Sealants Market Trends and Insights
Drivers Impact Analysis*
| Driver | (~) % Impact on CAGR Forecast | Geographic Relevance | Impact Timeline |
|---|---|---|---|
| Tight energy-code adoption driving high-performance building envelopes | +1.4% | National, with early gains in California, Washington, Massachusetts | Medium term (2-4 years) |
| Rapid shift to off-site modular construction | +1.2% | National, concentrated in Northeast and West Coast metro areas | Medium term (2-4 years) |
| Green-label credit (LEED v4.1/IBU) compliance requirements | +0.9% | National, strongest in commercial office and institutional segments | Long term (≥ 4 years) |
| Emergence of bio-based polyurethane chemistries | +0.7% | National, with regulatory pull from California and Northeast states | Long term (≥ 4 years) |
| On-site 3D printing of concrete structures | +0.3% | Regional pilots in Texas, Arizona, California | Long term (≥ 4 years) |
| Source: Mordor Intelligence | |||


Tight Energy-Code Adoption Driving High-Performance Building Envelopes
The 2024 edition of the International Energy Conservation Code cut allowable air-leakage to 0.25 cfm/ft² at 75 Pa, a 38% tightening versus 2021; Washington, Massachusetts, and California codified those limits between July 2024 and January 2025[1]International Code Council, “2024 International Energy Conservation Code,” iccsafe.org. Low-modulus polyurethane and hybrid SMP formulations, therefore, replaced mechanical fasteners to avoid thermal bridging, especially in climate zones demanding R-value upgrades under ASHRAE 90.1-2022. Adhesives exceeding 25 pli peel strength and 150 psi shear are now baseline requirements, sidelining older acrylic mastics. Demand acceleration for high-elongation products translates directly into higher average selling prices that support incremental research and development.
Rapid Shift to Off-Site Modular Construction
Modular techniques captured 6.2% of the United States non-residential starts in 2025, up from 4.8% in 2020, as developers raced to cut schedules and labor risk[2]Modular Building Institute, “2025 Modular Construction Annual Report,” modular.org. Moisture-cure reactive hot-melts enable 80% bond strength within 90 minutes, keeping throughput near 12 wall cassettes per hour. H.B. Fuller’s Swift-Tak 1357 delivers this profile, letting factories eliminate overnight curing and reclaim 1,200 ft² of floor space. Bathroom-pod builders also migrate toward water-resistant polyurethane and epoxy systems that pass ASTM D1151 humidity aging.
Green-Label Credit Compliance (LEED v4.1/IBU)
LEED v4.1 grants two points when projects specify products with third-party EPDs, sparking a 22% leap in adhesive EPD registrations in 2025. Sika published 18 EPD families in 2024 and gained placement in three LEED Platinum towers on the West Coast. Henkel’s bio-based Technomelt Supra Cool 130, launched April 2025, couples 45% renewable carbon with USDA BioPreferred labeling, supporting mass-timber panel assembly narratives. As material disclosure thresholds move to 20% by cost under LEED, adhesive suppliers must quantify cradle-to-gate CO₂e for each SKU or risk exclusion.
Emergence of Bio-Based Polyurethane Chemistries
Bio-derived polyols supplied 8.3% of polyurethane adhesive formulations in 2025, doubling penetration since 2022. Cargill’s BiOH and Dow’s RENUVA platforms confirm mechanical parity with petroleum polyols while trimming carbon footprints by 40-45%. California’s draft 2027 MDI limits of 0.5 g/L will accelerate the switch to lysine-based diisocyanates now in pilot production at Covestro. Early movers can lock specifications before compliance deadlines and secure premium pricing.
Restraints Impact Analysis*
| Restraint | (~) % Impact on CAGR Forecast | Geographic Relevance | Impact Timeline |
|---|---|---|---|
| VOC-content caps under South Coast AQMD Rule 1168 | -0.6% | California, with spillover to Northeast OTC states | Short term (≤ 2 years) |
| Skilled-labor shortage delaying adhesive application | -0.8% | National, acute in Sunbelt metro areas | Medium term (2-4 years) |
| Fire-test re-certification costs for innovative chemistries | -0.4% | National, affecting specialty and hybrid formulations | Long term (≥ 4 years) |
| Source: Mordor Intelligence | |||
VOC-Content Caps Under South Coast AQMD Rule 1168
Rule 1168 drives universal sub-70 g/L VOC limits for most construction adhesives in the Los Angeles basin; OTC states adopted matching caps by 2025, covering 38% of demand. Reformulation costs of USD 120,000-180,000 per SKU deterred mid-tier suppliers, increasing the United States construction adhesives & sealants market concentration around multinationals. Longer tack-free times for water-borne acrylics extend schedules, creating pushback on fast-track jobs.
Skilled-Labor Shortage Delaying Adhesive Application
Adhesive-intensive trades lost 4.1% of headcount between January 2024 and December 2025, inflating installed system costs by 12-18%. Tremco’s one-step ExoAir 230 reduced labor hours by 40%, yet nationwide enrollment in the new 40-hour NCCER adhesive certificate remains below 2,000 students, far short of annual retirements.
*Our forecasts treat driver/restraint impacts as directional, not additive. The impact forecasts reflect baseline growth, mix effects, and variable interactions.
Segment Analysis
By Adhesives Resin: Acrylic Dominance Anchored in Tile and Panel Applications
In 2025, acrylic resins represented 28.89% of overall adhesive value, a level grounded in ceramic-tile mastics and drywall joint compounds where cost efficiency and clean-up ease are paramount. This share positions acrylics as the single largest component within the United States Construction Adhesives and Sealants market. The segment’s elasticity remains limited, yet Tile Council of North America specifications keep acrylic-latex modifiers mandatory in thin-set mortars. Polyurethane grades are advancing at a 6.24% CAGR during the forecast period (2026-2031), leveraging superior elongation for curtain-wall and dissimilar-substrate bonding. Epoxy adhesives preserve niche status in high-modulus anchoring and crack injection work.
Acrylic innovation points toward lower-VOC and faster-tack water emulsions, aligning with Rule 1168. VAE/EVA copolymers possess quick tack and hot-melt compatibility, a fit for laminated door skins moving at 200 lf/min. Silicone and cyanoacrylate resins occupy specialist corners, fire-stop flashing, and instant-bond repairs. Continued raw-material price swings for acrylate monomers could nudge specifiers toward polyurethane alternatives, yet installer familiarity provides a durable moat.


By Adhesives Technology: Water-Borne Systems Lead on VOC Compliance
Water-borne chemistries delivered 35.12% of 2025 sales, the largest slice of the United States Construction Adhesives and Sealants market, underscored by regulatory pressure in California and Ozone Transport Commission (OTC) regions. Reactive adhesives, though smaller today, are expected to deliver the steepest growth at 6.31% CAGR during the forecast period (2026-2031), fueled by modular throughput requirements that demand 80% bond in under 90 minutes. In comparison, solvent-borne holds a higher share where VOC oversight remains light, but its trajectory trends downward as more states align with Rule 1168 thresholds.
Hot-melt EVA and polyamide systems remain entrenched in edge-banding lines running above 150 parts per hour. UV-curing acrylics still register less than 3% but enable glass shops to slice cycle times from minutes to seconds, presenting a premium niche. Cold-weather freeze-thaw instability in water-borne adhesives prompts glycol co-solvent use, nudging VOC values against regulatory ceilings and spurring research into glycol-free stabilizers.
By Sealants Resin: Polyurethane Leads, Silicone Gains in Structural Glazing
Polyurethane sealants captured a 40.22% share in 2025, owing to about 25% movement capacity suited for expansion joints and perimeter seals. Silicone sealants, backed by structural-glazing growth, post a 6.18% CAGR during the forecast period (2026-2031) and could reach a higher share as glass façades grow more prevalent. Epoxies dominate decks and chemically exposed spaces.
Dow Corning 983’s ASTM-C1401 success has expanded silicone’s credibility for a 20-year service life in high-rise façades, chipping at polyurethane’s lead. Meanwhile, Tremco’s Dymonic 100 widens polyurethane reach into seismic-zone joints by meeting about 50% Class 50 criteria. Polysulfide and butyl variants continue tapering, though they retain moisture-barrier niches in insulating-glass edge seals.
Geography Analysis
California, Washington, and Massachusetts together generated a significant share of the United States Construction Adhesives and Sealants market size in 2025 after codifying 2024 IECC limits that favor adhesive-based air barriers. California’s Title 24 Part 6 revisions, coupled with pending 2027 MDI restrictions, position the state as the crucial proving ground for bio-based polyurethane. In parallel, Gulf Coast states present above-average sealant demand as hurricane-resistant glazing assemblies proliferate; Sika’s FM 4470-approved Sikaflex-221 targets this USD 180 million annual niche.
Sunbelt metros, from Phoenix to Atlanta, absorb the largest modular construction flows, leveraging dry climates and large plots for factory siting. These regions consume higher volumes of reactive hot-melt polyurethane adhesives because wall cassettes must sustain transport vibration across hundreds of highway miles. Conversely, Northeast urban cores retain legacy brick and stone façades that still specify solvent-borne mastics for masonry patching, though water-borne adoption is accelerating under OTC VOC harmonization.
Midwest industrial corridors, especially Ohio and Michigan, remain epoxy strongholds in chemical plants and automotive facilities needing high-modulus bonding and aggressive chemical resistance. Meanwhile, Pacific Northwest timber-rich markets such as Oregon and Washington drive bio-based adhesive uptake in mass-timber panel plants that rely on carbon-Counting tools like EC3 to win municipal incentives. Overall, demand hot-spots correlate with local code evolution, climatic stressors and industrial specialization, reinforcing regional product-mix nuances inside the United States Construction Adhesives and Sealants market.
Competitive Landscape
The United States Construction Adhesives and Sealants market is moderately consolidated. Pricing power remains balanced: larger players hedge resin volatility via global purchasing while locals exploit quick color-matching and field service. Overall, value migrates to suppliers that pre-qualify products under evolving ASTM and UL tests, stock region-specific VOC packages, and deliver application training that offsets the skilled-labor deficit permeating the United States Construction Adhesives and Sealants industry.
United States Construction Adhesives And Sealants Industry Leaders
3M
H.B. Fuller Company
Henkel AG & Co. KGaA
Sika AG
Dow
- *Disclaimer: Major Players sorted in no particular order

Recent Industry Developments
- October 2025: Bostik, Inc., a member of the Arkema Group of companies, introduced OB1 Multi-Surface Construction Sealant and Adhesive to the United States market. OB1 Multi-Surface Construction Sealant and Adhesive is a universal sealant and adhesive designed to simplify installations by replacing multiple products with one solution.
- October 2025: ATP Adhesives unveiled ATP North America, a new venture aimed at providing the United States manufacturers with solvent-free adhesive technologies. The company backed this initiative with a USD 70 million investment, setting up its inaugural solvent-free manufacturing facility in Columbia, South Carolina.


United States Construction Adhesives And Sealants Market Report Scope
Sealants, flexible and paste-like, fill gaps, joints, and cracks between surfaces, effectively blocking air, water, moisture, and dust. Widely utilized in aerospace, construction, automotive, and healthcare, sealants protect joints. Unlike adhesives, sealants focus on providing water resistance and sealing, rather than structural bonding.
The United States Construction Adhesives & Sealants market report is segmented by resin (acrylic, cyanoacrylate, epoxy, polyurethane, silicone, VAE/EVA, and other resins), by adhesives technology (hot-melt, reactive, solvent-borne, uv-cured, and water-borne), and by sealants resin (polyurethane, epoxy, acrylic, silicone, polysulfide, and other resins). The market size and forecasts are provided in terms of value (USD).
By Adhesives Resin
| Acrylic |
| Cyanoacrylate |
| Epoxy |
| Polyurethane |
| Silicone |
| VAE/EVA |
| Other Resins |
By Adhesives Technology
| Hot-Melt |
| Reactive |
| Solvent-Borne |
| UV-Cured |
| Water-Borne |
By Sealants Resin
| Polyurethane |
| Epoxy |
| Acrylic |
| Silicone |
| Polysulfide |
| Other Resins |
| By Adhesives Resin | Acrylic |
| Cyanoacrylate | |
| Epoxy | |
| Polyurethane | |
| Silicone | |
| VAE/EVA | |
| Other Resins | |
| By Adhesives Technology | Hot-Melt |
| Reactive | |
| Solvent-Borne | |
| UV-Cured | |
| Water-Borne | |
| By Sealants Resin | Polyurethane |
| Epoxy | |
| Acrylic | |
| Silicone | |
| Polysulfide | |
| Other Resins |


Market Definition
- End-user Industry - Residential construction, commercial construction, public buildings, industrial buildings and infrastructure projects are considered under the construction industry.
- Product - All adhesive and sealant products used in construction industry are considered in the market studied
- Resin - Under the scope of the study, resins like Polyurethane, Epoxy, Acrylic, Cyanoacrylate, VAE/EVA, and Silicone are considered
- Technology - For the purpose of this study, Water-borne, Solvent-borne, Reactive, Hot Melt, and Sealants technologies are taken into consideration.
| Keyword | Definition |
|---|---|
| Hot-melt Adhesive | Hot melt adhesives are generally 100% solid formulations, based on thermoplastic polymers. They are solid at room temperature and are activated upon heating above their softening point, at which stage they are liquid, and hence, can be processed. |
| Reactive Adhesive | A reactive adhesive is made up of monomers that react in the adhesive curing process and do not evaporate from the film during use. Instead, these volatile components become chemically incorporated into the adhesive. |
| Solvent-borne Adhesive | Solvent-borne adhesives are mixtures of solvents and thermoplastic, or slightly cross-linked polymers, such as polychloroprene, polyurethane, acrylic, silicone, and natural and synthetic rubbers (elastomers). |
| Water-borne Adhesive | Water-borne adhesives use water as a carrier or diluting medium to disperse a resin. They are set by allowing the water to evaporate or be absorbed by the substrate. These adhesives are compounded with water as a diluent, rather than a volatile organic solvent. |
| UV Cured Adhesive | UV curing adhesives induce curing and create a permanent bond without heating by using ultraviolet (UV) light or other radiation sources. An aggregation of monomers and oligomers is cured or polymerized by ultraviolet (UV) or visible light in a UV adhesive. Because UV is a radiating energy source, UV adhesives are often referred to as radiation curing or rad-cure adhesives. |
| Heat-resistant Adhesive | Heat-resistant Adhesives refer to those that do not break down under high temperatures. One aspect of a complicated system of circumstances is the adhesive's capacity to withstand disintegration brought on by high temperatures. As the temperature rises, adhesives may liquefy. They can withstand stresses resulting from differing coefficients of expansion and contraction, which might be an additional advantage. |
| Reshoring | Reshoring is the practice of moving commodity production and manufacturing back to the nation where the business was founded. Onshoring, inshoring, and back shoring are further terms used. Offshoring, the practice of producing items abroad to lower labor and manufacturing costs, is the opposite of this. |
| Oleochemicals | Oleochemicals are compounds produced from biological oils or fats. They resemble petrochemicals, which are substances made from petroleum. The oleochemical business is built on the hydrolysis of oils or fats. |
| Nonporous Materials | Nonporous materials are substances that do not permit the passage of liquid or air. Nonporous materials are those that are not porous, such as glass, plastic, metal, and varnished wood. Since no air can get through, less airflow is required to raise these materials, negating the requirement for high airflow. |
| EU-Vietnam Free Trade Agreement | A trade agreement and an investment protection agreement were concluded between the European Union and Vietnam on June 30, 2019. |
| VOC content | Compounds with limited solubility in water and high vapor pressure are known as Volatile Organic Compounds (VOCs). Many VOCs are human-made chemicals that are used and produced in the manufacture of paints, pharmaceuticals, and refrigerants. |
| Emulsion Polymerization | Emulsion polymerization is a method of producing polymers or connected groups of smaller chemical chains known as monomers, in a water solution. The method is often used to make water-based paints, adhesives, and varnishes, in which the water stays with the polymer and is marketed as a liquid product. |
| 2025 National Packaging Targets | In 2018, the Australian Environment Ministry set the following 2025 National Packaging Targets: 100% of the packaging must be reusable, recyclable, or compostable by 2025, 70% of plastic packaging must be recycled or composted by 2025, 50% of average recycled content must be included in packaging by 2025, and problematic and unnecessary single-use plastic packaging must be phased out by 2025. |
| Russian Government’s Import Substitution Policy | The Western sanctions suspended the distribution of several high-tech items to Russia, including those required by the raw material export sectors and the military-industrial complex. In response, the government launched an "import substitution" scheme, appointing a special commission to oversee its implementation in early 2015. |
| Paper Substrate | Paper substrates are paper sheets, reels, or boards with a base weight of up to 400 g/m2 that has not been converted, printed or otherwise altered. |
| Insulation Material | A material that inhibits or blocks heat, sound, or electrical transmission is known as Insulation Material. The variety of insulation materials includes thick fibers like fiberglass, rock and slag wool, cellulose, and natural fibers as well as stiff foam boards and sleek foils. |
| Thermal Shock | A temperature change known as thermal shock generates stress in a material. It commonly results in material breakdown and is especially prevalent in brittle materials like ceramics. When there is a quick temperature change, either from hot to cold or vice versa, this process occurs abruptly. It occurs more frequently in materials with poor heat conductivity and insufficient structural integrity. |


Research Methodology
Mordor Intelligence follows a four-step methodology in all our reports.
- Step-1: Identify Key Variables: The quantifiable key variables (industry and extraneous) pertaining to the specific product segment and country are selected from a group of relevant variables & factors based on desk research & literature review; along with primary expert inputs. These variables are further confirmed through regression modeling (wherever required).
- Step-2: Build a Market Model: In order to build a robust forecasting methodology, the variables and factors identified in Step-1 are tested against available historical market numbers. Through an iterative process, the variables required for market forecast are set and the model is built on the basis of these variables.
- Step-3: Validate and Finalize: In this important step, all market numbers, variables and analyst calls are validated through an extensive network of primary research experts from the market studied. The respondents are selected across levels and functions to generate a holistic picture of the market studied.
- Step-4: Research Outputs: Syndicated Reports, Custom Consulting Assignments, Databases & Subscription Platforms


