Market Overview
| Study Period | 2021 - 2031 |
|---|---|
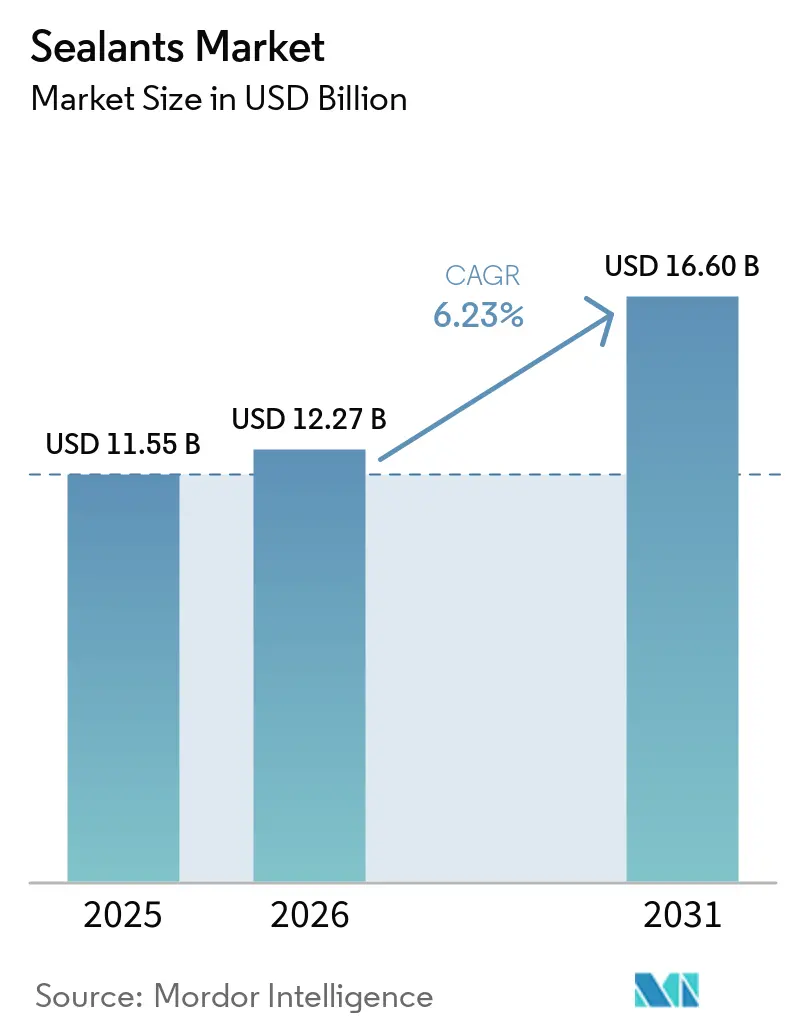
| Market Size (2026) | USD 12.27 Billion |
| Market Size (2031) | USD 16.60 Billion |
| Growth Rate (2026 - 2031) | 6.23% CAGR |
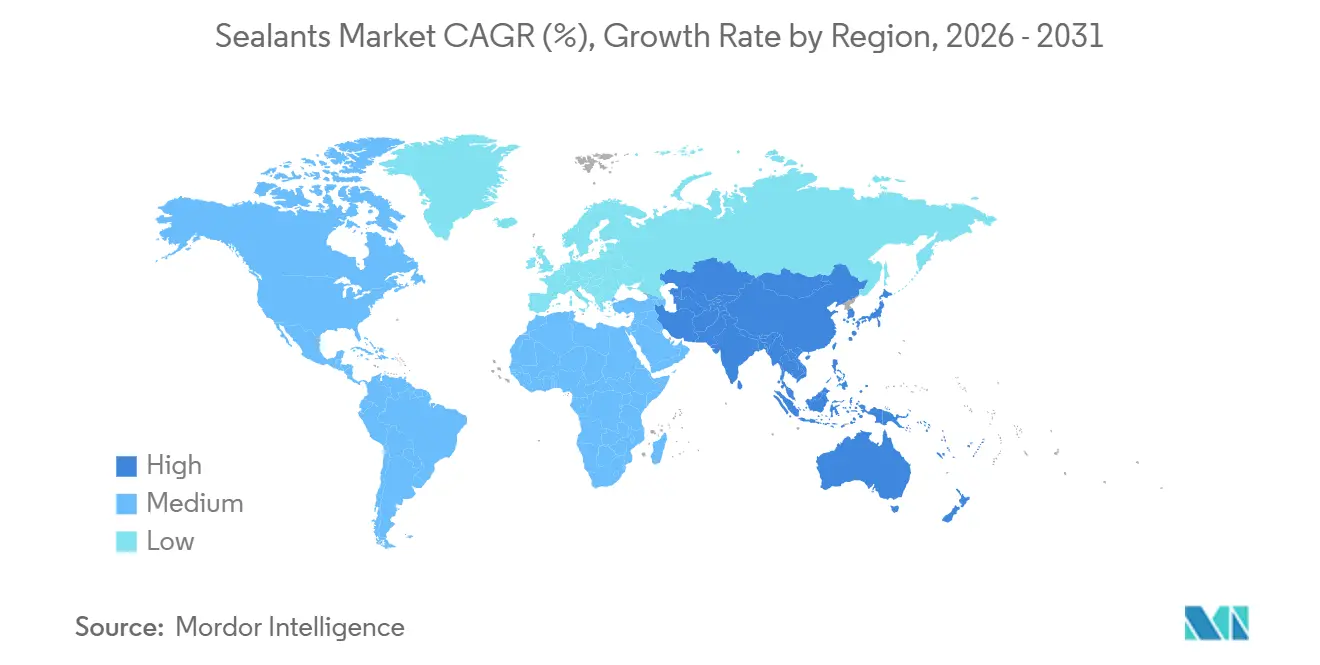
| Fastest Growing Market | Asia Pacific |
| Largest Market | Asia Pacific |
| Market Concentration | Medium |
Major Players *Disclaimer: Major Players sorted in no particular order Image © Mordor Intelligence. Reuse requires attribution under CC BY 4.0. | |
Sealants Market Analysis by Mordor Intelligence
The Sealants Market size was valued at USD 11.55 billion in 2025 and is estimated to grow from USD 12.27 billion in 2026 to reach USD 16.60 billion by 2031, at a CAGR of 6.23% during the forecast period (2026-2031). This expansion reflects growing demand for thermally stable formulations in electric-vehicle battery packs, ultra-low-permeability joints in net-zero buildings, and fuel-tank integrity in advanced aircraft, all under stricter VOC ceilings issued by regulators in the European Union, California, and China. Silicone chemistries retained the largest resin position in 2025, supported by service temperatures from −60 °C to +250 °C and superior ultraviolet resistance. Acrylic grades, however, are gaining share because faster tack-free times shorten production cycles and their water-based carriers align with VOC limits. On the application side, building and construction absorbed more than three-fifths of the 2025 volume as façade weatherproofing and insulated-glass-unit sealing proliferated. Healthcare end uses are accelerating on the back of room-temperature-vulcanizing silicone adoption in sterilizable medical devices. Competitive pressures are intensifying as tier-one producers acquire complementary portfolios and mid-tier formulators differentiate through joint-design consulting and applicator training.
Key Report Takeaways
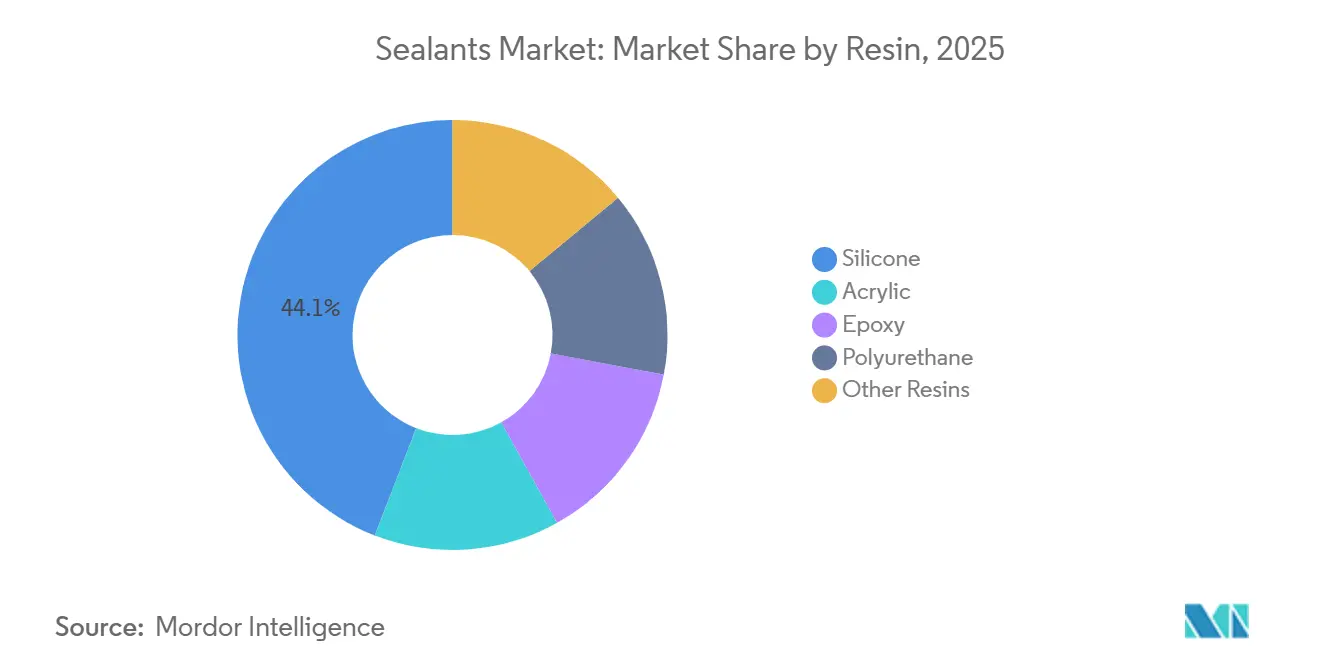
- By resin, silicones led with 44.11% of the sealants market share in 2025, while acrylics are forecast to record a 6.21% CAGR through 2031.
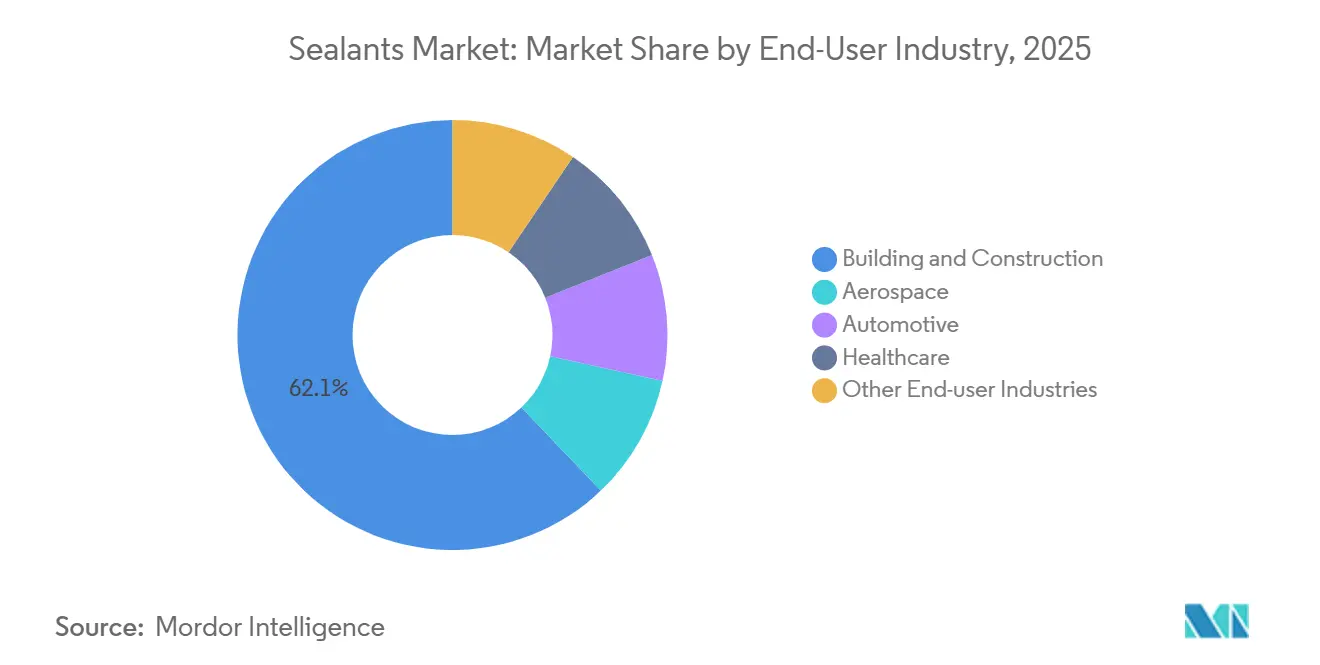
- By end-user industry, building and construction held 62.12% of the sealants market size in 2025, whereas healthcare is projected to expand at a 6.28% CAGR to 2031.
- By geography, Asia-Pacific captured 36.13% of global demand in 2025 and is advancing at a 7.32% CAGR through 2031.
Note: Market size and forecast figures in this report are generated using Mordor Intelligence’s proprietary estimation framework, updated with the latest available data and insights as of January 2026.
Global Sealants Market Trends and Insights
Drivers Impact Analysis*
| Drivers | (~) % Impact on CAGR Forecast | Geographic Relevance | Impact Timeline |
|---|---|---|---|
| Growth in global infrastructure spending | +1.8% | Asia-Pacific core, spillover to Middle East and South America | Medium term (2-4 years) |
| Lightweighting and multi-material bonding in electric vehicles | +1.5% | Global, concentrated in China, Europe, North America | Medium term (2-4 years) |
| Demand for high-performance weatherproofing in smart buildings | +1.2% | North America and Europe, expanding to Asia-Pacific tier-1 cities | Long term (≥4 years) |
| Rapid expansion of Asia-Pacific end-markets | +1.4% | Asia-Pacific (China, India, Southeast Asia) | Short term (≤2 years) |
| Adoption of automated or robotic dispensing lines | +0.9% | North America, Europe, Japan, South Korea | Medium term (2-4 years) |
| Source: Mordor Intelligence | |||


Growth in Global Infrastructure Spending
Governments and multilateral lenders committed to infrastructure programs in 2025, showing an increase over 2024. Bridge-deck expansion joints, tunnel gaskets, and pipeline seals all rely on polysulfide or polyurethane grades that tolerate ±50% movement without cohesive failure. India’s National Infrastructure Pipeline earmarks resources for highways, metro rail, and port modernization, each requiring robust jointing materials that comply with ASTM C920 Class 25.
China’s Belt and Road Initiative continues to fund rail corridors and deep-water terminals that specify two-component silicone systems capable of tack-free cure in high-humidity climates. Public-private partnerships are compressing bid schedules, so suppliers that secure early design approvals under ISO 11600 gain a strategic advantage. Overall, higher public capital outlays enlarge the sealants market by widening the installed base of joints that need initial sealing and periodic renewal.
Lightweighting and Multi-Material Bonding in Electric Vehicles
Battery-electric vehicle production increased significantly in 2025. Automakers are replacing steel closures with aluminum and carbon-fiber composites, creating galvanic-corrosion risks that mechanical fasteners cannot manage[1]International Energy Agency, “Global EV Outlook 2025,” iea.org. Structural sealants bridge dissimilar substrates, damp vibration, and supply dielectric insulation inside battery packs that cycle between −40 °C and +85 °C. Formulations such as SikaPower flexible epoxies incorporate flame-retardant fillers, extending thermal-runaway escape time beyond the 5-minute threshold set by UN ECE R100.03. As lithium-iron-phosphate chemistries have lower energy density, designers lengthen modules and increase linear seal length, boosting grams-per-vehicle consumption. The automotive drive toward lighter, quieter, and safer platforms, therefore, channels steady incremental revenue to the sealants market.
Demand for High-Performance Weatherproofing in Smart Buildings
In the European Union, California, and Singapore, net-zero-energy building codes are tightening their grip. They now limit air leakage to just 0.6 air changes per hour. This shift underscores the growing importance of perimeter weather seals and window-frame gaskets. To address the challenges of differential expansion in materials like glass, aluminum, and composite panels, manufacturers are turning to silicone and hybrid polymer grades. These grades, boasting a Shore A hardness between 20 and 35, are becoming the industry standard. Meanwhile, facility managers are benefiting from advanced technology. Hygrothermal sensors, now embedded in insulated-glass edges, provide timely alerts on moisture ingress. On the green-building front, labels like LEED v5 and WELL Standard v2 are making waves. They award credits to sealants that emit low VOC levels. This incentive is pushing formulators to pivot, moving away from traditional solvent carriers in favor of water or bio-alcohols. As a result of these regulatory and technological advancements, performance benchmarks are being raised, leading to a notable uptick in average selling prices within the sealants market.
Rapid Expansion of Asia-Pacific End-Markets
Asia-Pacific construction output is set to grow steadily until 2031, driven by residential towers in China, industrial parks in Vietnam, and infrastructure corridors in India. The region's light-vehicle output is witnessing significant contributions from electric and hybrid models. Local companies, such as Pidilite and ThreeBond, are expanding their silicone capacities and providing technical support in local languages, positioning themselves against multinational competitors. Thanks to ASEAN’s Mutual Recognition Arrangement, there's a reduction in toxicology-testing duplication. This development is enabling mid-tier suppliers to broaden their distribution networks in Malaysia, Thailand, and the Philippines. As a result, the sealants market in Asia-Pacific is enjoying a growth premium over its counterparts in more mature economies.
Restraints Impact Analysis*
| Restraints | (~) % Impact on CAGR Forecast | Geographic Relevance | Impact Timeline |
|---|---|---|---|
| VOC and REACH tightening driving reformulation costs | −0.7% | Europe, North America, China | Short term (≤2 years) |
| Silicone monomer price volatility | −0.6% | Global, acute in Asia-Pacific and Europe | Short term (≤2 years) |
| Skilled-labor gap for correct application | −0.5% | Global, most severe in North America and Europe | Medium term (2-4 years) |
| Source: Mordor Intelligence | |||
VOC and REACH Tightening Driving Reformulation Costs
REACH Annex XVII has set a VOC content limit for interior sealants, while California's Rule 1168 imposes an even stricter ceiling[2]ECHA, “REACH Regulation Annex XVII Restrictions,” echa.europa.eu . Reformulating products to meet these thresholds requires significant investment and time. This process includes accelerated weathering tests and third-party GREENGUARD evaluations. When aromatic solvents are replaced with acetone or tertiary butyl acetate, the open time decreases. As a result, applicators need to adjust their bead-laying speed to prevent voids. Additionally, water-based acrylics necessitate biocides and freeze-thaw stabilizers, complicating packaging and increasing raw material costs. Producers in the region, lacking polymer synthesis capabilities, are forced to pay a premium for pre-formulated low-VOC resins. Consequently, while compliant products are poised to capture a larger market share, the immediate profitability of the sealants market faces challenges.
Silicone Monomer Price Volatility
In early 2025, global supply tightened due to unplanned outages at two Chinese dimethyldichlorosilane units. This disruption led to a significant spike in spot prices, as reported in quarterly filings from a leading silicone producer. Following this trend, liquid silicone rubber prices also increased compared to the previous year's figures. Companies like Momentive and Shin-Etsu, with their vertical integration into siloxane intermediates and silicon-metal smelting, effectively hedge against such risks. In contrast, smaller formulators rely on cost-pass-through clauses in their annual contracts. However, many of their customers impose caps on these increases, referencing producer-price-index benchmarks, which in turn pressures profit margins. Additionally, price fluctuations pose challenges for inventory management. For mid-sized producers, even minor price changes can lead to significant working capital adjustments. As a result, this heightened volatility is stifling short-term planning and investment within the sealants market.
*Our forecasts treat driver/restraint impacts as directional, not additive. The impact forecasts reflect baseline growth, mix effects, and variable interactions.
Segment Analysis
By Resin: Silicones Anchor Durability, Acrylics Gain on Cure Speed
Silicone products controlled 44.11% of 2025 volume, confirming their role as the durability benchmark for high-movement joints, high-temperature gaskets, and ultraviolet-exposed façades. Acrylic chemistries, propelled by water-based carriers that meet 50 g/L VOC limits, are advancing at a 6.21% CAGR through 2031, eroding silicone share in porous-substrate applications. Polyurethanes occupy a mid-market niche, balancing abrasion resistance and paintability, which suits parking deck and plaza joints. Epoxies remain confined to chemical-processing and wastewater environments because brittleness restricts dynamic movement. Polysulfides, butyls, and latex acrylics round out the mix, with polysulfides holding a foothold in insulated-glass units thanks to moisture-vapor-transmission rates under 3 g/m²·day. Intensifying disclosure under ISO 11600 forces resin suppliers to publish modulus and elongation profiles across temperatures, enabling specifiers to match products to calculated joint movement. Silicone makers counter the acrylic advance with neutral-cure, primerless grades that adhere to polyethylene and polypropylene without plasma treatment, while hybrid silyl-terminated polyether systems blend UV endurance and paintability to open new niches. Collectively, resin innovation keeps the sealants market dynamic and favors producers able to scale specialty monomer supply.


By End-User Industry: Construction Dominates, Healthcare Accelerates
Building and construction consumed 62.12% of the 2025 volume as new high-rise façades and retrofit air-barrier upgrades required continuous joint lines. Healthcare end uses, though smaller, are climbing at a 6.28% CAGR, led by liquid silicone rubber that withstands 134 °C steam sterilization without additive leaching, a prerequisite under ISO 10993 biocompatibility. Automotive manufacturers deploy seam-sealing and battery-encapsulation systems that incorporate thermally conductive fillers like aluminum oxide to dissipate cell heat. Aerospace demand, governed by specifications such as MIL-PRF-81733, centers on polysulfide and epoxy sealants for fuel-tank and pressurized-cabin joints where failure jeopardizes safety. Marine, rail, and electronics segments collectively add diversity, each demanding specialized properties such as antifouling resistance or low-outgassing performance. The construction segment should remain dominant but will grow more slowly as China and Europe enter renovation phases, while healthcare enjoys demographic tailwinds that raise its share of the sealants market size.
Geography Analysis
Asia-Pacific accounted for 36.13% of global demand in 2025 and is on track for a 7.32% CAGR to 2031. China continues to headline consumption through residential tower construction, yet new rules from the Green Building Evaluation Standard cap sealant emissions at 0.05 mg/m³·h, accelerating the switch from solvent to water-based systems. India’s automotive output hit record vehicles in 2025, with electric two- and three-wheelers comprising a significant portion of the mix, creating local demand for battery-pack sealants serviced by joint ventures between Pidilite and Japanese silicone suppliers. Southeast Asian nations such as Vietnam and Indonesia are attracting electronics and vehicle assembly as supply chains diversify, lifting call-offs for clean-room and thermally conductive grades. Japan and South Korea, relatively mature markets, still see growth in semiconductor and fuel-cell sealing that depends on ultra-pure silicones.
Asia-Pacific leads in growth, while North America and Europe, together accounting for a significant portion of the 2025 volume, lag. The United States, buoyed by the Infrastructure Investment and Jobs Act, is witnessing a steady demand surge. This act funds bridge repairs and transit upgrades, specifically calling for polyurethane and polysulfide joint systems rated for ±50% movement. Meanwhile, Europe’s Renovation Wave, aiming for energy upgrades on millions of buildings by 2030, is driving up demand for low-modulus silicone perimeter seals that enhance airtightness. Additionally, REACH Annex XVII is compelling local reformulations, thereby raising entry barriers and bolstering incumbents with their research and development scale.
South America and the Middle East-Africa account for the remaining market share. In Saudi Arabia, the Public Investment Fund has allocated significant resources for NEOM and other mega-projects. These projects mandate low-modulus polyurethane façade joints, designed to withstand desert temperature fluctuations. Over in Brazil, the offshore build-out is pushing the need for polysulfide and epoxy grades, specifically those resistant to seawater immersion. South Africa, on the other hand, is driving demand for UV-stable silicones in photovoltaic module sealing, thanks to its renewed focus on renewable energy. While these regions may be smaller in absolute terms, they present growth opportunities for seasoned formulators. Those willing to navigate the challenges of extreme climates and stringent technical specifications stand to significantly boost their stake in the sealants market.

Competitive Landscape
The global sealants market is moderately consolidated. Regional challengers in India and Southeast Asia gain share by bundling product supply with joint-design consulting and field-applicator training, lowering total installed cost for contractors. Material science startups are commercializing bio-based resins derived from castor oil or lignin that command premiums in green-building projects, yet remain low. Strategic themes revolve around vertical integration into silicone monomers to shield margins from price swings, geographic bolt-ons that enlarge distribution density, and adjacent moves into coatings or adhesives that share sales channels. Automotive OEMs are achieving metrics previously deemed unattainable with manual methods, all thanks to the implementation of closed-loop flow control in their automated dispensing processes. Smaller formulators lacking polymer synthesis scale partner with raw-material majors such as BASF and Arkema to co-develop low-VOC systems, halving development time but conceding several hundred basis points in gross margin. Collectively, these moves keep competition lively even as regulatory complexity and capital intensity raise barriers to entry for new participants in the sealants market.
Sealants Industry Leaders
Henkel AG & Co. KGaA
Sika AG
3M
Dow
H.B. Fuller Company
- *Disclaimer: Major Players sorted in no particular order

Recent Industry Developments
- May 2025: H.B. Fuller Company inaugurated a 15,000 m² manufacturing facility in the Ras Al Khaimah Economic Zone (RAKEZ), UAE. The facility is designed to produce high-performance adhesives and sealants for the construction industry.
- January 2025: Saint-Gobain completed a USD 1.025 billion acquisition of Fosroc, expanding its construction-chemicals and sealant portfolio in India.


Global Sealants Market Report Scope
Sealants, flexible materials, fill gaps and joints. They form a barrier that blocks air, water, dust, and sound. This ensures building integrity, energy efficiency, and waterproofing. By preventing infiltration, sealants maintain airtightness between surfaces like windows, walls, and concrete. The sealants market is segmented based on the resins, end-user industry, and geography. By resin, the market is segmented into acrylic, epoxy, polyurethane, silicone, and other resins. By end-user industry, the market is segmented into aerospace, automotive, building and construction, healthcare, and other end-user industries. The report also covers the market size and forecasts in 22 countries across major regions. For each segment, market sizing and forecasts have been done on the basis of revenue (USD).
By Resin
| Acrylic |
| Epoxy |
| Polyurethane |
| Silicone |
| Other Resins |
By End-User Industry
| Aerospace |
| Automotive |
| Building and Construction |
| Healthcare |
| Other End-user Industries |
By Geography
| Asia-Pacific | China |
| India | |
| Japan | |
| South Korea | |
| Malaysia | |
| Thailand | |
| Indonesia | |
| Singapore | |
| Australia | |
| Rest of Asia-Pacific | |
| North America | United States |
| Canada | |
| Mexico | |
| Europe | Germany |
| United Kingdom | |
| France | |
| Italy | |
| Spain | |
| NORDIC Countries | |
| Russia | |
| Rest of Europe | |
| South America | Brazil |
| Argentina | |
| Rest of South America | |
| Middle-East and Africa | Saudi Arabia |
| South Africa | |
| Rest of Middle-East and Africa |
| By Resin | Acrylic | |
| Epoxy | ||
| Polyurethane | ||
| Silicone | ||
| Other Resins | ||
| By End-User Industry | Aerospace | |
| Automotive | ||
| Building and Construction | ||
| Healthcare | ||
| Other End-user Industries | ||
| By Geography | Asia-Pacific | China |
| India | ||
| Japan | ||
| South Korea | ||
| Malaysia | ||
| Thailand | ||
| Indonesia | ||
| Singapore | ||
| Australia | ||
| Rest of Asia-Pacific | ||
| North America | United States | |
| Canada | ||
| Mexico | ||
| Europe | Germany | |
| United Kingdom | ||
| France | ||
| Italy | ||
| Spain | ||
| NORDIC Countries | ||
| Russia | ||
| Rest of Europe | ||
| South America | Brazil | |
| Argentina | ||
| Rest of South America | ||
| Middle-East and Africa | Saudi Arabia | |
| South Africa | ||
| Rest of Middle-East and Africa | ||


Market Definition
- End-user Industry - Building & Construction, Automotive, Aerospace, Healthcare, and Others are the end-user industries considered under the sealants market.
- Product - All sealant products are considered in the market studied
- Resin - Under the scope of the study, resins like Polyurethane, Epoxy, Acrylic, Silicone, and Others are considered
- Technology - For the purpose of this study, One component and Two component sealant technologies are taken into consideration.
| Keyword | Definition |
|---|---|
| Hot-melt Adhesive | Hot melt adhesives are generally 100% solid formulations, based on thermoplastic polymers. They are solid at room temperature and are activated upon heating above their softening point, at which stage they are liquid, and hence, can be processed. |
| Reactive Adhesive | A reactive adhesive is made up of monomers that react in the adhesive curing process and do not evaporate from the film during use. Instead, these volatile components become chemically incorporated into the adhesive. |
| Solvent-borne Adhesive | Solvent-borne adhesives are mixtures of solvents and thermoplastic, or slightly cross-linked polymers, such as polychloroprene, polyurethane, acrylic, silicone, and natural and synthetic rubbers (elastomers). |
| Water-borne Adhesive | Water-borne adhesives use water as a carrier or diluting medium to disperse a resin. They are set by allowing the water to evaporate or be absorbed by the substrate. These adhesives are compounded with water as a diluent, rather than a volatile organic solvent. |
| UV Cured Adhesive | UV curing adhesives induce curing and create a permanent bond without heating by using ultraviolet (UV) light or other radiation sources. An aggregation of monomers and oligomers is cured or polymerized by ultraviolet (UV) or visible light in a UV adhesive. Because UV is a radiating energy source, UV adhesives are often referred to as radiation curing or rad-cure adhesives. |
| Heat-resistant Adhesive | Heat-resistant Adhesives refer to those that do not break down under high temperatures. One aspect of a complicated system of circumstances is the adhesive's capacity to withstand disintegration brought on by high temperatures. As the temperature rises, adhesives may liquefy. They can withstand stresses resulting from differing coefficients of expansion and contraction, which might be an additional advantage. |
| Reshoring | Reshoring is the practice of moving commodity production and manufacturing back to the nation where the business was founded. Onshoring, inshoring, and back shoring are further terms used. Offshoring, the practice of producing items abroad to lower labor and manufacturing costs, is the opposite of this. |
| Oleochemicals | Oleochemicals are compounds produced from biological oils or fats. They resemble petrochemicals, which are substances made from petroleum. The oleochemical business is built on the hydrolysis of oils or fats. |
| Nonporous Materials | Nonporous materials are substances that do not permit the passage of liquid or air. Nonporous materials are those that are not porous, such as glass, plastic, metal, and varnished wood. Since no air can get through, less airflow is required to raise these materials, negating the requirement for high airflow. |
| EU-Vietnam Free Trade Agreement | A trade agreement and an investment protection agreement were concluded between the European Union and Vietnam on June 30, 2019. |
| VOC content | Compounds with limited solubility in water and high vapor pressure are known as Volatile Organic Compounds (VOCs). Many VOCs are human-made chemicals that are used and produced in the manufacture of paints, pharmaceuticals, and refrigerants. |
| Emulsion Polymerization | Emulsion polymerization is a method of producing polymers or connected groups of smaller chemical chains known as monomers, in a water solution. The method is often used to make water-based paints, adhesives, and varnishes, in which the water stays with the polymer and is marketed as a liquid product. |
| 2025 National Packaging Targets | In 2018, the Australian Environment Ministry set the following 2025 National Packaging Targets: 100% of the packaging must be reusable, recyclable, or compostable by 2025, 70% of plastic packaging must be recycled or composted by 2025, 50% of average recycled content must be included in packaging by 2025, and problematic and unnecessary single-use plastic packaging must be phased out by 2025. |
| Russian Government’s Import Substitution Policy | The Western sanctions suspended the distribution of several high-tech items to Russia, including those required by the raw material export sectors and the military-industrial complex. In response, the government launched an "import substitution" scheme, appointing a special commission to oversee its implementation in early 2015. |
| Paper Substrate | Paper substrates are paper sheets, reels, or boards with a base weight of up to 400 g/m2 that has not been converted, printed or otherwise altered. |
| Insulation Material | A material that inhibits or blocks heat, sound, or electrical transmission is known as Insulation Material. The variety of insulation materials includes thick fibers like fiberglass, rock and slag wool, cellulose, and natural fibers as well as stiff foam boards and sleek foils. |
| Thermal Shock | A temperature change known as thermal shock generates stress in a material. It commonly results in material breakdown and is especially prevalent in brittle materials like ceramics. When there is a quick temperature change, either from hot to cold or vice versa, this process occurs abruptly. It occurs more frequently in materials with poor heat conductivity and insufficient structural integrity. |


Research Methodology
Mordor Intelligence follows a four-step methodology in all our reports.
- Step-1: Identify Key Variables: The quantifiable key variables (industry and extraneous) pertaining to the specific product segment and country are selected from a group of relevant variables & factors based on desk research & literature review; along with primary expert inputs. These variables are further confirmed through regression modeling (wherever required).
- Step-2: Build a Market Model: In order to build a robust forecasting methodology, the variables and factors identified in Step-1 are tested against available historical market numbers. Through an iterative process, the variables required for market forecast are set and the model is built on the basis of these variables.
- Step-3: Validate and Finalize: In this important step, all market numbers, variables and analyst calls are validated through an extensive network of primary research experts from the market studied. The respondents are selected across levels and functions to generate a holistic picture of the market studied.
- Step-4: Research Outputs: Syndicated Reports, Custom Consulting Assignments, Databases & Subscription Platforms


