Market Overview
| Study Period | 2021 - 2031 |
|---|---|
| Forecast Data Period | 2026 - 2031 |
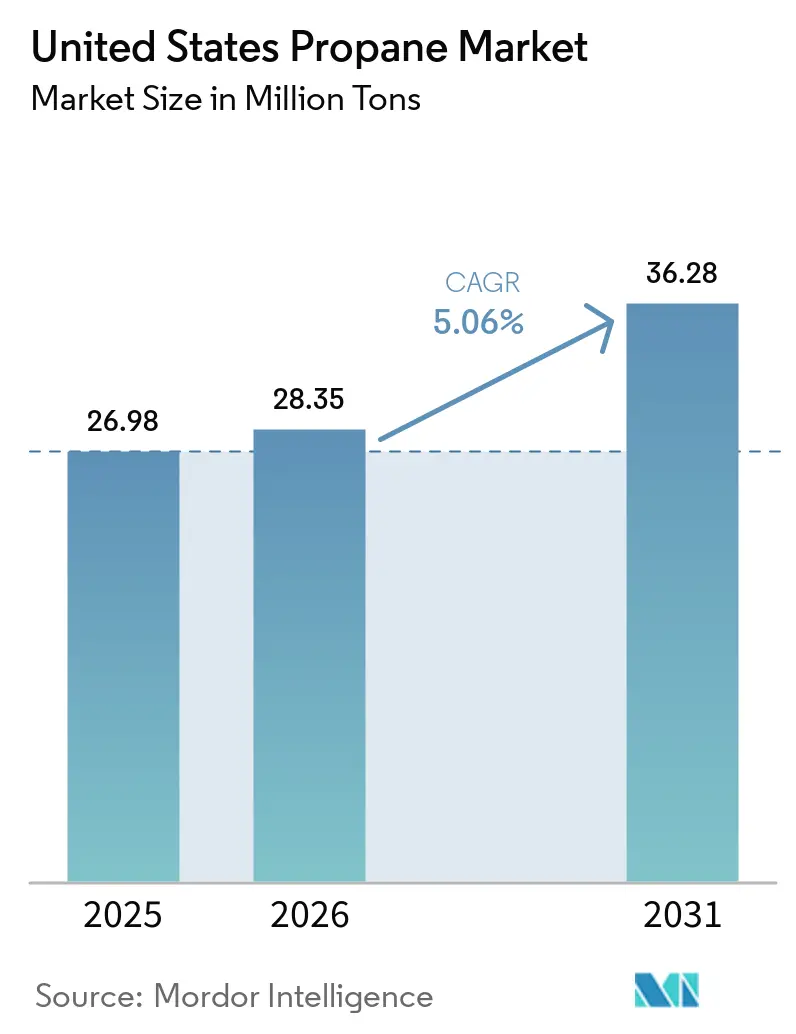
| Base Year Market Size (2025) | 26.98 Million tons |
| Market Volume (2026) | 28.35 Million tons |
| Market Volume (2031) | 36.28 Million tons |
| Growth Rate (2026 - 2031) | 5.06% CAGR |
| Market Concentration | Low |
Major Players *Disclaimer: Major Players sorted in no particular order Image © Mordor Intelligence. Reuse requires attribution under CC BY 4.0. | |
United States Propane Market Analysis by Mordor Intelligence
The United States Propane Market size is projected to expand from 26.98 million tons in 2025 and 28.35 million tons in 2026 to 36.28 million tons by 2031, registering a CAGR of 5.06% between 2026 to 2031. Fleet conversions are gaining momentum, driven by expanding propane dehydrogenation (PDH) capacities and robust standby-power deployments. These developments are shifting volumes away from a traditionally weather-dependent residential base and toward transportation and petrochemical applications. By 2025, natural-gas processing accounted for the majority of the total volume. However, renewable propane has been making significant progress. This growth is largely attributed to California's Low Carbon Fuel Standard (LCFS) credits, which have transformed the economics of sourcing. The demand for motor fuel has been rising, driven by conversions in school buses and last-mile deliveries. These transitions are resulting in notable savings in fuel costs compared to diesel, all while adhering to stricter NOx emissions limits. Investments in PDH facilities along the Gulf Coast have created a structural pull for feedstock, providing insulation from seasonal heating fluctuations. On another front, IoT-enabled "Propane-as-a-Service" models are revolutionizing the distribution landscape. By reducing distributor truck rolls and boosting customer retention, these models are empowering large retailers to maintain their foothold in an otherwise fragmented market.
Key Report Takeaways
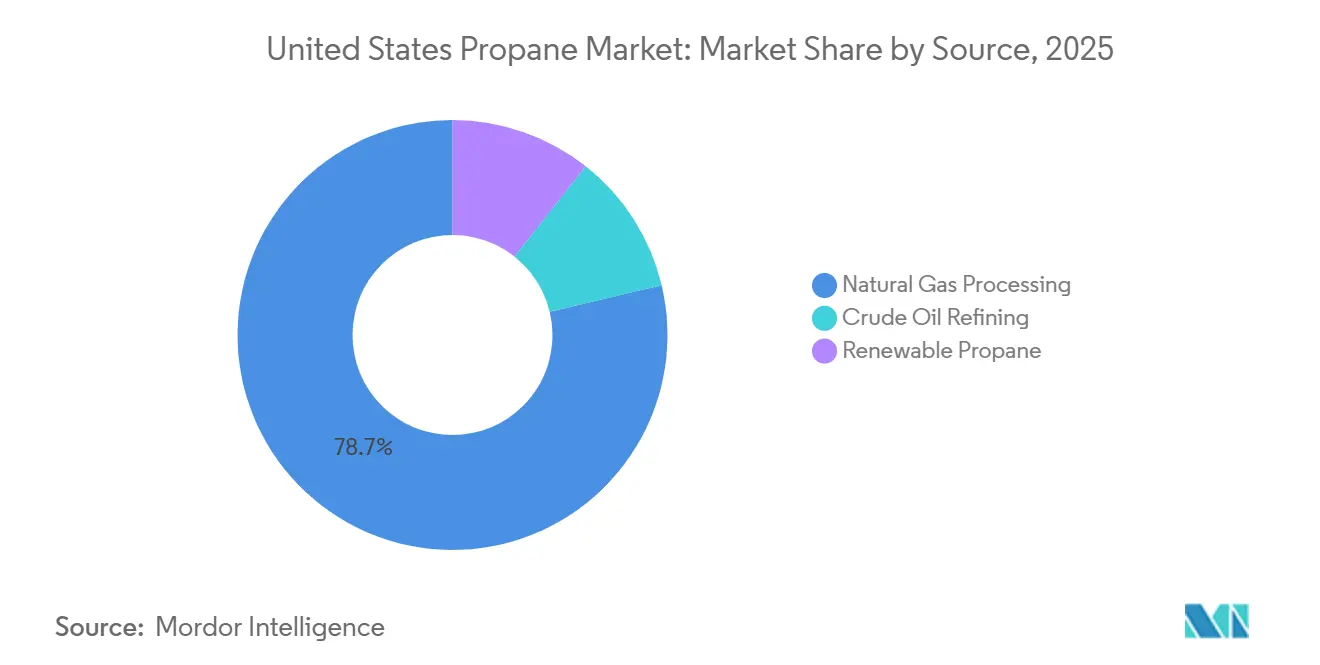
- By source, natural-gas processing led with 78.72% of the United States propane market share in 2025, while renewable propane is forecast to expand at a 9.95% CAGR in the forecast (2026-2031).
- By application, space and water heating accounted for 55.13% of the United States propane market size in 2025, whereas motor-fuel use is advancing at a 5.38% CAGR in the forecast (2026-2031).
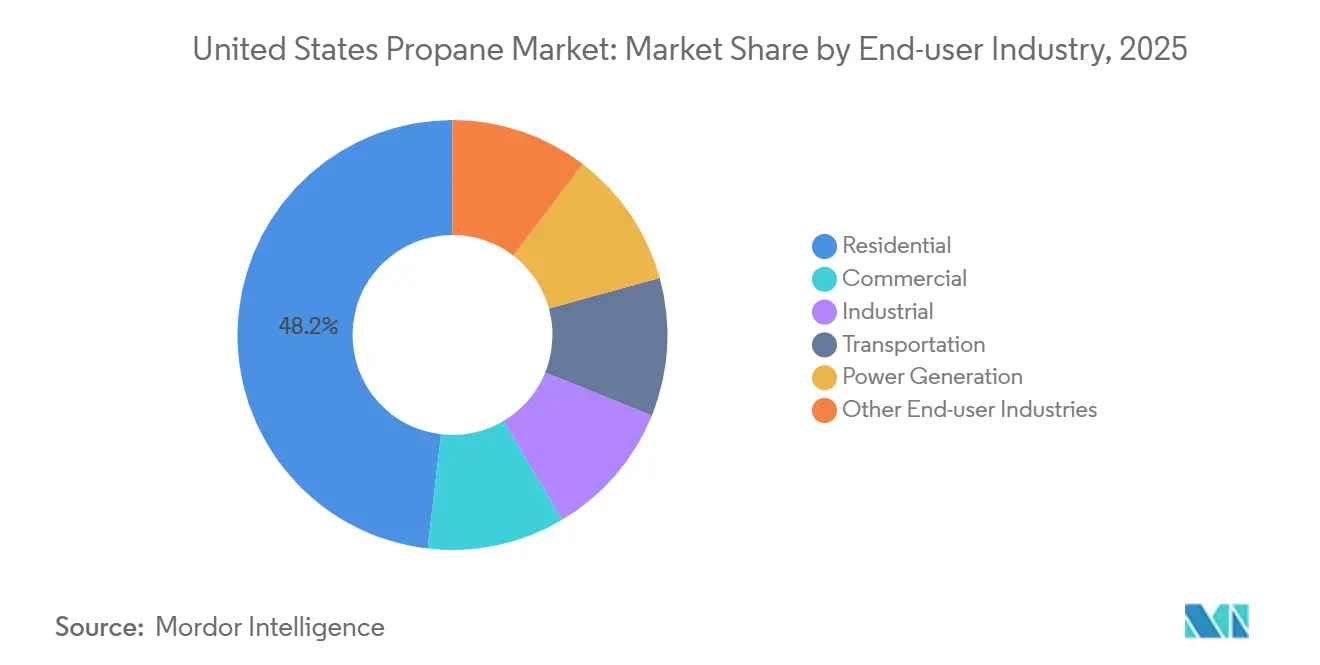
- By end-user industry, the residential segment held 48.16% of the United States propane market share in 2025; transportation is the fastest-growing end user, rising at a 5.33% CAGR in the forecast (2026-2031).
Note: Market size and forecast figures in this report are generated using Mordor Intelligence’s proprietary estimation framework, updated with the latest available data and insights as of 2026.
United States Propane Market Trends and Insights
Drivers Impact Analysis*
| Drivers | (~) % Impact on CAGR Forecast | Geographic Relevance | Impact Timeline |
|---|---|---|---|
| Autogas fleet conversions (school buses, delivery, municipal vehicles) | +1.2% | National, concentrated in Midwest and Southeast school districts | Medium term (2-4 years) |
| Petrochemical PDH capacity additions | +1.5% | Gulf Coast (PADD 3), spillover to PADD 2 Conway hub | Long term (≥ 4 years) |
| Stand-by generator installations for grid resiliency | +0.8% | National, early gains in Texas, California, Northeast | Medium term (2-4 years) |
| Propane-as-a-Service subscription models (IoT tank monitoring) | +0.5% | National, faster adoption in competitive urban markets | Short term (≤ 2 years) |
| Off-grid microgrids for rural broadband towers | +0.3% | Rural areas, Appalachia, Great Plains, Mountain West | Long term (≥ 4 years) |
| Source: Mordor Intelligence | |||
Autogas Fleet Conversions Accelerate as Diesel Rules Tighten
School districts are utilizing Clean School Bus Program grants to replace diesel units[1]U.S. Environmental Protection Agency, “Clean School Bus Program,” epa.gov. By securing propane at a cost lower than diesel, they achieve paybacks in just a few years. Propane direct-injection engines, with their impressive horsepower, not only replicate diesel torque but also significantly reduce NOx emissions. Blue Bird’s 7.3-liter platform and Cummins’ B6.7 Propane are advancing this technology into Class 6-7 delivery fleets, targeting a market of hundreds of thousands of vehicles. Fleet operators are experiencing substantial fuel savings, and telematics confirm steady performance with annual duty cycles achieving impressive mileage. As more metropolitan areas adopt low-emission zones, the lower capital requirement of propane - compared to battery-electric systems - is accelerating conversions, a trend projected to persist during the forecast period of 2026–2031
Petrochemical PDH Capacity Additions Lock In Feedstock Demand
Enterprise Products Partners’ PDH 2, which processes a substantial daily volume of propane, produces polymer-grade propylene. By 2028, LyondellBasell’s Channelview expansion will add to this capacity. With PDH units now commanding a significant portion of petrochemical propane consumption, their demand has become decoupled from refinery operating rates. Meanwhile, newer fluid catalytic dehydrogenation (FCDh) designs, which come with lower capital costs, are driving capacity expansions, despite hurdles in ESG financing. Looking ahead, robust petrochemical demand during the forecast period of 2026–2031 is expected to bolster the United States propane market.
Stand-by Generator Installations Rise with Grid-Reliability Investments
By 2030, the Department of Energy projects an additional peak capacity of 100 GW, with data centers accounting for half of that growth[2]U.S. Department of Energy, “Grid Resiliency and Data Center Power Demand,” energy.gov. In urban areas with stringent particulate regulations, propane generators - favored for their extended run times and simpler permitting processes - outperform diesel counterparts. Generac's units, designed for hyperscale facilities, are gaining significant traction. Additionally, combined-heat-and-power (CHP) packages, known for their high efficiencies, are capitalizing on federal incentives for installations exceeding a specific capacity. Although commercial propane usage declined in 2024 due to mild weather, the increased adoption of generators mitigated this decline, indicating a new growth trajectory for the U.S. propane market during the forecast period of 2026–2031.
Propane-as-a-Service Subscription Models Boost Margins
Early adopters of IoT sensors have significantly reduced emergency delivery times and increased customer retention. Platforms that trigger refills at specific tank capacities are mitigating seasonal fluctuations, leading to improved asset turnover. Distributors are now offering bundled services - equipment leases, maintenance, and supply - at a flat monthly rate, making them more accessible for rural households. Highlighting the competitive advantage of these engagement tools, a notable volume growth during the forecast period of 2026–2031 is directly linked to their implementation.
Restraints Impact Analysis*
| Restraints | (~) % Impact on CAGR Forecast | Geographic Relevance | Impact Timeline |
|---|---|---|---|
| Price volatility tied to NGL and crude markets | -0.9% | National, acute in PADD 1 import-dependent Northeast | Short term (≤ 2 years) |
| Rail/pipeline bottlenecks in key PADDs | -0.6% | PADD 1 (Northeast), PADD 2 (Midwest Conway hub) | Medium term (2-4 years) |
| ESG-driven divestment limiting upstream capex | -0.4% | National, concentrated in Permian Basin and Gulf Coast | Long term (≥ 4 years) |
| Source: Mordor Intelligence | |||
Price Volatility Compresses Distributor Margins
In 2024, warm weather and record NGL output caused a significant drop in Mont Belvieu spot prices, posing challenges for holders of fixed-price contracts. Throughout the year, exports surged, with barrels being redirected offshore due to attractive premiums in Asia. The basis risk between the Gulf and regional hubs often resulted in imperfect hedges. As a result, Suburban Propane experienced a decline in its fiscal-year gross margin per gallon, even with increased volumes.
Rail and Pipeline Bottlenecks Elevate Logistics Costs
In the winter of 2024-25, distributors in the Northeast relied predominantly on waterborne imports for their sourcing needs. However, a shortage of railcars resulted in heightened freight surcharges. At Conway, demand exceeded the available pipeline capacity, which required the use of rail transport and further escalated transportation costs. Concurrently, Gulf Coast exporters, who frequently prioritized overseas shipments, unintentionally created an artificial scarcity upriver during colder weather spells.
*Our forecasts treat driver/restraint impacts as directional, not additive. The impact forecasts reflect baseline growth, mix effects, and variable interactions.
Segment Analysis
By Source: Natural-Gas Processing Dominates, Renewable Propane Scales Fast
In 2025, natural-gas processing dominated the supply landscape, commanding a substantial 78.72% share. This was largely driven by fractionation activities at Mont Belvieu and robust outputs from the Permian's associated gas. Such processing dynamics fortify the U.S. propane market, even as contributions from refinery coproducts diminish. Although renewable propane currently holds a modest slice of the supply pie, it is on an impressive growth trajectory, boasting a 9.95% CAGR during the forecast period of 2026–2031. This surge is largely attributed to LCFS credits, carving out a lucrative niche that has piqued the interest of early adopters in the California-Oregon region. In this evolving U.S. propane landscape, traditional NGL extraction aligns with commodity demands, while pioneering low-carbon initiatives draw in credit-centric buyers.
Mergers and acquisitions underscore the escalating value of infrastructure: ONEOK's takeover of Magellan unified two powerhouses with substantial fractionation capabilities. In a bid to bolster export flexibility, Enterprise is methodically expanding its storage caverns. Even amidst ESG scrutiny, producers maintain an optimistic outlook on processing projects, buoyed by consistent demand from PDH and export markets. Renewable trailblazers, Neste and Oberon, are establishing compact facilities. By harnessing existing renewable-diesel or DME trains, they are exemplifying a strategic, modular approach to scaling low-carbon supplies.


By Application: Heating Still Leads, Motor Fuel Gains Traction
In 2025, space and water heating held a dominant 55.13% share of the market. However, as heat pump sales began to outpace gas-furnace shipments, a gradual shift became apparent. A polar vortex in January 2025 highlighted the market's sensitivity to weather, driving up consumption. While the U.S. propane market's footprint in motor-fuel applications is still modest, it is on a rapid ascent, expanding at a 5.38% compound annual growth rate (CAGR) during the forecast period of 2026–2031. The United States school bus industry is shifting to propane engines for lower costs and improved environmental compliance. This growth is largely fueled by the rising adoption of autogas engines in school, parcel, and refuse fleets.
A large portion of propane's use in the petrochemical sector is as a chemical feedstock. The demand for this feedstock has been bolstered by upcoming propane dehydrogenation (PDH) start-ups, offering a buffer against any potential decline in residential propane use. With the surge in artificial intelligence (AI) workloads, there has been a marked increase in power-generation demand, especially for standby sets in data centers. Additionally, cooking and specialized industrial processes further amplify this demand, acting as a safeguard against the rising trend of electrification in primary heating applications.
By End-User Industry: Residential Dominates, Transportation Accelerates
In 2025, residential use, accounting for 48.16% of end-user volume, faces challenges from state electrification goals and rebates under the Inflation Reduction Act. However, limitations in cold-climate performance and off-grid realities ensure propane's continued relevance in U.S. homes. The transportation sector, though currently a minor player, is experiencing a robust 5.33% compound annual growth rate (CAGR) in the forecast period (2026-2031). Operators are seizing opportunities presented by low energy costs and a streamlined fueling infrastructure. Consequently, the U.S. propane industry's growth trajectory is increasingly leaning toward transportation over heating.
In 2026, commercial buildings were major energy consumers. Milder winters tempered this consumption, but building-code mandates for onsite backup power mitigated the impact. Industrial users are turning to propane forklifts for their quick refueling capabilities and zero indoor emissions. Agriculture remains a steadfast seasonal buyer, particularly for grain drying. Together, these segments not only spread risk but also enhance the foundational throughput of the U.S. propane market.
Geography Analysis
The Gulf Coast (PADD 3), as the nation's supply engine, produces a significant volume of fractionated products. When Asian spot spreads widen, PADD 3 exports a substantial portion of the national output. The Midwest (PADD 2) Conway, heavily reliant on PADD 3's inbound flows, grapples with pipeline saturation. This saturation forces a diversion of additional volumes to rail, inflating delivered costs during peak demand. The Northeast (PADD 1) commands the highest prices, predominantly receiving its supply via water. Furthermore, winter rail-car shortages exacerbate spot premiums.
California, along with the broader West Coast (PADD 5), boosts imports. However, they lead in renewable-propane adoption, incurring premiums to leverage LCFS credits. Texas emerges as a powerhouse, driven by PDH, export terminals, and a dealer network facilitating fleet conversions. The Southeast pioneers in converting school buses, while the Mountain West utilizes propane-solar microgrids to power rural broadband towers.
Regional growth disparities in the U.S. propane market stem from three pivotal factors: heating degree days, infrastructure hurdles, and policy incentives, all influencing localized demand trajectories.
Competitive Landscape
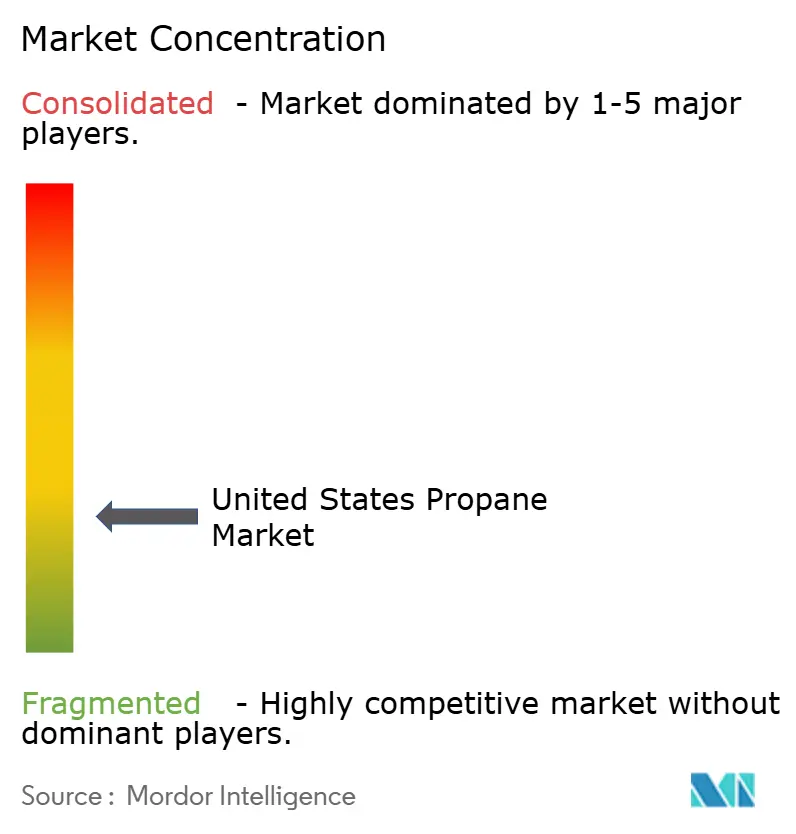
The United States Propane Market is fragmented. Strategic playbooks now highlight IoT tank telemetry, emphasize vertical integration, and establish renewable-propane partnerships. Infrastructure giants are increasing fractionation to enhance export value. In contrast, newer players are disrupting the market with a low-carbon supply approach. Private equity is making a significant impact. Smaller chains are leveraging their density and close customer relationships. Simultaneously, cooperatives are bundling fuel with agronomy services, strengthening customer loyalty in rural markets. Collectively, these strategies contribute to a dynamic balance in the U.S. propane market.
United States Propane Industry Leaders
AmeriGas Propane, Inc.
Ferrellgas
Suburban Propane
DCC Propane
Superior Plus Propane
- *Disclaimer: Major Players sorted in no particular order

Recent Industry Developments
- June 2025: AmeriGas Propane, Inc., has finalized a definitive agreement to divest its Hawaii assets to Isle Gas, a subsidiary of AMF Hawaii Investment Holdings, LLC. This strategic decision includes the sale of approximately 750,000 gallons of propane storage facilities and a delivery fleet serving customers throughout Hawaii.
- May 2025: Alliance Energy Services, specializing in propane supply and logistics, has acquired 18 propane terminals from NGL Energy Partners. This move bolsters Alliance Energy Services' infrastructure, enhancing its capacity to cater to customers in pivotal markets across the nation, as stated by the company.


United States Propane Market Report Scope
Propane is a three-carbon alkane gas (C3H8). It is stored under pressure inside a tank as a colorless, odorless liquid.
The propane market is segmented by source, application, and end-user industry. By source, the market is segmented into natural gas processing, crude oil refining, and renewable propane (bio-propane). By application, the market is segmented into space and water heating, cooking, motor fuel, chemical feedstock, power generation, and other applications. By end-user industry, the market is segmented into residential, commercial, industrial, transportation, power generation, and other end-user industries. For each segment, the market sizing and forecasts are done based on volume (Tons).
By Source
| Natural Gas Processing |
| Crude Oil Refining |
| Renewable Propane (Bio-Propane) |
By Application
| Space and Water Heating |
| Cooking |
| Motor Fuel |
| Chemical Feedstock |
| Power Generation |
| Other Applications |
By End-user Industry
| Residential |
| Commercial |
| Industrial |
| Transportation |
| Power Generation |
| Other End-user Industries |
| By Source | Natural Gas Processing |
| Crude Oil Refining | |
| Renewable Propane (Bio-Propane) | |
| By Application | Space and Water Heating |
| Cooking | |
| Motor Fuel | |
| Chemical Feedstock | |
| Power Generation | |
| Other Applications | |
| By End-user Industry | Residential |
| Commercial | |
| Industrial | |
| Transportation | |
| Power Generation | |
| Other End-user Industries |


Key Questions Answered in the Report
How large is the United States propane market in volume terms today?
It reached 28.35 million tons in 2026 and is on track for 36.28 million tons by 2031, growing at a 5.06% CAGR.
Which application is expanding fastest?
Motor-fuel use, supported by school-bus and delivery-fleet conversions, is advancing at a 5.38% CAGR through 2031.
What is driving renewable propane growth?
LCFS and RFS credits underpin a 9.95% CAGR (2026-2031) for renewable supply despite premium pricing.
What is the competitive landscape of the market?
The United States Propane Market is fragmented. Strategic playbooks now highlight IoT tank telemetry, emphasize vertical integration, and establish renewable-propane partnerships.
Page last updated on:


