Market Overview
| Study Period | 2020 - 2031 |
|---|---|
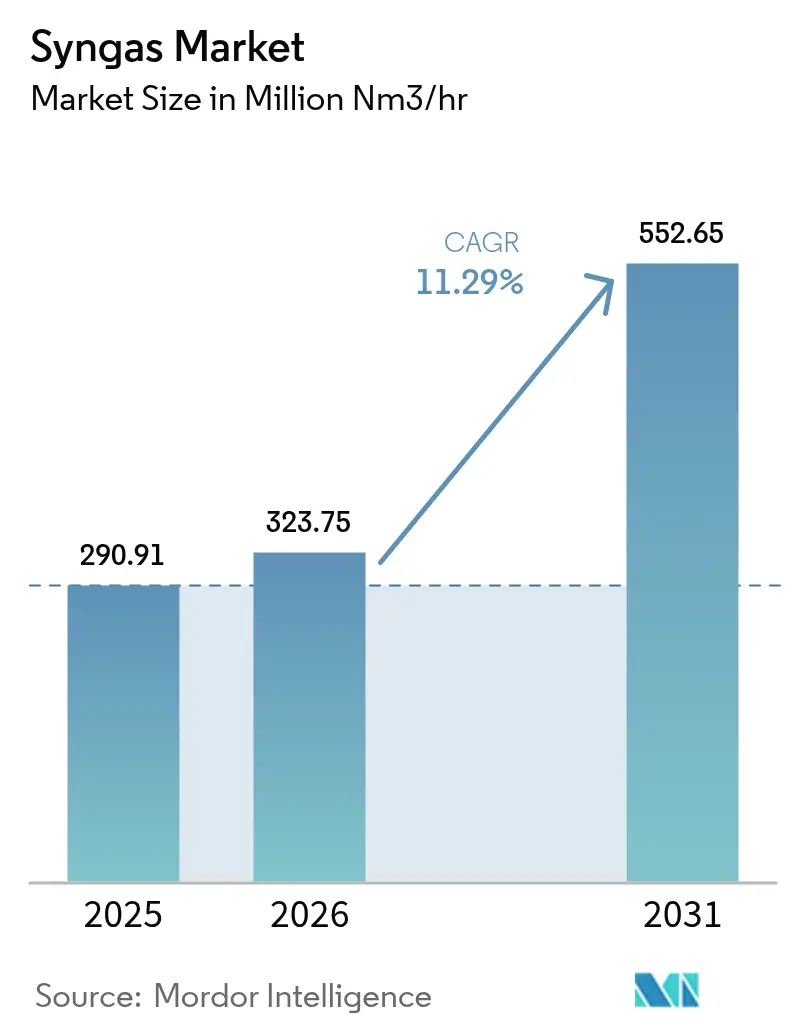
| Market Volume (2026) | 323.75 Million metric normal cubic meters per hour (mm nm³/h) |
| Market Volume (2031) | 552.65 Million metric normal cubic meters per hour (mm nm³/h) |
| Growth Rate (2026 - 2031) | 11.29% CAGR |
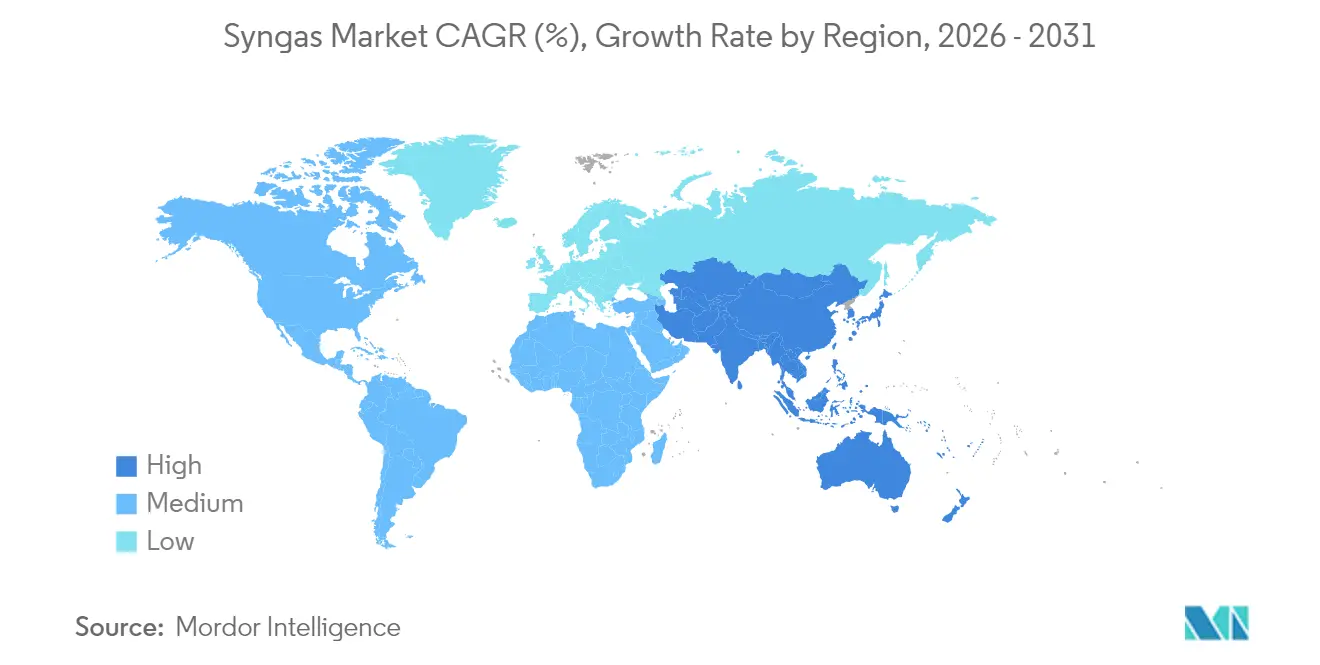
| Fastest Growing Market | Asia Pacific |
| Largest Market | Asia Pacific |
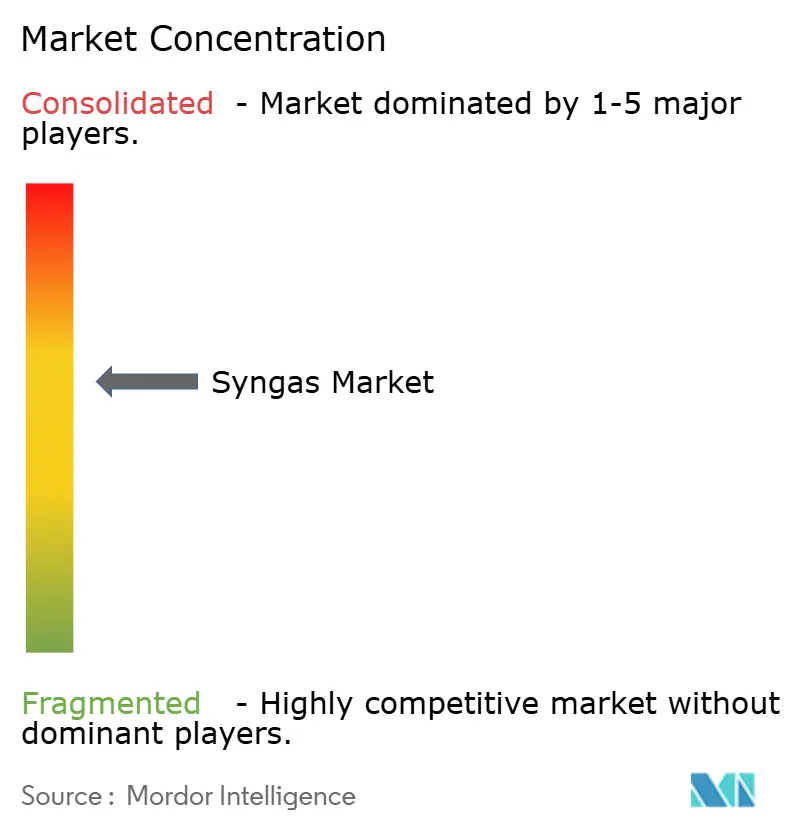
| Market Concentration | Medium |
Major Players *Disclaimer: Major Players sorted in no particular order Image © Mordor Intelligence. Reuse requires attribution under CC BY 4.0. | |
Syngas Market Analysis by Mordor Intelligence
The Syngas Market size is expected to grow from 290.91 Million metric normal cubic meters per hour (mm nm³/h) in 2025 to 323.75 Million metric normal cubic meters per hour (mm nm³/h) in 2026 and is forecast to reach 552.65 Million metric normal cubic meters per hour (mm nm³/h) by 2031 at 11.29% CAGR over 2026-2031. This expansion rests on widespread deployment of methanol-to-olefins complexes, new ammonia capacity in food-insecure regions, and binding aviation fuel decarbonization targets that scale power-to-liquids investments. Natural gas retains a cost advantage in steam reforming while simultaneously enabling blue hydrogen production, which supports low-carbon syngas demand. Coal gasification endures in China because of proven infrastructure, yet regulators now require higher efficiency and carbon capture that lift overall project value. Entrained flow gasifiers dominate high-volume chemical hubs, and fluidized bed configurations gain favor where biomass and municipal waste feedstocks are available. Competitive intensity deepens as technology licensors form alliances that bundle gasification, reforming, and carbon capture into turnkey offerings, positioning the syngas market for multi-regional growth through 2030.
Key Report Takeaways
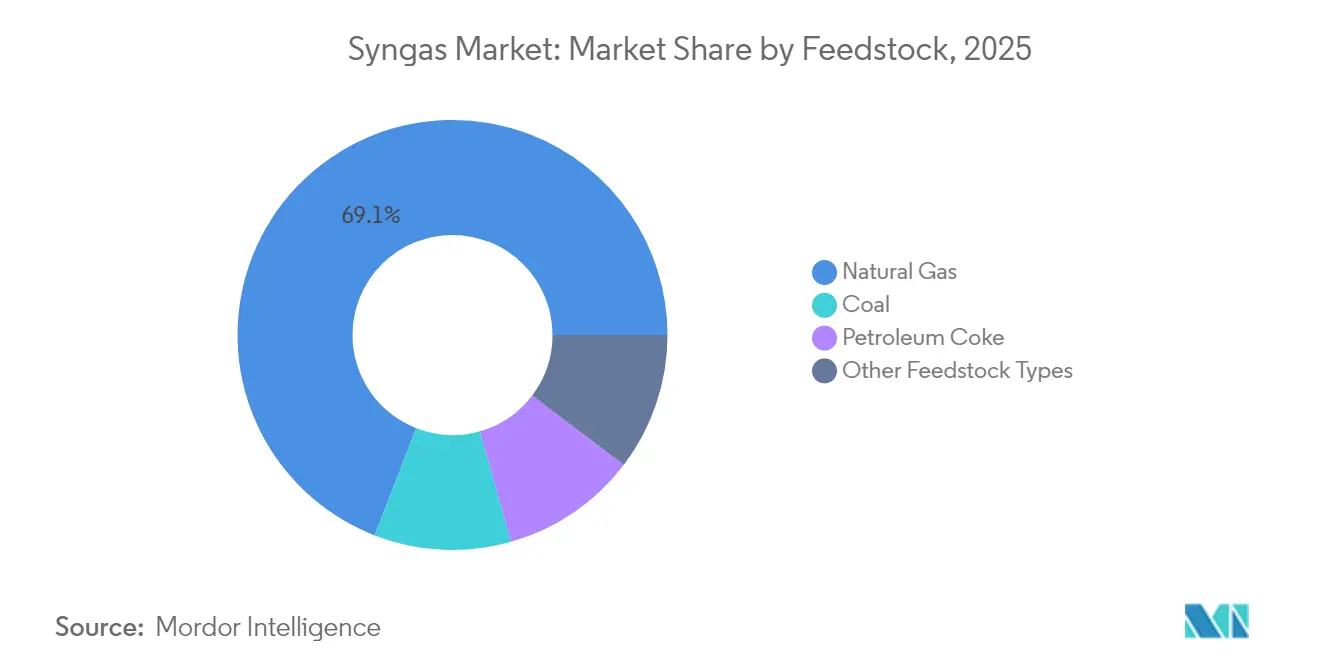
- By feedstock, natural gas held 69.10% syngas market share in 2025, while renewable-oriented synthetic natural gas applications are forecast to post the fastest 19.12% CAGR through 2031.
- By technology, gasification accounted for 54.40% of 2025 revenues, yet steam reforming is projected to expand at a 12.71% CAGR through 2031.
- By gasifier type, entrained flow gasifiers led with 41.10% of installed capacity in 2025, whereas fluidized bed systems are set to record a 13.61% CAGR through 2031.
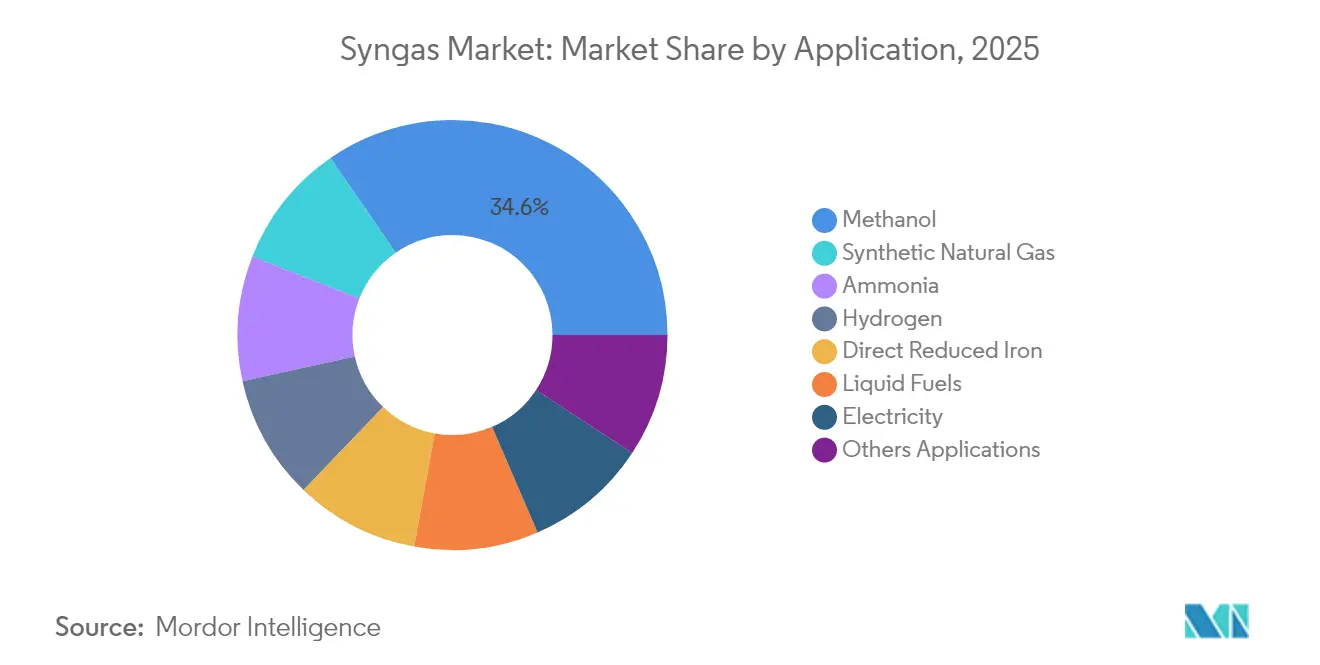
- By application, methanol applications captured 34.60% of volume in 2025, but synthetic natural gas is positioned for the quickest 19.12% CAGR through 2031.
- By geography, Asia-Pacific controlled 59.02% of 2025 demand, and is forecast to post the fastest 13.57% CAGR through 2031.
Note: Market size and forecast figures in this report are generated using Mordor Intelligence’s proprietary estimation framework, updated with the latest available data and insights as of 2026.
Global Syngas Market Trends and Insights
Drivers Impact Analysis*
| Driver | (~) % Impact on CAGR Forecast | Geographic Relevance | Impact Timeline |
|---|---|---|---|
| Surging Demand for Methanol-To-Olefins (MTO) Complexes in China | +2.8% | China, with spillover to APAC | Medium term (2-4 years) |
| Fertilizer Capacity Additions in South Asia and Africa | +2.1% | South Asia, Africa, with global supply chain effects | Long term (≥ 4 years) |
| Stringent Emission Norms Driving Coal-To-Gas (CTG) Projects | +1.9% | Global, concentrated in developed markets | Long term (≥ 4 years) |
| Carbon-Neutral Aviation Fuel Mandates (Power-To-Liquids) | +1.4% | Europe, North America, expanding globally | Medium term (2-4 years) |
| Municipal-Solid-Waste Gasification for Grid-Scale Hydrogen | +1.2% | Developed markets, urban centers | Medium term (2-4 years) |
| Source: Mordor Intelligence | |||
Surging Demand for Methanol-To-Olefins (MTO) Complexes in China
China’s petrochemical industry is shifting from gasoline centric refining to higher-value chemical production. Completion of Ningxia Coal Industry’s 3.6 million tons per annum DMTO-III plant, a CNY 11.8 billion investment, demonstrates confidence in the MTO route. The project saves raw coal and natural gas while cutting CO₂ emissions, underscoring a broader national pivot toward monetizing coal via chemicals rather than fuels. MTO capacity requires about 2.8 tons of syngas to yield 1 ton of ethylene equivalent, so syngas becomes the limiting reagent for incremental olefins output. Advanced catalytic pyrolysis from SINOPEC boosts light-olefin yields and further lowers emissions. As integrated crude-to-chemical complexes mature, they unlock flexibility that buffers margins during demand swings, creating enduring syngas market growth.
Fertilizer Capacity Additions in South Asia and Africa
Food security priorities and population expansion drive large ammonia projects that intensify syngas demand. AM Green Ammonia reached a final investment decision on a 1 million ton green plant in Kakinada and targets 5 million tons per year by 2030[1]AM Green, “Kakinada Green Ammonia Project,” am-green.com. The project has pre-certification under EU RFNBO rules, signaling strategic intent to capture premium European offtake. Global ammonia consumption is forecast to rise from 201 million tons in 2024 to 310 million tons by 2040, with the bulk still routed to urea fertilizers. Perdaman selected Topsoe’s SynCOR for a 3,500 metric tons per day plant, achieving economies of scale that slash unit costs and raise syngas utilization efficiency. Such gigascale designs concentrate syngas requirements in fewer hubs, heightening regional demand spikes and stimulating supporting infrastructure.
Stringent Emission Norms Driving Coal-To-Gas Projects
Emissions legislation accelerates coal plant conversions to integrated gasification combined cycle. IGCC removes over 95% of mercury at marginal cost uplift and simplifies pollutant treatment because species are present in concentrated syngas rather than dilute flue gas. Saudi Aramco’s USD 25 billion Jafurah shale buildout intends to lift sales gas by 60% through 2030 while supporting near-zero routine flaring. The national Master Gas System will add 3.15 billion scf/d by 2028, reinforcing syngas availability for domestic power and chemicals. NETL’s catalytic steam gasification operates with steam instead of oxygen, producing nitrogen-free, hydrogen-rich syngas at lower cost and >80% thermal efficiency, which enhances project returns. Collectively, these measures raise the baseline for environment-compliant syngas market adoption.
Carbon-Neutral Aviation Fuel Mandates (Power-To-Liquids)
Binding sustainable aviation fuel mandates in Europe and the United Kingdom create regulated off-take for synthetic kerosene. The UK will require 2% SAF in 2025, 10% by 2030, and 22% by 2040, including explicit targets for power-to-liquid volumes. Germany’s PtL roadmap calls for 200,000 tons of e-kerosene annually in 2030, ensuring year-round demand. Karlsruhe Institute of Technology integrated co-electrolysis with Fischer-Tropsch to generate syngas from CO₂ and water with 85% electrical energy recovery. DG Fuels adopted Johnson Matthey and bp’s FT technology for a Louisiana plant designed to yield 600,000 tons per year from waste biomass. These examples highlight how aviation policy locks in long-term syngas offtake, thereby reinforcing construction of new production units across the syngas market.
Restraints Impact Analysis*
| Restraint | (~) % Impact on CAGR Forecast | Geographic Relevance | Impact Timeline |
|---|---|---|---|
| US-EU restrictions on Russian gasification equipment | -1.6% | Europe and North America | Short term (≤ 2 years) |
| Volatility in coal and natural-gas feedstock pricing | -1.8% | Emerging and developed markets | Short term (≤ 2 years) |
| Limited bankability of biomass gasification projects | -1.1% | Europe and North America | Medium term (2-4 years) |
| Source: Mordor Intelligence | |||
US-EU Restrictions on Russian Gasification Equipment
Sanctions have tightened export licensing for oil and gas equipment to Russia, covering gasifiers and ancillary systems critical for syngas production. The US Commerce Department applies a presumption of denial for most applications, while the EU’s 14th package bars investment in Russian LNG projects under construction. More than 180 vessels face prohibition due to illicit shipping practices that include syngas technology deliveries. European developers now navigate longer procurement cycles and premium pricing to source non-Russian equipment, delaying commissioning schedules. Financing institutions incorporate these geopolitical risks into credit terms, raising debt costs for projects exposed to restricted suppliers. As a result, the syngas market faces near-term setbacks until alternative supply chains stabilize.
Volatility in Coal and Natural-Gas Feedstock Pricing
Natural gas futures for 2025 remain elevated at USD 13 per MMBtu, above affordability thresholds in price-sensitive Asian markets. Tight gas conditions can prompt coal switching, yet EU carbon prices render coal gasification less attractive despite feedstock spread advantages. Pacific coal indices increasingly follow LNG benchmarks, complicating hedging for dual-feedstock syngas plants. Producers must manage margin exposure through long-term offtake contracts and fuel collars, which constrain flexibility. Persistent volatility erodes lender confidence, especially for standalone biomass or waste gasifiers that cannot blend cheaper fuels. Such uncertainty subtracts up to 1.8 percentage points from overall CAGR within the syngas market.
*Our forecasts treat driver/restraint impacts as directional, not additive. The impact forecasts reflect baseline growth, mix effects, and variable interactions.
Segment Analysis
By Feedstock: Natural Gas Dominance Faces Renewable Pressure
Natural gas generated 69.10% of syngas market share in 2025, reflecting widespread steam reforming infrastructure and competitively priced supply. The segment is forecast to post a 16.38% CAGR through 2031, the highest among all feedstocks, driven by blue hydrogen investments that embed carbon capture into existing facilities. Operators such as ExxonMobil plan to remove 98% of CO₂ from reforming streams at the Baytown complex, underscoring decarbonization potential. Integration with sequestration hubs and hydrogen pipelines lowers incremental logistics cost and sustains growth momentum. The syngas market size for natural gas feedstock is projected to expand quickly as petrochemical producers shift toward lower-carbon molecules.
Coal remains structurally important, especially in China where domestic reserves offer energy security and cost certainty. Regulatory mandates compel higher cold-gas efficiencies and carbon capture, which raises capital expenditure but improves environmental performance. Petroleum coke gasification addresses refinery waste valorization, allowing operators to monetize high-sulfur streams and reduce disposal liabilities. Renewable feedstocks, led by municipal solid waste and agricultural residues, currently represent a small portion but earn credits under low-carbon fuel standards. As technology matures, expectations of a broader feedstock mix keep long-term investors engaged in the syngas market.


By Technology: Steam Reforming Accelerates Through Low-Carbon Integration
Gasification technologies delivered 54.40% of 2025 revenue, yet steam reforming is expected to expand at a 12.71% CAGR through 2031, reflecting its adaptability to blue hydrogen pathways. Steam reformers achieve thermal efficiencies above 80% when complemented by waste-heat recovery, and carbon capture insertion lowers lifecycle emissions enough to earn premium offtake contracts. Air Liquide’s renewable hydrogen projects demonstrate how recycled biogenic by-products can replace fossil hydrocarbons in reformer feedstocks, cutting emission intensity without major hardware changes. Innovations in autothermal reforming further reduce oxygen demand, thereby lowering utility cost and capital expenditure.
Gasification retains an edge in feedstock flexibility, processing coal, petcoke, and biomass within the same reactor family. Entrained flow and fluidized bed gasifiers optimize for higher throughput or feedstock variability, respectively. NETL’s catalytic steam gasification eliminates nitrogen dilution by operating with steam alone, boosting product purity for ammonia or Fischer-Tropsch synthesis. Hybrid approaches such as Linde’s Hot Oxygen Technology combine reforming and gasification, converting residual tars into additional syngas and lifting overall yield. These continuous improvements keep gasification competitive even as steam reforming gains low-carbon momentum, ensuring diverse technology adoption within the syngas market.
By Gasifier Type: Fluidized Bed Innovation Drives Market Dynamics
Entrained flow gasifiers accounted for 41.10% of capacity in 2025, favored in large methanol and ammonia complexes where high carbon conversion offsets higher capital cost. They operate above 1,400 °C, producing a tar-free syngas ideal for downstream catalysis. Ongoing upgrades in refractory materials push operating campaigns beyond three years, lowering maintenance downtime.
Fluidized bed gasifiers, projected to achieve 13.61% CAGR through 2031, bring superior feedstock flexibility and modular scales suited to distributed generation. Bubbling and circulating versions handle biomass, refuse-derived fuel, and low-rank coal without extensive pretreatment. Fraunhofer’s multi-stage fixed bed upgrade attains 81.3% cold-gas efficiency from ash-rich sewage sludge, illustrating niche improvements that broaden applicability. Fixed bed units continue serving remote operations that lack sophisticated maintenance support. Collectively, gasifier diversity ensures end users can tailor plant designs to local feedstock and offtake conditions, supporting sustained expansion of the syngas market.
By Application: Synthetic Natural Gas Emerges as Growth Leader
Methanol retained 34.60% volume share in 2025 because of its entrenched role in formaldehyde, acetic acid, and MTO chains within the syngas industry. Consolidation moves such as Methanex acquiring OCI Global’s methanol business for USD 2.05 billion highlight strategic value in scale and global logistics. E-methanol demand from marine shipping accelerates because International Maritime Organization regulations favor sulfur-free fuels.
Synthetic natural gas applications are set to post a market-leading 19.12% CAGR through 2031 as countries pursue energy security and grid stability. SNG plants convert excess renewable power to storable methane, balancing seasonal demand swings. Ammonia remains a heavyweight syngas consumer, with CF Industries and Mitsui planning a 1.4 million ton blue ammonia joint venture that will couple autothermal reforming with carbon capture. Hydrogen for industrial decarbonization, especially direct reduced iron in steel, also scales rapidly. Fischer-Tropsch liquids meet sustainable aviation targets, while syngas-fired turbines supply firm capacity that complements variable renewables. The syngas market therefore grows on multiple practical uses that all require reliable synthesis gas.
Geography Analysis
Asia-Pacific commanded 59.02% of 2025 demand and is forecast to register a 13.57% CAGR through 2031, the highest among regions. China’s massive coal chemical base expands further with Ningxia Coal Industry’s CNY 11.8 billion DMTO-III installation, ensuring a vast pull on upstream syngas. India’s National Green Hydrogen Mission supports projects like AM Green Ammonia, aiming for 5 million tons of export-oriented capacity by 2030. Southeast Asian countries add distributed gasifiers to convert agricultural residues into power and fertiliser intermediates, thereby reducing import bills. These activities anchor the syngas market in the region and foster specialized engineering hubs.
North America leverages low-cost shale gas and generous carbon capture incentives. Air Products’ USD 4.5 billion Louisiana complex will deliver 750 million scf/d of blue hydrogen and sequester 5 million tons of CO₂ annually, integrating with 700 miles of pipeline. Linde’s Path2Zero facility in Alberta invests more than USD 2 billion to combine autothermal reforming with CCS, strengthening continental supply resilience. Canadian provinces position themselves as export gateways for ammonium and methanol to Asia, further embedding the syngas market in trans-Pacific trade.
Europe pushes renewable pathways. Air Liquide and its partners are developing 450 MW of electrolyzers in Rotterdam and Zeeland, collectively producing 53,000 tons of green hydrogen each year. Statutory obligations on SAF create guaranteed offtake for power-to-liquid plants in Germany and the Netherlands, raising capital confidence. Middle-East and Africa benefit from abundant natural gas and established petrochemical ports, with Aramco’s expansion adding 3.15 billion scf/d by 2028. South American potential emerges through Chile’s Volta USD 2.5 billion green ammonia venture. The geographic spread underscores how the syngas market thrives in diverse policy and resource settings.

Competitive Landscape
The syngas market shows moderate concentration anchored by global industrial gas suppliers, technology licensors, and energy majors that often collaborate. Air Products and Topsoe formed a worldwide alliance combining gasification with autothermal reforming, allowing single-vendor delivery of methanol and ammonia projects. Johnson Matthey and Thyssenkrupp Uhde integrate blue ammonia technology, targeting a USD 200 billion opportunity by 2050. Such partnerships bundle catalysts, reactors, and capture units, improving bankability and accelerating adoption.
Industrial gas giants diversify into feedstock-agnostic syngas platforms. Air Liquide invests in renewable hydrogen, while Linde enhances gasifier yields through proprietary oxygen technologies. Engineering, procurement, and construction firms enter licensing ventures to secure recurring catalyst sales and digital optimization services. Patent activity rises, illustrated by an electric-powered closed-loop endothermic gasification system that processes coal, biomass, and rubber with net positive energy balance, potentially challenging incumbent high-temperature designs. Start-ups such as MAIRE pursue circular economy models that convert waste plastics into syngas and chemical feedstocks, adding competitive pressure.
Access to inexpensive CO₂ storage, reliable feedstocks, and firm offtake contracts remains the decisive advantage in the syngas industry. Companies embedded in regions with pipeline networks and sequestration acreage achieve lower delivered CO₂ costs, which improves blue syngas margins. Technology licensors holding references for plants above 3,000 tpd command premium fees because scale lowers unit costs. Governments that subsidize electrolyzers reshape competitive dynamics, giving first movers attractive power purchase agreements. Overall, rivalry intensifies yet remains balanced by the scale and complexity of syngas investments.
Syngas Industry Leaders
Air Liquide
Linde plc
Shell plc
Topsoe A/S
Air Products and Chemicals, Inc.
- *Disclaimer: Major Players sorted in no particular order

Recent Industry Developments
- February 2025: Air Liquide announced two large-scale electrolyzer projects in Europe with a combined capacity of 450MW. The company invested over EUR 1 billion to produce 53,000 tons of renewable hydrogen annually. These projects support European decarbonization objectives and demonstrate the company's focus on renewable syngas production.
- September 2023: BASF has started constructing its syngas plant at the Verbund site in Zhanjiang, China. The plant incorporates process innovations to reduce carbon emissions compared to conventional syngas facilities, aligning with BASF's sustainability objectives. The plant's production methods will primarily use CO2 off-gas, a by-product from ethylene oxide processing, and excess fuel gas from steam cracker operations to produce syngas.


Global Syngas Market Report Scope
Syngas is a gaseous mix containing mainly hydrogen and carbon monoxide, mostly produced from steam reforming and gasification. It can be used to produce chemicals such as ammonia, acetic acid, butanol, methanol, and dimethyl ether. The fertilizer segment mainly consumes ammonia, and methanol and dimethyl ether can be used as fuel.
The syngas market is segmented by feedstock, technology, gasifier type, application, and geography. By feedstock, the market is segmented into petcoke, coal, natural gas, and other feedstock types. By technology, the market is segmented into steam reforming and gasification. By gasifier type, the market is segmented into fixed bed, entrained flow, and fluidized bed. By application, the market is segmented into methanol, ammonia, hydrogen, liquid fuels, direct reduced iron, synthetic natural gas, electricity, and other applications. The report also covers the market size and forecasts for syngas in 12 countries across major regions. For each segment, the market sizing and forecasts have been done based on capacity volume (million metric normal cubic meters per hour (MM NM³/h)).
By Feedstock
| Coal |
| Natural Gas |
| Petroleum Coke |
| Other Feedstock Types |
By Technology
| Steam Reforming |
| Gasification |
By Gasifier Type
| Fixed Bed |
| Fluidized Bed |
| Entrained Flow |
By Application
| Methanol |
| Ammonia |
| Hydrogen |
| Liquid Fuels |
| Synthetic Natural Gas |
| Direct Reduced Iron |
| Electricity |
| Others Applications |
By Geography
| Asia-Pacific | China |
| India | |
| Rest of Asia-Pacific | |
| North America | United States |
| Canada | |
| Trinidad and Tobago | |
| Europe | Russia |
| Rest of Europe | |
| South America | Brazil |
| Venezuela | |
| Rest of South America | |
| Middle-East and Africa | Saudi Arabia |
| Qatar | |
| South Africa | |
| Iran | |
| Rest of Middle-East and Africa |
| By Feedstock | Coal | |
| Natural Gas | ||
| Petroleum Coke | ||
| Other Feedstock Types | ||
| By Technology | Steam Reforming | |
| Gasification | ||
| By Gasifier Type | Fixed Bed | |
| Fluidized Bed | ||
| Entrained Flow | ||
| By Application | Methanol | |
| Ammonia | ||
| Hydrogen | ||
| Liquid Fuels | ||
| Synthetic Natural Gas | ||
| Direct Reduced Iron | ||
| Electricity | ||
| Others Applications | ||
| By Geography | Asia-Pacific | China |
| India | ||
| Rest of Asia-Pacific | ||
| North America | United States | |
| Canada | ||
| Trinidad and Tobago | ||
| Europe | Russia | |
| Rest of Europe | ||
| South America | Brazil | |
| Venezuela | ||
| Rest of South America | ||
| Middle-East and Africa | Saudi Arabia | |
| Qatar | ||
| South Africa | ||
| Iran | ||
| Rest of Middle-East and Africa | ||


Key Questions Answered in the Report
What is the projected growth rate of the syngas market between 2026 and 2031?
The syngas market is forecast to expand from 323.75 mm nm³/h in 2026 to 552.65 mm nm³/h by 2031, reflecting an 11.29% CAGR.
Which feedstock currently dominates syngas production volumes?
Natural gas leads with 69.10% share in 2025, thanks to widespread steam reforming facilities and access to inexpensive shale supply.
Which application in the syngas industry is expected to grow fastest in the coming years?
Synthetic natural gas is projected to record a 19.12% CAGR through 2031 as grids seek seasonal storage and renewable balancing solutions.
Why are fluidized bed gasifiers gaining popularity?
Fluidized bed units handle diverse feedstocks, including biomass and municipal waste, and are forecast to grow at 13.61% CAGR through 2031, the fastest among gasifier types.
How are aviation fuel mandates influencing the syngas market?
Binding European and UK targets for sustainable aviation fuel create guaranteed offtake for power-to-liquids plants, driving new syngas demand for e-kerosene production.
Page last updated on:


