Market Overview
| Study Period | 2020 - 2031 |
|---|---|
| Forecast Data Period | 2026 - 2031 |
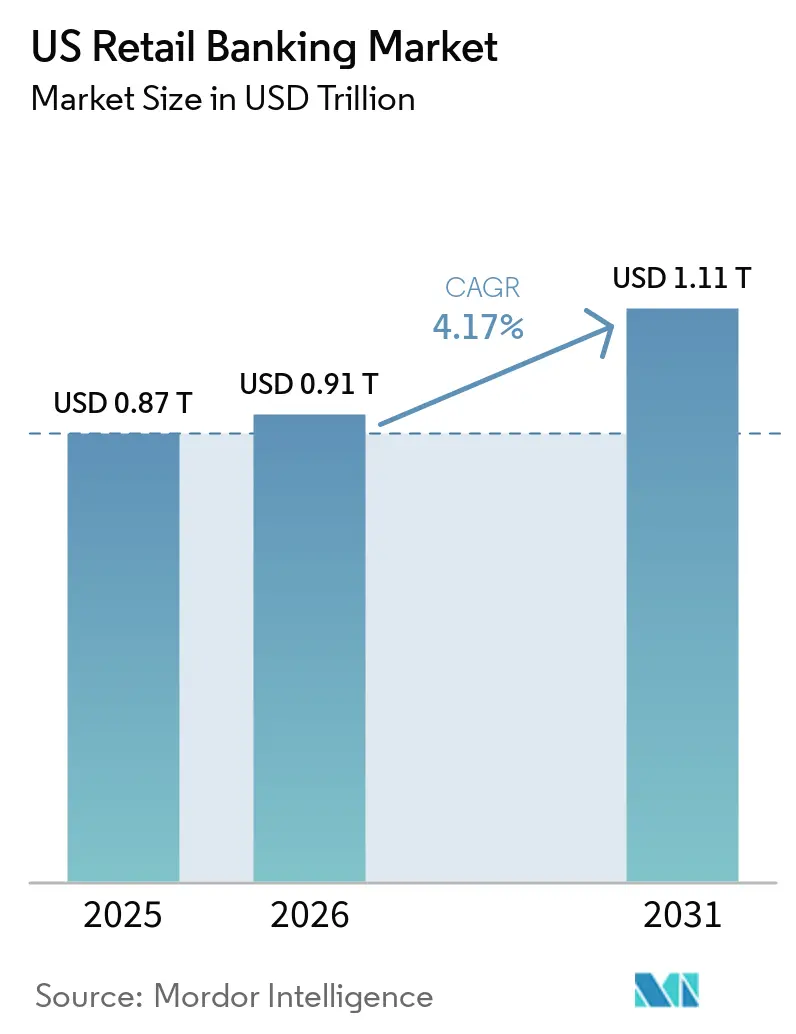
| Base Year Market Size (2025) | USD 0.87 Trillion |
| Market Size (2026) | USD 0.91 Trillion |
| Market Size (2031) | USD 1.11 Trillion |
| Growth Rate (2026 - 2031) | 4.17% CAGR |
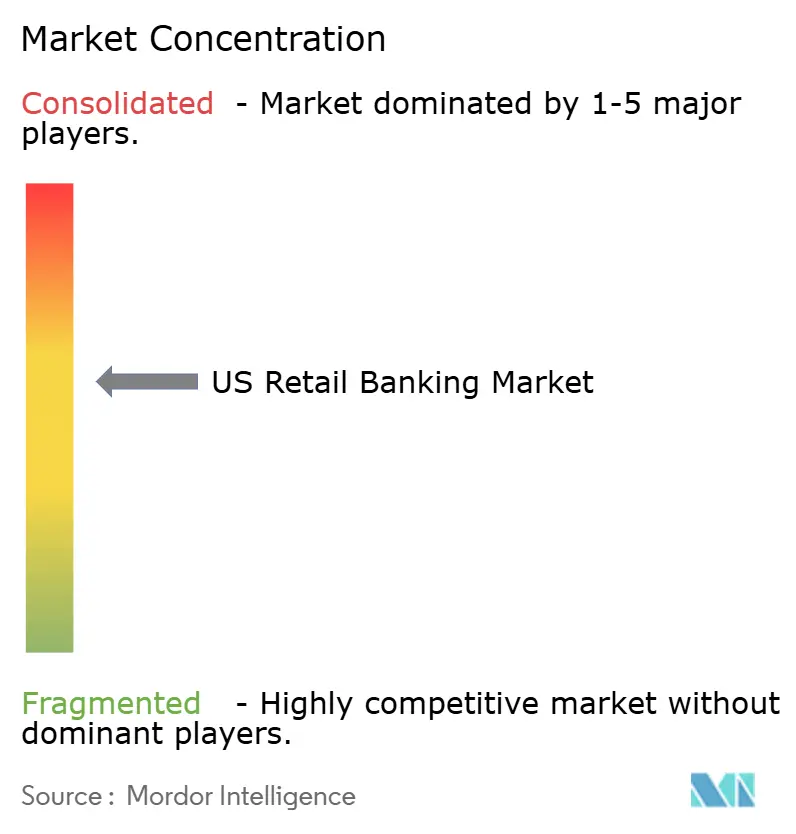
| Market Concentration | Medium |
Major Players *Disclaimer: Major Players sorted in no particular order Image © Mordor Intelligence. Reuse requires attribution under CC BY 4.0. | |
US Retail Banking Market Analysis by Mordor Intelligence
The US Retail Banking Market size is projected to expand from USD 0.87 trillion in 2025 and USD 0.91 trillion in 2026 to USD 1.11 trillion by 2031, registering a CAGR of 4.17% between 2026 to 2031.
This growth trajectory underscores how instant payments adoption, strong card spending, and mobile-first access combine to pull through revenue across deposits, payments, and lending. The United States retail banking market continues to rebalance product economics as debit interchange proposals, open banking data portability, and capital rules reshape incentives on pricing and portfolio mix. The United States retail banking market is also seeing digital engagement normalize at a higher baseline while real-time rails deepen primary-account relationships for payroll, disbursements, and bill pay. At the same time, deposit costs face pressure from record money market fund balances and stablecoin-enabled flows, intensifying competition for rate-sensitive savers. The United States retail banking market is expected to remain moderately concentrated, with scale advantages for large institutions on funding diversification, fraud management, and real-time infrastructure.
Key Report Takeaways
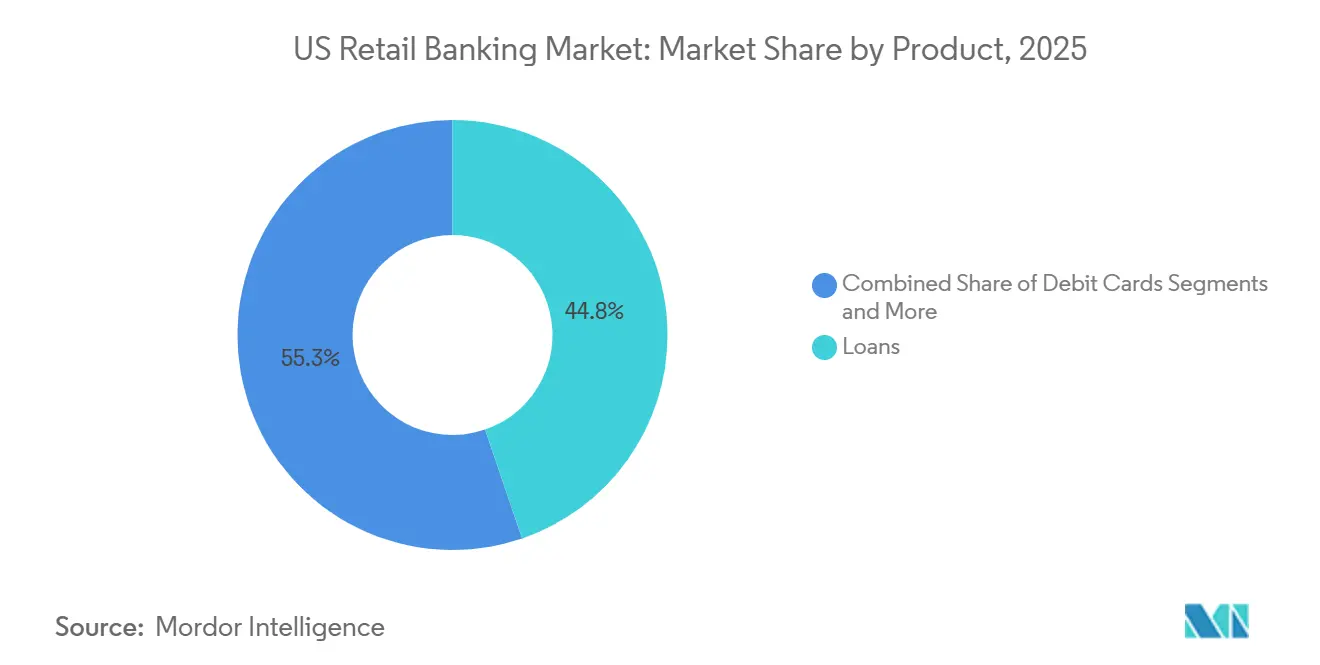
- By product category, Loans led with 44.75% revenue share of the United States Retail Banking Market in 2025, while Debit Cards is projected to expand at a 7.76% CAGR through 2031.
- By channel, Online Banking accounted for 71.48% of the United States Retail Banking Market in 2025 and is advancing at a 6.16% CAGR through 2031.
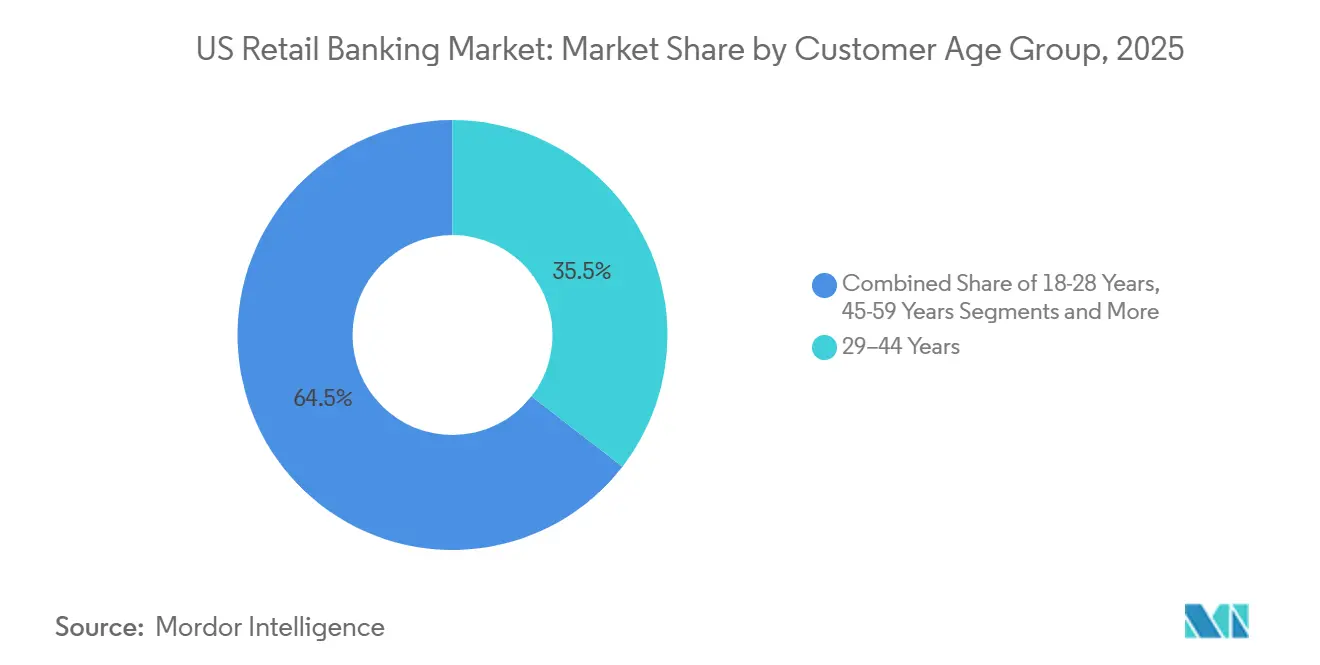
- By customer age group, the 29–44 Years cohort commanded 35.49% of the United States Retail Banking Market in 2025, while the 18–28 Years segment is forecast to grow at a 6.87% CAGR through 2031.
- By bank type, National Banks controlled a 67.84% share of the United States Retail Banking Market in 2025, while Neobanks & Others are projected to record the fastest growth through 2031.
Note: Market size and forecast figures in this report are generated using Mordor Intelligence’s proprietary estimation framework, updated with the latest available data and insights as of 2026.
US Retail Banking Market Trends and Insights
Drivers Impact Analysis*
| Driver | (~) % Impact on CAGR Forecast | Geographic Relevance | Impact Timeline |
|---|---|---|---|
| Mobile/online becomes primary access channel | +1.2% | Global, with early gains in urban metros (New York, San Francisco, Seattle) | Short term (≤ 2 years) |
| Instant payments ubiquity (RTP/FedNow) accelerates deposit primacy and engagement | +0.9% | National, with early adoption by Category I–II banks and credit unions | Medium term (2–4 years) |
| Card spending growth sustains fee and interest income | +0.7% | National, spill-over to suburban and exurban retail corridors | Medium term (2–4 years) |
| CNP debit growth expands interchange and checking engagement | +0.5% | National, concentrated in e-commerce hubs (California, Texas, Florida) | Long term (≥ 4 years) |
| Government and biller instant disbursements/RfP shift drive primary-account capture | +0.6% | National, with public-sector leadership in Social Security, Medicare, and state tax-refund programs | Long term (≥ 4 years) |
| Open banking data portability (CFPB §1033) enables switching and personalized pricing | +0.4% | National | Medium term (2–4 years) |
| Source: Mordor Intelligence | |||


Mobile and Online Banking Primacy Redefines Customer Touchpoints
Mobile banking became the most-used access channel for 55% of U.S. consumers in 2024, marking its highest share since the American Bankers Association began tracking the metric in 2017[1]American Bankers Association, “Consumer Survey, Banking Methods 2024,” American Bankers Association, aba.com . Branch visits account for a smaller share of primary interactions, while online and mobile continue to lead, reflecting sustained digital habits and trust built through improved authentication and alerts. Generational patterns show 68% of Millennials and 64% of Gen Z primarily use mobile, compared with 41% of Baby Boomers who split preference between online and in-branch channels, which reinforces the need for hybrid distribution. Although digital is primary, most consumers still place value on branch presence in their neighborhoods for higher-stakes consultations and trust-building journeys. The United States retail banking market reflects this duality, with Online Banking’s 71.48% share in 2025 and a 6.16% forecast CAGR through 2031, reinforcing mobile-app primacy as the anchor of ongoing engagement.
Instant Payments Rails Unlock Real-Time Treasury and Engagement
Fed Now reached more than 1,300 participating financial institutions by early 2026, and it processed 1.3 million transactions in Q1 2025 as adoption broadened beyond early pilot phases[2]Board of Governors of the Federal Reserve System, “FedNow Service,” Federal Reserve Financial Services, frbservices.org . In parallel, The Clearing House’s RTP network processed 125 million payments worth USD 405 billion in Q4 2025, reflecting scale in both consumer and enterprise use cases. The United States retail banking market sees clear deposit primacy benefits as real-time availability motivates account consolidation for payroll, peer-to-peer transfers, and bill settlement. Request for Pay capabilities tied to instant rails improve bill payment experiences while reducing late fees, which, in pilot programs, have shown meaningful consumer benefit and engagement gains. As more institutions connect to FedNow and RTP, real-time clearing pushes investment in fraud controls and operational readiness to ensure the customer experience remains predictable at scale.
Card Spending Momentum Sustains Fee and Interest Revenue
Credit card volume reached USD 5.6 trillion in 2025, and debit card volume reached USD 4.7 trillion, underscoring the centrality of card rails within consumer payment mixes. Card-not-present debit accounted for 34.4% of total debit volume in 2025, enhancing digital commerce monetization for issuers as e-commerce penetration increases. Regulation II proposals would reduce the base debit interchange cap from 21 cents to 14.4 cents and require expanded routing options for card-not-present transactions, pressuring issuer revenue models tied to debit economics[3]. Despite higher charge-off rates late in 2025, revolving balances increased to USD 1.17 trillion while average purchase APRs remained elevated, which supported net interest income on card portfolios. The United States retail banking market, therefore, treats card portfolios as a durable revenue engine even as pricing and routing rules evolve on debit.
CNP Debit Expansion Broadens Interchange and Engagement Surfaces
Card-not-present debit reached 34.4% of debit transactions in 2025, driven by subscription adoption, gig-economy payouts, and card-on-file use cases that reinforce digital banking behavior. Proposed Regulation II updates would expand merchant routing choices for CNP debit, shifting share between signature and PIN-debit networks and compelling issuers to respond with tokenization and real-time risk scoring to preserve interchange and manage fraud. Banks deploying AI-driven CNP fraud models reported multi-million-dollar annual savings in 2025, illustrating the return profile from modernized defenses at scale. The United States retail banking market is seeing higher engagement for accounts linked to CNP-enabled debit instruments as customers consolidate subscriptions, bill pay, and wallet top-ups into a single primary account. As e-commerce deepens, CNP debit remains a critical surface for both interchange and relationship depth, aligning with real-time rails that improve funds availability and reduce friction.
Restraints Impact Analysis*
| Restraint | (~) % Impact on CAGR Forecast | Geographic Relevance | Impact Timeline |
|---|---|---|---|
| MMF yield competition elevates deposit betas and compresses NIM | -0.6% | National, acute in high-net-worth coastal metros (New York, Boston, Los Angeles) | Short term (≤ 2 years) |
| Basel III endgame raises capital and operational risk charges | -0.4% | National, disproportionate impact on Category II–III banks (USD 100B–USD 700B assets) | Medium term (2–4 years) |
| Proposed debit interchange cap and CNP routing changes | -0.3% | National | Medium term (2–4 years) |
| Regulatory overhang on late fees and overdrafts | -0.2% | National | Short term (≤ 2 years) |
| Source: Mordor Intelligence | |||
Money Market Fund Competition Elevates Deposit Costs and Compresses Margins
Money market fund assets reached a record USD 7.82 trillion in 2025, offering competitive yields on Treasury-backed instruments that draw rate-sensitive deposits away from traditional accounts[4]Investment Company Institute, “Money Market Fund Assets,” Investment Company Institute, ici.org. Deposit betas rose to 73% during the recent tightening cycle, and as policy rates stayed elevated, banks passed through more increases to defend funding bases, which raised deposit costs. Community bank net interest margins compressed to 3.8% in Q4 2025 as funding costs rose faster than asset yields repriced, especially for fixed-rate loans originated at lower coupons. The rise of stablecoin settlement activity adds to the competition for transactional balances, highlighted by Visa’s launch of USDC settlement in the United States in December 2025. The United States retail banking market, therefore, faces a deposit-acquisition environment that rewards product differentiation, instant access, and fee transparency to offset rate-only competition.
Basel III Endgame Capital Requirements Temper Balance-Sheet Expansion
The Federal Reserve finalized Basel III endgame rules in November 2025, adjusting leverage and operational-risk capital standards in ways that still increase capital requirements for many large regional institutions. Category II and III banks are expected to hold higher common equity tier 1 capital against certain retail exposures, including unfunded credit card lines and home-equity commitments, which can lift pricing thresholds and reduce risk appetite. Smaller community banks remain outside supplementary leverage ratio requirements, preserving relative flexibility in areas like small-business lending and relationship banking. Large banks have already built capital cushions, as reflected in reported ratios at year-end 2024, to prepare for the final framework and maintain lending continuity. The United States retail banking market will continue to balance growth with capital efficiency as risk-weighted asset optimization and fee-based revenue become higher strategic priorities under the new regime.
*Our forecasts treat driver/restraint impacts as directional, not additive. The impact forecasts reflect baseline growth, mix effects, and variable interactions.
Segment Analysis
By Product: Loans Anchor Share While Debit Cards Lead Growth
Loans held 44.75% of the United States retail banking market in 2025, reflecting the weight of mortgages, home equity, personal lending, and small-business credit in consumer and microbusiness finance. Debit Cards are projected to post a 7.76% CAGR through 2031 as embedded finance, card-on-file subscriptions, and card-not-present routing expand day-to-day spending use cases across retail and services. The United States retail banking market size for card-related fee pools rises with digital commerce depth, while proposed interchange and routing rules change how issuers and merchants share economics. Debit card-not-present share reached 34.4% in 2025, which supports incremental interchange and reinforces account usage for bill pay and recurring charges. Transactional Accounts benefit from real-time fund availability tied to FedNow and RTP, encouraging payroll and P2P consolidation into a primary account relationship.
Savings Accounts face clear rate competition from money market funds, requiring higher yields and improved digital features to retain balances, which can compress net interest margins for banks that lack low-cost funding diversification. Credit Cards remain a stable revenue engine despite cyclical charge-off changes because revolving balances and APR levels support net interest income even as promotions cycle. The United States retail banking market share dynamic across products is increasingly shaped by instant-payment integration, which reduces friction for billers and consumers and pulls volume into bank-owned rails. Regulatory proposals on debit routing require issuers to enhance tokenization and real-time risk analytics to protect interchange and minimize dispute costs at scale. Cross-sell through advisory and digital tools still matters, especially for mass-affluent households that grow balances across deposit, lending, and investment accounts.


By Channel: Online Banking Dominates as Branch Networks Stabilize
Online Banking accounted for 71.48% of channel share in 2025 and is forecast to grow at a 6.16% CAGR through 2031 as more day-to-day activity moves to mobile and web interfaces. The United States retail banking market continues to mix digital convenience with human advice, as customers still value branches for higher-stakes interactions even while listing mobile as their most-used access point. Mobile as the primary method reached 55% in 2024, a high-water mark in the ABA survey, which suggests the digital baseline is durable rather than a temporary pandemic effect. Instant rails strengthen the digital primacy of Online Banking because fund availability, bill settlement, and P2P experiences are faster and less error-prone when customers remain in-bank rather than detouring to external wallets. As fraud risk evolves with real-time clearing, banks invest in stronger authentication and behavioral analytics to keep experiences seamless while containing losses.
Offline Banking retains essential roles for onboarding complex products, resolving exceptions, and meeting community expectations in assessment areas where branch presence is linked to local reinvestment responsibilities. The United States retail banking market size associated with branch-intensive services will adjust more slowly because advice-heavy products and certain cash-based activities still require in-person capabilities. Process improvements on the regulatory side, such as streamlined branch application reviews adopted in late 2025, reduce friction for banks making strategic footprint changes in growth markets. Over time, footprint strategy will align with migration and commerce shifts, but digital will remain the center of routine engagement for the United States retail banking market. Institutions that blend top-tier mobile with selective branch investments will capture the widest set of customer preferences.
By Customer Age Group: 29–44 Years Dominate While 18–28 Cohort Grows Fastest
The 29–44 Years cohort held 35.49% of the market in 2025, supported by peak earning power, homebuying, and small-business formation that underpin multi-product relationships. The 18–28 Years segment is projected to expand at a 6.87% CAGR through 2031 as new workforce entrants adopt mobile-first checking, debit, and instalment options that raise engagement and build balances over time. The United States retail banking market sees higher debit usage and card-not-present activity in younger cohorts, reflecting subscription consumption and e-commerce habits that drive checking-linked engagement. Instant payroll and faster disbursements improve liquidity management for mid-career households, which helps the 29–44 Years cohort reduce the need for high-cost short-term credit and reinforces deposit primacy. Debt service and revolving balances remain material considerations for all age brackets, with overall household credit trends shaping payment and savings behaviour into 2026.
Older customers continue to prefer a higher share of in-branch interactions than younger segments, but mobile usage is rising steadily across all age groups as banks improve app usability and security. For the United States retail banking industry, demographic aging increases the relevance of advisory services, trust and estate solutions, and fraud protections that fit the needs of households with larger balances and more complex service needs. Youth-oriented propositions that combine instant issuance, P2P integration, and budgeting tools can improve long-term lifetime value by securing early primary-account status. The United States retail banking market share across age segments will reflect how well institutions match channel preference and product features to life-stage needs. Cohort migration into homeownership and small-business formation remains a key driver of multi-product engagement for banks with strong advisory capabilities.
By Bank Type: National Banks Hold Scale While Neobanks Surge
National Banks controlled 67.84% of the market in 2025, underscoring the value of diversified funding, larger technology budgets, and in-house risk operations that manage fraud and real-time payment models at scale. Neobanks & Others is projected to grow the fastest through 2031 as instant onboarding, zero-fee structures, and feature velocity appeal to digital-first customers seeking simplicity and transparency. The United States retail banking market includes institutions with dedicated real-time payments teams and data science resources, which further accentuates a scale gap between the largest banks and mid-sized competitors. At the same time, open banking rules reduce switching costs and push incumbents to compete on service quality instead of account lock-in. Visa’s launch of USDC settlement in late 2025 also signals payment-network innovation that can influence bank-to-fintech partnerships on digital money movement.
Regional and community banks can hold share by specializing in small-business treasury, tailored lending, and local advisory, benefitting from relative capital-rule relief and closer proximity to customers. Institutions that modernize cores and data platforms can shorten time-to-market for features customers now expect, including tokenized card issuance and real-time notifications. The United States retail banking market size distribution across bank types will remain sensitive to consolidation trends, capital rules, and consumer switching as APIs broaden portability. Banks that match digital excellence with fraud resilience will capture more active usage per account, especially in card-not-present and bill-pay contexts. Over time, partner-bank models and embedded finance can extend neobank reach while regulatory expectations shape balance-sheet flexibility.
Geography Analysis
The 2026 operating environment remains national in scope for product, channel, and regulatory drivers, although branch and deposit dynamics vary by region due to migration, income patterns, and the concentration of money market alternatives. The United States retail banking market aligns branch strategy with growth corridors while scaling mobile features that deliver consistent experiences regardless of location. Real-time rails access does not vary by region once connected, which places emphasis on reliable uptime and fraud models rather than footprint density for transactional engagement. Interchange and routing proposals apply nationally, so portfolio strategy responds more to customer mix and merchant ties than geography. The United States retail banking market size related to advisory-heavy services can still vary by metro due to demand for mortgages, small-business lending, and wealth management, which often require in-person support.
Deposit competition is most acute where high-income households concentrate and where access to money funds is frictionless, which raises local deposit betas and intensifies rate-based promotion. In markets with strong small-business ecosystems, treasury management and same-day payroll through RTP or FedNow improve primary-account capture for both business owners and employees. State-level compliance and operational timelines can influence rollout of new branches or renovations, but the federal streamlining of branch approvals shortens the cycle from plan to opening for eligible institutions. The United States retail banking market share by metro will keep reflecting where migration and job growth settle, while digital parity reduces service differences across regions. Fraud typologies differ somewhat by region due to merchant mixes and local crime patterns, but AI-driven scoring narrows gaps in loss performance.
At a national level, household leverage and revolving balance trends still shape demand for credit and payment products and can influence regional variability in loan growth. The United States retail banking market benefits where public agencies adopt instant disbursements, since recipients often keep their primary transaction accounts near home for convenience and dispute resolution. Customer age mix also explains local differences in digital adoption, with younger metros tilting more to mobile-only usage and older metros leaning more toward hybrid patterns. Bank type presence by metro matters, too, as megabanks bring national feature sets while regionals deepen through local small-business and community banking roles. The result is a national baseline in features and regulation with localized competition in advisory, small-business treasury, and deposit pricing.
Competitive Landscape
The United States retail banking market remains moderately concentrated, with large national institutions advantaged by funding diversification, scaled fraud controls, and early participation in real-time payment networks. Visa’s December 2025 USDC settlement launch in the United States shows how payment networks are expanding money-movement options, creating new partnership paths across banks and fintech’s for cross-border and instant settlement use cases. U.S. Bank formed a Digital Assets and Money Movement organization in October 2025 to accelerate emerging product development, signalling how incumbents are preparing for tokenized payments and asset services. The United States retail banking market also reflects sustained investment by leading banks in security and resiliency initiatives that span critical industry sectors and underpin the integrity of modern digital finance.
Fraud mitigation capability is a key differentiator as instant rails scale since scoring speed and tokenization effectiveness determine whether customers experience seamless transactions with low false positives. Banks with more advanced AI models report sizable fraud-loss savings and stronger authorization rates, which translate into higher customer trust and usage. Open banking will intensify competition in 2026 as switching friction declines and underwriting can be tuned to rich transaction and income data at the point of need. The United States retail banking market therefore rewards incumbents and challengers that combine instant access, transparent pricing, and proactive protection without adding complexity. As product economics evolve with Regulation II and capital standards, portfolio diversification and fee innovation become more important to sustain returns.
Footprint strategy remains active but more selective, supported by streamlined federal branch-application timelines that cut approval periods for eligible banks in late 2025. Where branches open, they tend to target growth markets and advisory-heavy roles that complement always-on digital engagement. The United States retail banking market relies on both national scale and local relevance, so regional institutions focus on small-business treasury, community development, and specialized lending where they can win on service quality. Continued investment in real-time connectivity and security should remain a unifying theme across bank types as customers expect immediate funds and reliable protection in equal measure. Companies that deliver on speed, safety, and simplicity will capture disproportionate engagement, irrespective of physical footprint size.
US Retail Banking Industry Leaders
JPMorgan Chase & Co.
Bank of America Corp.
Wells Fargo & Co.
Citigroup Inc.
U.S. Bancorp
- *Disclaimer: Major Players sorted in no particular order

Recent Industry Developments
- April 2026: JPMorgan Chase has finalized an agreement with the International Olympic Committee, becoming the first Global Banking Partner of the Olympic Games. The partnership encompasses the Los Angeles 2028 Olympic and Paralympic Games, as well as the French Alps 2030 Olympic and Paralympic Winter Games.
- February 2026: Bank of America has introduced BofA Rewards, a no-fee loyalty program designed to incentivize clients for their integrated banking and Merrill investing relationships. Starting May 27, clients can enroll to access benefits such as enhanced credit card rewards, cash-back offers, premium banking services, and exclusive experiences. Annual benefits range from USD 150 to USD 4,000, depending on membership tier and program participation.
- December 2025: Visa launched USDC stablecoin settlement in the United States, enabling U.S. issuer and acquirer partners, including Cross River Bank and Lead Bank, to settle with Visa using Circle’s USDC over the Solana blockchain, with monthly stablecoin settlement volume passing a USD 3.5 billion annualized run rate as of November 30, 2025.
- October 2025: JPMorgan Chase & Co. launched a USD 1.5 trillion, 10-year Security and Resiliency Initiative to facilitate, finance, and invest in industries critical to national economic security, including up to USD 10 billion in direct equity and venture capital investments focused on supply chain and advanced manufacturing, defense and aerospace, energy independence, and frontier technologies such as AI, cybersecurity, and quantum computing JPMorgan Chase.


Research Methodology Framework and Report Scope
Market Definitions and Key Coverage
Retail banking, in our study, covers all deposit, payment, and consumer-credit services offered by U.S. licensed banks and federally insured savings institutions to individuals, including checking and savings accounts, certificates of deposit, residential mortgages, personal and auto loans, debit and credit cards, and related fee-based services. Our lens tracks value creation through interest and non-interest income generated within these activities across branch, online, and mobile channels.
Scope exclusion: business banking products aimed at firms with more than USD 5 million in annual revenue are out of scope.
Segmentation Overview
- By Product
- Transactional Accounts
- Savings Accounts
- Debit Cards
- Credit Cards
- Loans
- Other Products
- By Channel
- Online Banking
- Offline Banking
- By Customer Age Group
- 18–28 Years
- 29–44 Years
- 45–59 Years
- 60 Years and Above
- By Bank Type
- National Banks
- Regional Banks
- Neobanks & Others
Detailed Research Methodology and Data Validation
Primary Research
We spoke with senior retail executives, digital channel leads, and community-bank presidents across every Federal Reserve district. These conversations tested growth levers (deposit betas, fee caps, AI-enabled cost take-out), validated typical net interest margins by product, and clarified adoption curves for branch-lite distribution. Insights from consumer focus groups on mobile usage and fee sensitivity further refined our adoption assumptions.
Desk Research
Analysts began with federal data sets such as the Federal Deposit Insurance Corporation's quarterly call reports, the Federal Reserve's Flow of Funds tables, and Consumer Credit releases, which map aggregate loan and deposit balances. Industry bodies, including the American Bankers Association, the Clearing House, and NACHA, helped benchmark payment volumes, interchange yields, and branch counts. Regulatory filings (10-Ks, call transcripts) from leading national and regional banks supplied granular segment splits, while press coverage gathered through Dow Jones Factiva highlighted asset sales, branch rationalization, and fintech partnerships.
Macro indicators, such as personal disposable income, Fed funds rate paths, and household debt-service ratios from the Bureau of Economic Analysis and the Congressional Budget Office, anchored demand assumptions. This catalogue is illustrative; many additional secondary sources were consulted to cross-verify figures and context.
Market-Sizing & Forecasting
A top-down construct converts FDIC balance-sheet totals and Census household counts into a retail-banking revenue pool, which is then pressure-tested through sampled average spreads and fee yields derived from earnings disclosures. Bottom-up roll-ups of sampled branch deposit bases and card outstandings act as a reasonableness check before totals are locked. Key drivers monitored include Fed policy rate trajectory, mortgage origination volumes, debit-card purchase frequency, household formation, and digital-only account penetration. Forecasts utilize multivariate regression blended with scenario analysis to capture rate and credit-cycle swings; gaps in branch-level sampling are bridged through weighted median scaling.
Data Validation & Update Cycle
Outputs pass two-stage peer review, variance flags trigger re-runs against independent metrics, and any deviation above three percentage points prompts management escalation. Reports refresh annually, with interim updates when rate moves or regulatory actions materially alter revenue pools; a final pre-publication sweep ensures clients receive the freshest view.
Why Our US Retail Banking Baseline Earns Trust
Published estimates diverge because firms select different income streams, customer groups, and refresh cadences.
Key gap drivers include whether small-business accounts sit inside scope, whether values represent asset balances or revenue, and the way modelers translate Fed rate moves into spread assumptions. Mordor's disciplined segment definition, annual refresh cycle, and dual validation temper both over-optimism and undue conservatism.
Benchmark comparison
| Market Size | Anonymized source | Primary gap driver |
|---|---|---|
| USD 0.87 trillion (2025) | Mordor Intelligence | - |
| USD 1.11 trillion (2024) | Global Consultancy A | Includes micro-business banking and counts service-fee income beyond core consumer lines |
| USD 0.39 trillion (2025) | Trade Journal B | Focuses only on transactional fee revenue, omits interest income from loan books |
In sum, our balanced, variable-driven framework, grounded in regulated disclosures and checked with front-line conversations, delivers a dependable baseline that decision-makers can trace and replicate with confidence.


Key Questions Answered in the Report
What is the current size and growth outlook for the United States retail banking market?
The market stood at USD 0.87 trillion in 2025 and is projected to reach USD 1.11 trillion by 2031 at a 4.17% CAGR during 2026-2031, reflecting the pull from instant payments, strong card volumes, and mobile-first access.
Which product lines contribute most to revenue in the United States retail banking market?
Loans held 44.75% share in 2025, while Debit Cards is set to grow fastest through 2031 due to card-not-present usage, subscriptions, and embedded finance.
How is channel mix evolving across the United States retail banking market?
Online Banking accounted for 71.48% in 2025 and is on track for a 6.16% CAGR through 2031, driven by mobile primacy and instant-payment integration, with branches reserved for advice-heavy interactions.
What demographic shifts matter most for growth in the United States retail banking market?
The 29–44 Years cohort led with 35.49% in 2025 due to mortgages and small-business activity, while the 18–28 Years segment is forecast to grow at 6.87% annually through 2031 as mobile-first banking becomes standard.
Which regulatory and macro factors are shaping bank strategies in the United States retail banking market?
Open banking data portability effective in April 2026 reduces switching friction, while Basel III endgame raises capital requirements and money market fund growth pressures deposit costs, all of which affect pricing and product mix.
How are real-time rails influencing competition in the United States retail banking market?
FedNow participation surpassed 1,300 institutions by early 2026 and RTP handled USD 405 billion in Q4 2025 transactions, helping banks win primary-account status through instant disbursements, payroll, and bill pay.
Page last updated on:


