
United States Landscaping Market Size and Share
Market Overview
| Study Period | 2021 - 2031 |
|---|---|
| Forecast Data Period | 2026 - 2031 |
| Base Year Market Size (2025) | USD 186 Billion |
| Market Size (2026) | USD 196.16 Billion |
| Market Size (2031) | USD 255.74 Billion |
| Growth Rate (2026 - 2031) | 5.46 % |
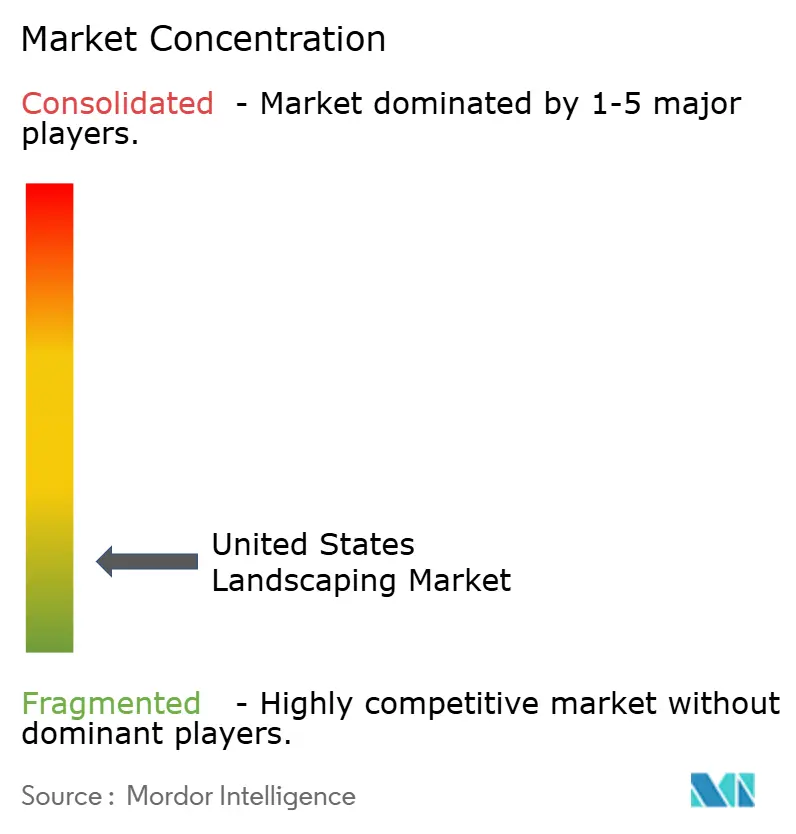
| Market Concentration | Low |
Major Players *Disclaimer: Major Players sorted in no particular order Image © Mordor Intelligence. Reuse requires attribution under CC BY 4.0. | |
United States Landscaping Market Analysis by Mordor Intelligence
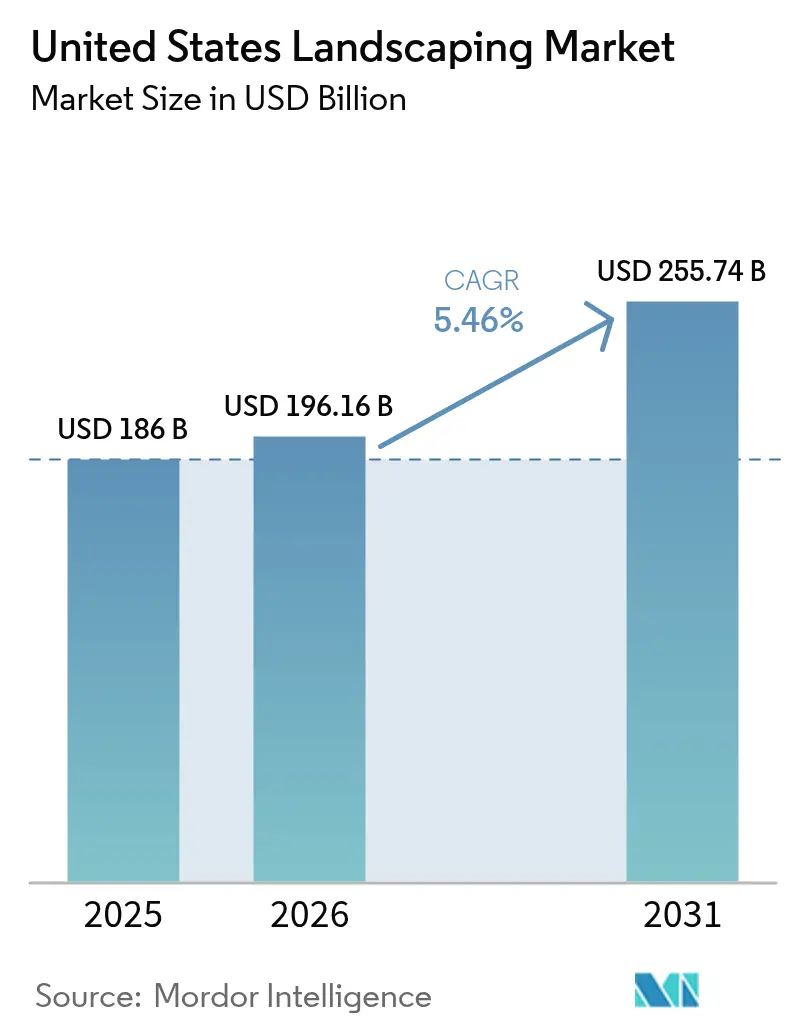
The United States landscaping market size is expected to grow from USD 186 billion in 2025 to USD 196.16 billion in 2026 and is forecast to reach USD 255.74 billion by 2031 at 5.46% CAGR over 2026-2031. Elevated spending on property enhancement, expanding subscriber-based lawn-care contracts, and rapid automation adoption are sustaining this growth momentum. Tight labor supply is accelerating investment in robotics and artificial intelligence tools that reduce crew hours while maintaining service quality. Commercial clients are upgrading sites to meet environmental, social, and governance targets, giving contractors with sustainable design capabilities a clear revenue premium. Consolidation remains brisk as private equity capital targets regional operators, yet the overall structure stays fragmented, preserving ample opportunity for new entrants to establish local footholds.
Key Report Takeaways
- By service type, maintenance captured 44.32% of the United States landscaping market share in 2025, while design-build and hardscape services are projected to expand at an 8.35% CAGR through 2031.
- By application, residential demand accounted for 60.28% of the United States landscaping market size in 2025, whereas the commercial segment is forecasted to grow at a 7.06% CAGR through 2031.
- By market structure, the top five companies collectively held a minor share of the United States landscaping market in 2025, underscoring a highly fragmented competitive landscape.
Note: Market size and forecast figures in this report are generated using Mordor Intelligence’s proprietary estimation framework, updated with the latest available data and insights as of 2026.
United States Landscaping Market Trends and Insights
Drivers Impact Analysis*
| Driver | (~) % Impact on CAGR Forecast | Geographic Relevance | Impact Timeline |
|---|---|---|---|
| Surge in demand for lawn-care subscriptions | +0.9% | National, strongest in suburban districts | Medium term (2-4 years) |
| AI-driven estimation and robotic mowing adoption | +0.7% | High-labor-cost regions | Long term (≥ 4 years) |
| Growing commercial retrofits for Environmental, Social, and Governance (ESG) compliance | +0.6% | Major metropolitan areas | Medium term (2-4 years) |
| Expansion of outdoor living wellness spaces | +0.8% | Affluent residential clusters | Short term (≤ 2 years) |
| Post-pandemic housing starts and remodeling uptick | +0.6% | Sunbelt growth corridors | Short term (≤ 2 years) |
| Private Equity (PE)-backed roll-ups accelerating service coverage | +0.5% | Fragmented regional markets | Long term (≥ 4 years) |
| Source: Mordor Intelligence | |||
Surge in Demand for Lawn-Care Subscriptions
Subscription contracts now anchor revenue growth as households prioritize predictable budgeting and automated visit scheduling. Leading providers report that recurring agreements account for more than three-quarters of new residential bookings, elevating customer lifetime value and smoothing seasonal cash-flow swings. Bulk deals signed by homeowner associations further strengthen route density, lowering per-stop fuel expense and carbon footprint. Operators leverage dedicated mobile apps to send service reminders, upsell aeration, and collect digital payments, reinforcing retention. As suburban migration continues, this model supports the steady expansion of the United States landscaping market.
AI-Driven Estimation and Robotic Mowing Adoption
Autonomous mowers and cloud-based takeoff software are gaining traction among contractors seeking relief from persistent labor shortages. Commercial sites with large open turf areas see the fastest payback because a single robot can trim several acres daily with minimal supervision. AI sensors measure lot dimensions from drone images, generate precise material lists, and price bids within minutes, cutting the average estimation cycle by 65%. Training investments remain essential to ensure battery management and safety compliance, yet early adopters report margin lifts of 2-4 percentage points in their maintenance divisions.
Growing Commercial Retrofits for Environmental, Social, and Governance (ESG) Compliance
Corporate campuses and retail centers are converting water-intensive lawns into native, drought-tolerant landscapes to secure leadership in energy and environmental design (LEED) points and reduce irrigation bills [1]Source: US Green Building Council, “LEED v4.1 Building Design and Construction,” usgbc.org. Contractors that bundle smart-controller installation with regenerative planting command premium fees. Electric trimmers and blowers cut onsite emissions, helping facility owners show measurable Scope 1 reductions. Demand concentrates in gateway cities where large tenants are subject to public sustainability disclosures, bolstering long-term growth for the United States landscaping market [2]Source: California State Water Resources Control Board, “Making Conservation a California Way of Life,” waterboards.ca.gov.
Expansion of Outdoor Living Wellness Spaces
Homeowners continue to invest in meditation gardens, edible plantings, and shaded entertainment zones that integrate pergolas, lighting, and audio. The trend aligns with wellness spending and remote work preferences that elevate yard use throughout the week. Contractors partner with landscape architects to deliver turnkey designs, increasing project ticket sizes. Smart irrigation paired with moisture sensors maximizes plant health while meeting local watering rules, reinforcing consumer perception of value.
Restraints Impact Analysis*
| Restraint | (~) % Impact on CAGR Forecast | Geographic Relevance | Impact Timeline |
|---|---|---|---|
| Severe seasonal labor shortages (H-2B caps) | -1.0% | Nationwide, acute in northern states | Short term (≤ 2 years) |
| Rising fuel, fertilizer, and hardscape input costs | -0.7% | National; variable by logistics cost | Medium term (2-4 years) |
| Heightened drought regulation on irrigation use | -0.5% | Western United States | Long term (≥ 4 years) |
| Fragmented pricing pressure from gig platforms | -0.3% | Large urban centers | Medium term (2-4 years) |
| Source: Mordor Intelligence | |||
Severe Seasonal Labor Shortages (H-2B Caps)
Contractors requested 97,000 seasonal visas for 2025, yet secured fewer than 65,000 approvals, forcing many to curtail spring workloads. Higher overtime payments inflate wage bills and compress small-operator margins. Companies respond by cross-training crews and prioritizing high-value accounts, but unmet demand still suppresses potential revenue. Many firms implement referral bonuses to attract domestic hires, yet uptake remains limited because landscaping wages trail those of construction trades. As a result, project backlogs lengthen during peak growing weeks, resetting customer expectations and lowering service quality scores.
Heightened Drought Regulation on Irrigation Use
Statewide drought conditions affected 58% of California and Nevada in February 2025, underscoring the urgency of permanent conservation rules[3]Source: Drought.gov, “Western United States Drought Status February 2025,” drought.gov. Permanent California rules require many water agencies to trim supply up to 39% by 2040, with fines of USD 10,000 per day for non-compliance. Turf conversions and smart controllers mitigate penalties yet reduce recurring mowing revenue. Water agencies promote cash rebates for turf replacement, incentivizing property owners to accelerate conversions that bypass conventional maintenance contractors. Equipment manufacturers are pivoting toward drip-irrigation and micro-spray systems, giving early adopters a head start in bidding on drought-tolerant projects. Compliance reporting adds administrative overhead for contractors managing large municipal portfolios.
*Our forecasts treat driver/restraint impacts as directional, not additive. The impact forecasts reflect baseline growth, mix effects, and variable interactions.
Segment Analysis
By Service Type: Maintenance Dominates Recurring Revenue
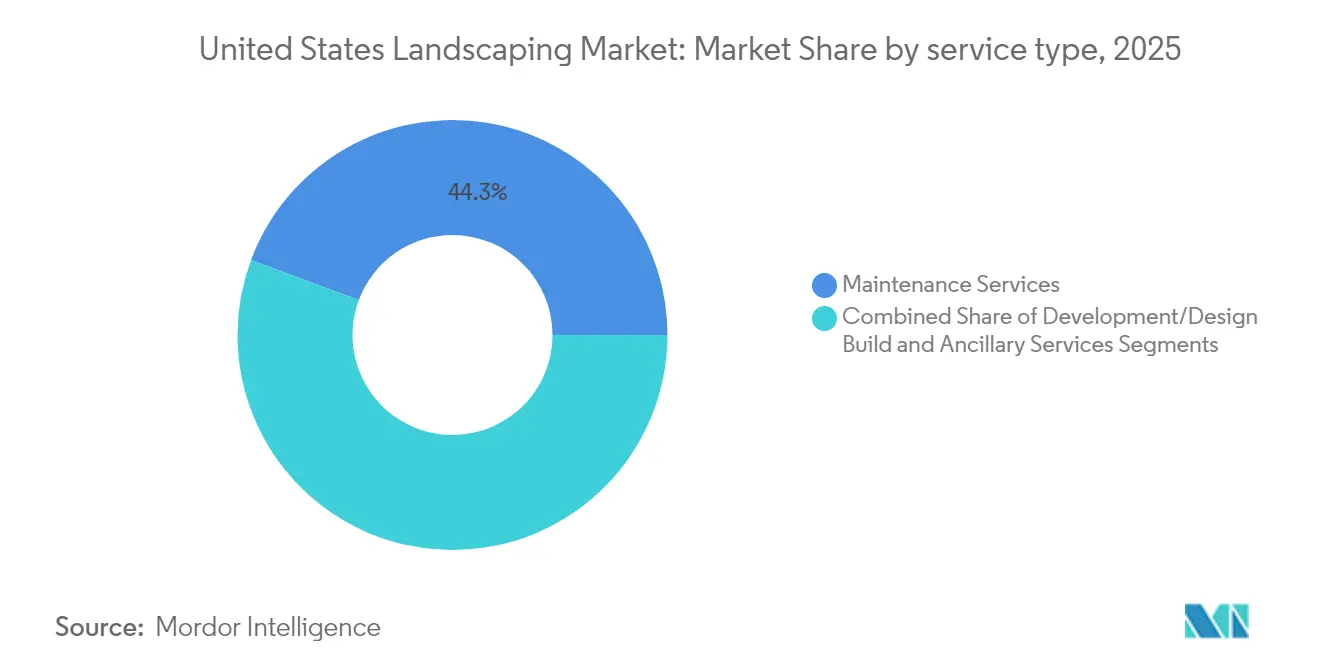
Maintenance generated the largest share of the United States landscaping market, accounting for 44.32% share in 2025, reflecting client preference for predictable, contract-based services that cover turf mowing, fertilization, and weed control. Fleet standardization and route optimization allow multi-regional providers to schedule dense stops and maximize crew utilization. Upselling soil-health assessments and smart-irrigation retrofits raise ticket size while deepening account stickiness. Design-build installs, ranging from patios to retaining walls, rank as the fastest-growing revenue pool with a CAGR of 8.35% in the forecast period, propelled by homeowner demand for multifunctional outdoor spaces.
Subscription maintenance models underpin stable cash flow and reduce customer acquisition costs. Fertilizer and weed-control programs command higher margins than basic mowing because licensing and chemical handling rules deter new entrants. Design-build remains cyclical, but benefits from elevated housing equity and commercial ESG retrofits. Niche services such as snow management and arboriculture add off-season earnings, further diversifying the United States landscaping market.



By Application: Residential Leads, Commercial Scales
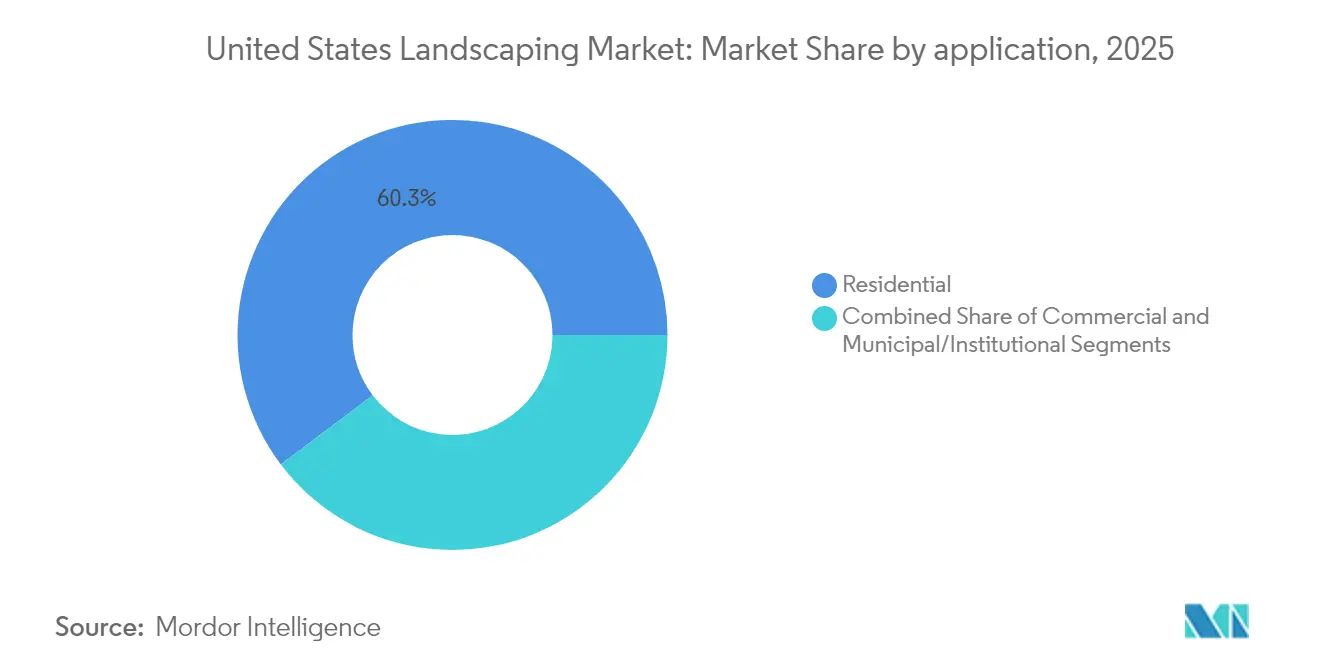
Residential properties represent the largest application segment, accounting for 60.28%, propelled by suburban migration and remote-work lifestyles that boost yard-use frequency. Homeowner associations contract multi-year packages for mowing, fertilizing, and shrub pruning, heightening route density. Commercial demand, while smaller in absolute terms, is advancing faster at a CAGR of 7.06% on the back of ESG-driven landscape upgrades and corporate office reopenings that stress amenity-rich exteriors.
Residential growth is reinforced by demographic trends favoring detached housing with generous lot sizes. Meanwhile, commercial clients pursue water-efficient plantings and electric equipment to hit carbon targets, rewarding contractors that invest in battery-powered fleets. Municipal and institutional contracts extend project pipelines but require compliance with public procurement statutes and prevailing-wage mandates, establishing a higher entry barrier yet furnishing recession-resilient revenue.
Geography Analysis
The United States landscaping market exhibits pronounced regional diversity, shaped by climate, migration patterns, and regulations. The Sunbelt states of Florida, Texas, and Arizona deliver the fastest growth, owing to year-round vegetation cycles, steady in-migration, and robust residential construction. Southeast operators experience high equipment utilization and lower snow-related downtime, which boosts their return on capital.
California is the largest single-state market, yet it confronts severe water constraints. Permanent conservation rules shift demand toward xeriscaping, smart-controller retrofits, and low-water turf alternatives, creating fresh niches even as traditional mowing revenue contracts. The Pacific Northwest, with its long growing season and ecological emphasis, prioritizes native restoration and stormwater management.
The Northeast commands premium pricing on maintenance owing to dense urban estates and high labor costs, though shorter growing seasons compress crew utilization. Midwestern markets exhibit balanced seasonality, offering strong summer revenue but necessitating snow-removal diversification. Across all regions, widespread suburbanization sustains the expansion of the United States landscaping market as homeowners value outdoor space for recreation and wellness.
Regulatory Landscape
The United States landscaping market operates under a multi-layer regulatory framework spanning pesticide use, worker safety, and water conservation. The US Environmental Protection Agency (EPA) regulates pesticide labeling, sale, and use under the Federal Insecticide, Fungicide, and Rodenticide Act (FIFRA), which shapes fertilization and weed-control programs where applicator training and compliant handling are required. For pesticide applications that result in point source discharges to waters of the United States, the EPA National Pollutant Discharge Elimination System (NPDES) Pesticide General Permit (PGP) framework applies, with the 2026 PGP scheduled to become effective on October 31, 2026, replacing the 2021 permit and setting documentation and operating practices for applicable spray activities.
Labor and jobsite safety compliance is covered by the Occupational Safety and Health Administration (OSHA), which regulates landscaping and horticultural services (NAICS 561730) through general industry standards for maintenance activity and construction standards for building activity. These rules address hazards common to crews, including equipment operation and exposure risks. OSHA also maintains a Regional Emphasis Program (REP) focused on reducing workplace fatalities and injuries in landscaping, with the current program expiring on September 30, 2026 unless extended, which puts pressure on both national and local contractors to maintain documented training and jobsite safety controls.
Competitive Landscape
The top five firms control only a minor share of the United States landscaping market, confirming a fragmented environment ripe for roll-ups. BrightView Holdings leverages a nationwide branch network and an integrated service platform that enables the firm to capture large commercial contracts across office parks, educational campuses, and sports venues. TruGreen anchors its leadership in the residential arena through a subscription model supported by data-driven lawn diagnostics and a robust call-center infrastructure that ensures rapid customer onboarding. Both organizations utilize proprietary software to optimize crew routing, monitor equipment uptime, and track site-level performance in real-time. Their scale gives them preferred access to fleet discounts and early trials of autonomous mowing technology, reinforcing cost advantages against local independents.
SavATree has built strong brand recognition in premium tree and plant health care by combining certified arborists with a concierge-style client experience that appeals to high-end property owners. U.S. Lawns operates a franchise model that delivers standardized maintenance protocols to multi-site commercial customers, ensuring uniform service quality across diverse geographies. The Davey Tree Expert Company differentiates through employee ownership and a century-long heritage in scientific arboriculture, which supports long-term municipal and utility contracts. Each of these players supplements core maintenance work with specialized services such as storm damage response, irrigation audits, and ecological restoration to deepen wallet share.
Collectively, the top five companies are expanding their footprint through tuck-in acquisitions, joint ventures, and greenfield branch openings in high-growth Sunbelt metropolitan areas. They continue to invest in battery-powered equipment and fleet telematics to meet noise ordinances and sustainability mandates imposed by corporate and municipal clients. Strategic partnerships with robotics manufacturers accelerate the pilot deployment of autonomous mowing units, which help offset chronic labor shortages. Data analytics platforms further integrate customer portals, asset tracking, and predictive maintenance, enabling these leaders to standardize service delivery as they scale.
United States Landscaping Industry Leaders
BrightView Holdings
TruGreen Inc. (TruGreen Holding Corporation)
The Davey Tree Expert Company
The F.A. Bartlett Tree Expert Company
Yellowstone Landscape (Harvest Partners)
- *Disclaimer: Major Players sorted in no particular order

Market Opportunities and Future Outlook
Technology adoption is creating a visible gap in estimating, scheduling, and on-site productivity, particularly as labor availability remains constrained. In June 2026, Lawn & Landscape reported that 73% of surveyed landscaping professionals rely on technology more than they did five years ago, which supports demand for integrated workflows that connect digital quoting, routing, and customer communications. Commercial autonomous mowing is moving beyond pilots as suppliers expand wire-free capability, with Kress introducing its EyePilot line of commercial autonomous mowers in July 2026 using AI computer vision and RTK positioning to reduce crew hours on large turf sites while keeping service frequency consistent.
Sustainability-linked commercial work and water-efficiency retrofits are also generating higher-value service lanes next to traditional mowing. Contractors that bundle drought-tolerant planting, irrigation audits, and smart-controller retrofits can target projects tied to conservation and ESG requirements, while maintaining recurring revenue through monitoring and seasonal adjustments. Consolidation and platform-building leave space for specialists in irrigation optimization, robotics support, and digital job-costing services to partner with fragmented local operators, especially in metro markets where commercial clients seek proof-based reporting through customer portals.
Recent Industry Developments
- May 2026: The Davey Tree Expert Company, through its Hartney Greymont division, acquired Green Trees Arborcare in Wrentham, Massachusetts. The deal expands Davey’s presence in a high-value regional tree care market and strengthens its ability to serve premium residential and commercial accounts with specialized arboriculture capabilities.
- April 2026: TruGreen announced a multi-year extension of its official marketing partnership with the PGA TOUR, PGA TOUR Champions, and the TPC Network through 2029. The extension reinforces brand reach and customer acquisition leverage in the residential lawn-care segment, where subscription renewals and seasonal upsells depend on sustained consumer awareness.
- April 2025: California Department of Water Resources announced a program to partner with local communities on tree and landscape replacement projects aimed at saving water and addressing drought impacts. This supports demand for turf replacement, drought-tolerant design-build work, and smart irrigation upgrades, shifting contractor mix toward water-efficient retrofits in water-constrained areas.


Research Methodology Framework and Report Scope
Market Definition and Coverage
For this study, the United States landscaping market is defined as the annual revenue earned from professional services that design, install, maintain, and enhance outdoor spaces across residential, commercial, municipal, and institutional properties.
Scope exclusions: We exclude DIY retail sales of plants and garden supplies, outdoor furniture, and standalone equipment sales that are not sold as part of a service.
Segmentation Overview
- By Service Type
- Maintenance Services
- Turf mowing
- Fertilization and weed control
- Development/Design-Build Services
- Hardscaping
- Soft-scaping
- Ancillary Services
- Snow and ice management
- Tree care and arborist
- Maintenance Services
- By Application
- Residential
- Commercial
- Municipal/Institutional
Data Sources, Market Sizing, and Validation
Desk Research
Desk research started with public datasets that anchor the size and direction of landscaping services in the US. Sources used included US Census Bureau business statistics, Bureau of Labor Statistics employment and wage series, Bureau of Economic Analysis personal consumption and price data, and Federal Reserve economic indicators, which help us track the spending climate that supports landscaping demand.
We also reviewed industry and technical references, such as the National Association of Landscape Professionals, USDA and land-grant university extension publications, and EPA water-related guidance that can influence irrigation practices, to understand common service bundles and key cost drivers. Company filings, investor presentations, and reputable press coverage were used to cross-check shifts in the revenue mix, and a paid subscription for company financials, news, and patent databases helped confirm broader investment themes without relying on a single dataset. The sources listed here are illustrative only, and many other references were used for data collection, validation, and clarification during the work.
Primary Interviews and Surveys
Primary interviews focused on validating what customers buy and how contractors bill for it, since local pricing and labor availability can shift quickly. We spoke with contractors, regional operators, distributors, property managers, and procurement leads across major US climates to pressure-test assumptions on contract frequency, seasonal add-ons (including snow-related work), and typical attachment rates for enhancement services.
Distribution of primary research fieldwork respondents
| Company type | Respondent position |
|---|---|
| Top tier: 26% | CXOs: 13% |
| Mid tier: 56% | Functional/Unit leaders: 34% |
| Smaller Players: 18% | Managers: 53% |
Market-Sizing & Forecasting
Sizing started from a top-down build where business census counts and employment levels are translated into service revenue pools through productivity and wage-normalized revenue per worker, then adjusted for contract intensity across residential and commercial properties. The model is corroborated with selective bottom-up checks using sampled price-per-visit and contract values multiplied by typical annual service frequency, followed by reality checks from channel conversations and operator revenue ranges.
Inputs that mattered most included landscaping service employment and wage inflation, the number of employer establishments and self-employed intensity, housing turnover and remodeling activity signals, commercial property maintenance spend tendencies, and weather-driven seasonality that changes the mix between maintenance, enhancements, irrigation work, and snow services. For gaps where smaller operators do not report detailed mixes, we applied conservative service-share splits informed by interview ranges and then tested sensitivity so totals do not overreact to one assumption.
Forecasts were produced using scenario analysis that links demand to macro indicators such as disposable income, housing and commercial activity, labor cost pressure, and climate-related service needs, and then refined using expert expectations on price pass-through and contract retention. When the forecast path looked too steep or too flat, we revisited service frequency and pricing ladders first, because those typically explain most of the change in this market.
Data Validation & Update Cycle
Before sign-off, results are cross-checked against independent signals, including employment trends, observed pricing movement, and known seasonality patterns that should show up in quarterly revenue flow. Outliers are flagged and reviewed in more than one analyst pass, and follow-up calls are triggered when a variance cannot be explained by a documented driver.
The study is refreshed annually, with interim updates made when material events occur, such as sharp labor cost changes, unusual weather seasons, or regulatory shifts that affect service delivery. Right before delivery, a final review is completed so clients receive the latest updated view with consistent assumptions across history and forecast.
Mordor Intelligence's United States Landscaping Market Size Versus Other Published Estimates
It is normal to see different market values for US landscaping because publishers do not always count the same revenue streams, and they also choose different timing for price updates. Differences can also come from how small contractor activity is treated, and whether snow and enhancement work are bundled into the same total.
Some published figures stay closer to a narrow industry-code view or rely on older revenue tables without reworking the current mix between maintenance, installation, enhancements, and snow work. Those totals may also apply broad growth rates without rechecking labor-driven price progression and contract retention. For Mordor Intelligence, the number includes delivered landscaping services, and it keeps DIY retail garden sales and standalone equipment transactions outside scope.
Benchmark comparison
| Source | Market Size | Gaps in Research Methodology |
|---|---|---|
| Mordor Intelligence | USD 196.16 B (2026) | |
| Industry Database A | USD 176.70 B (2026) | Often aligned to a narrower industry revenue definition that can undercount enhancement work, irrigation-related service revenue, and certain bundled outdoor services, and it may lag fast price resets tied to labor costs. |
| Trade Journal B | USD 188.80 B (2026) | Commonly blends landscaping with lawn-care statistics using mixed source years, and it can apply simple growth rates without reconciling seasonal services and contract frequency shifts. |
The spread in values mainly comes from what is treated as in-scope service revenue and how quickly pricing and mix are refreshed. Our checks use repeatable demand and labor signals, and interview re-contacts are triggered when a service mix assumption seems too optimistic or too conservative, which helps keep the total explainable.


Key Questions Answered in the Report
What is the United States landscaping market size in 2026?
The United States landscaping market size stands at USD 196.16 billion in 2026.
How fast is the market anticipated to grow?
It is forecast to expand at a 5.46% CAGR, reaching USD 255.74 billion by 2031.
Which service segment holds the largest share?
Maintenance services lead, capturing 44.32% of revenue thanks to their subscription-based, recurring nature.
Why are labor shortages a recurring problem?
Seasonal demand exceeds the annual H-2B visa cap, leaving many firms unable to hire enough temporary workers during peak months.
How are drought regulations affecting landscaping companies?
Permanent water-use restrictions in Western states are shifting demand toward xeriscaping and smart-irrigation retrofits, reducing traditional turf-maintenance revenue but opening new service niches.
Why is private equity interested in the sector?
Predictable cash flow from subscription contracts, recession resilience, and abundant acquisition targets make landscaping services attractive for roll-up strategies and operational.
Page last updated on:


 Your data is secure and never sold or shared.


