
Oxycodone Drugs Market Size and Share
Market Overview
| Study Period | 2022 - 2031 |
|---|---|
| Market Size (2026) | USD 5.99 Billion |
| Market Size (2031) | USD 7.69 Billion |
| Growth Rate (2026 - 2031) | 5.12 % |
| Fastest Growing Market | Asia Pacific |
| Largest Market | North America |
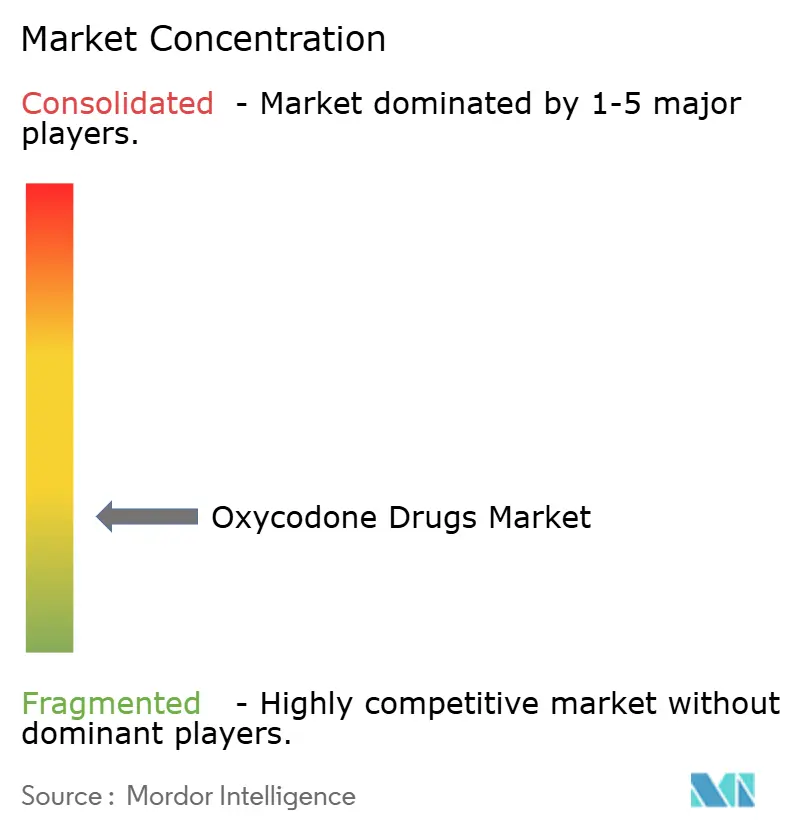
| Market Concentration | Low |
Major Players *Disclaimer: Major Players sorted in no particular order Image © Mordor Intelligence. Reuse requires attribution under CC BY 4.0. | |
Oxycodone Drugs Market Analysis by Mordor Intelligence
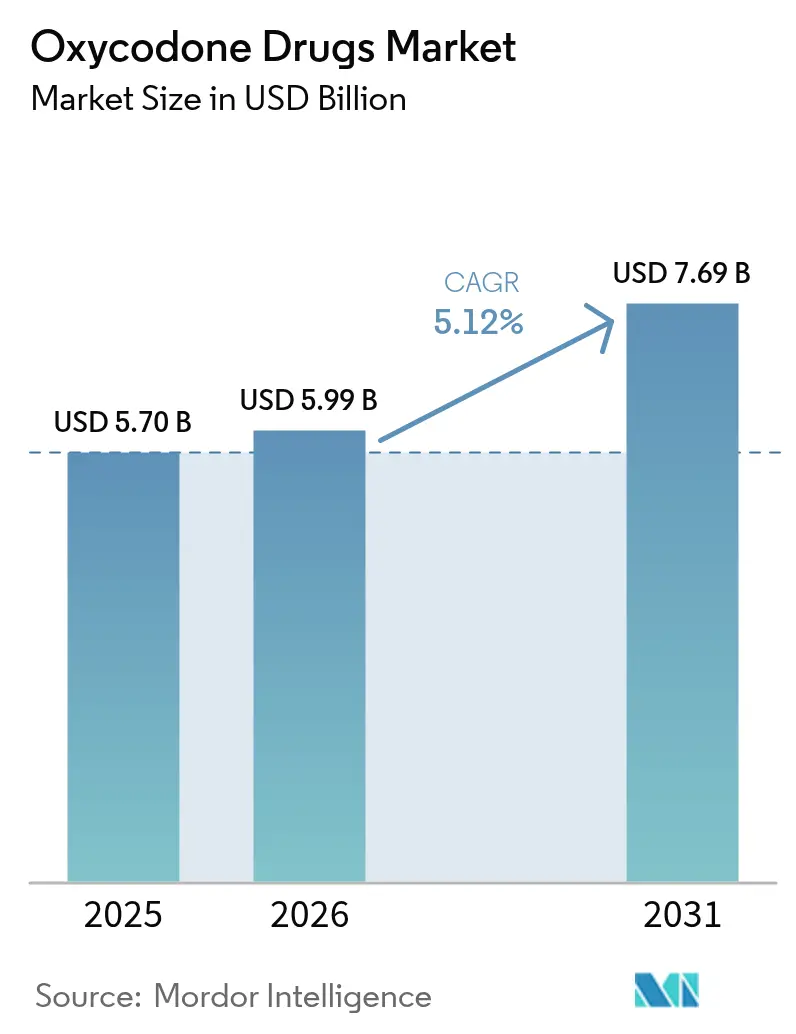
The oxycodone market size was valued at USD 5.70 billion in 2025 and estimated to grow from USD 5.99 billion in 2026 to reach USD 7.69 billion by 2031, at a CAGR of 5.12% during the forecast period (2026-2031). The controlled growth path highlights a shift from volume-driven expansion toward value capture through abuse-deterrent technologies and close regulatory alignment. Manufacturers that invest in tamper-resistant science gain faster Food and Drug Administration (FDA) reviews, price premiums, and formulary access, tilting competitive dynamics toward innovation-focused players fda.gov. Litigation pressures have also re-shaped corporate strategy, driving mergers that create scale for both research pipelines and settlement reserves. Geographic concentration remains tilted toward the United States, where established prescription-monitoring programs, broad insurance coverage, and large post-settlement compliance budgets sustain the oxycodone market even as per-capita opioid utilization falls. Meanwhile, expanding healthcare access and rising surgical volumes in India and Southeast Asia pull fresh demand into the oxycodone market through 2030.
Key Report Takeaways
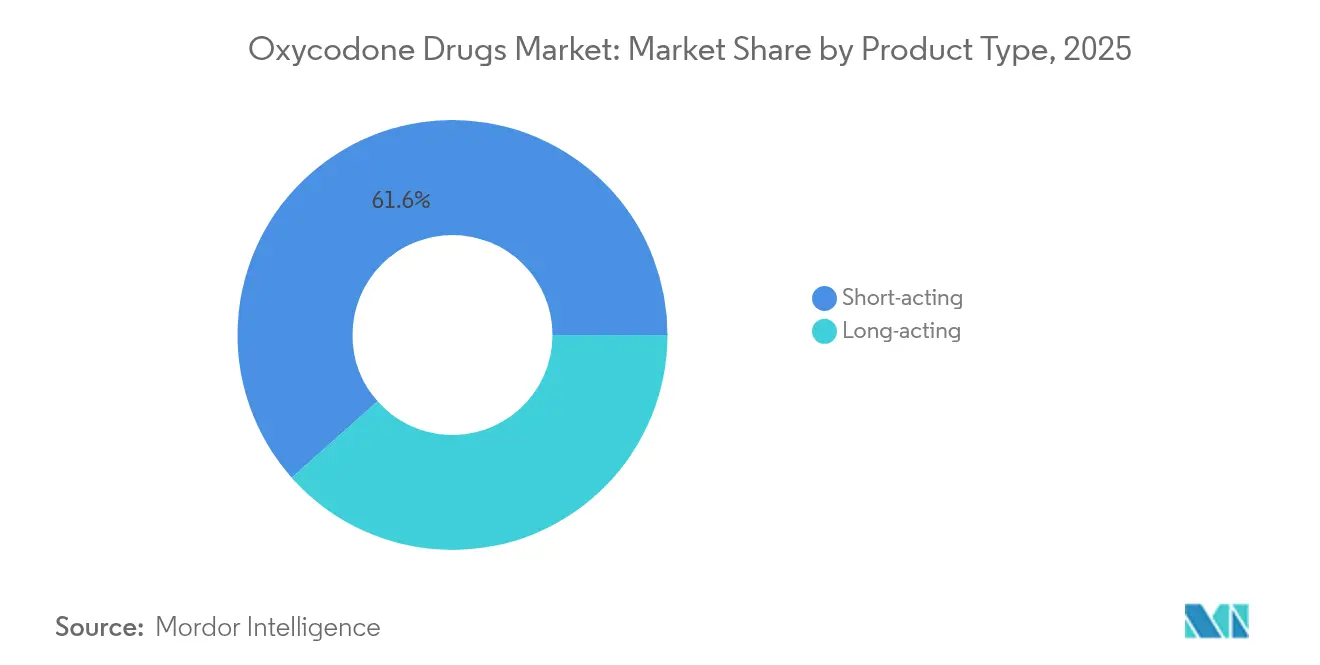
- By product type, short-acting formulations led with 61.55% of oxycodone market share in 2025, while long-acting variants are projected to grow at a 5.58% CAGR to 2031.
- By formulation, immediate-release products captured 53.68% of the oxycodone market size in 2025; extended-release formats are advancing at a 5.99% CAGR through 2031.
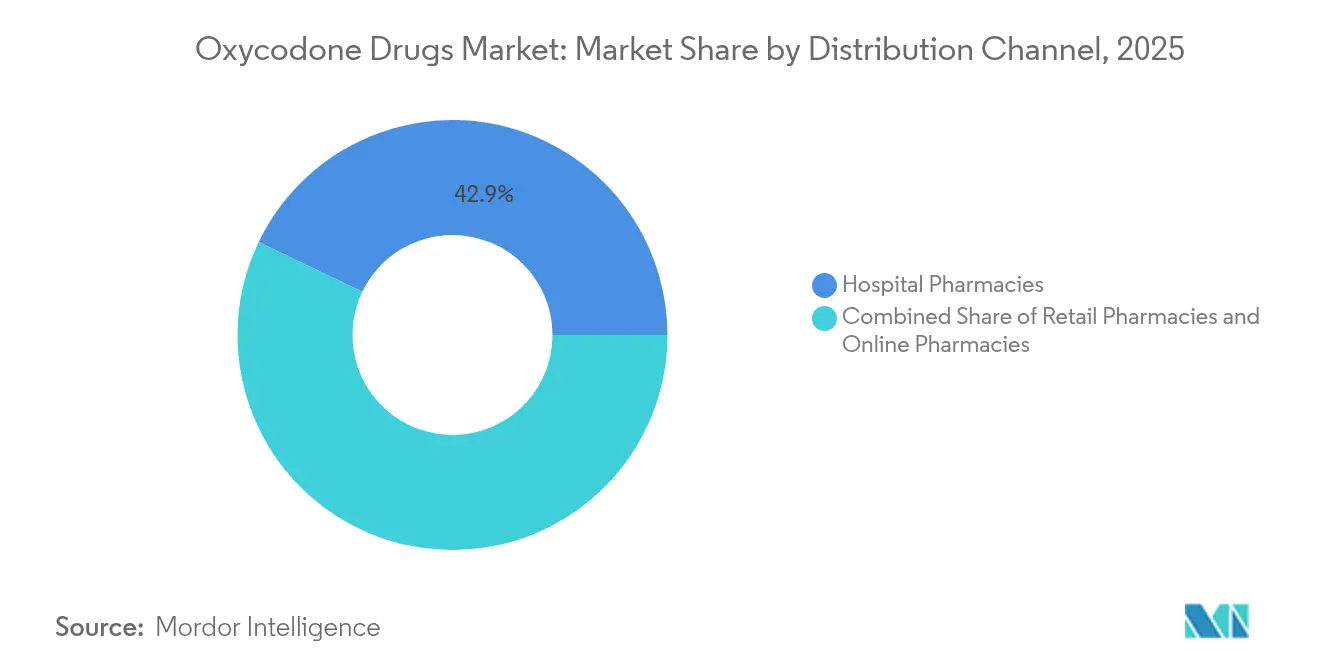
- By distribution channel, hospital pharmacies commanded 42.88% of 2025 revenue, but online pharmacies are expanding at a 6.21% CAGR to 2031.
- By geography, North America dominated with a 43.95% oxycodone market share in 2025; Asia-Pacific records the fastest regional CAGR at 6.78% to 2031.
Note: Market size and forecast figures in this report are generated using Mordor Intelligence’s proprietary estimation framework, updated with the latest available data and insights as of 2026.
Market Trends and Insights
Drivers Impact Analysis of Oxycodone Drugs Market*
| Driver | (~) % Impact on CAGR Forecast | Geographic Relevance | Impact Timeline |
|---|---|---|---|
| Rising Investments In R&D & Clinical Trials | +1.2% | Global, concentrated in North America & Europe | Medium term (2-4 years) |
| Expedited FDA Pathway For Abuse-Deterrent Formulations | +0.8% | North America, spillover to regulated markets | Short term (≤ 2 years) |
| Growing Prevalence Of Chronic & Cancer-Related Pain | +1.5% | Global, aging populations in developed markets | Long term (≥ 4 years) |
| Patent-Expiry Driven Generic Cost Advantage In Emerging Markets | +0.9% | Asia-Pacific, Latin America, MEA | Medium term (2-4 years) |
| Tele-Prescribing Expansion After 2024 US Federal Waiver | +0.6% | North America, early adoption in Europe | Short term (≤ 2 years) |
| Adoption Of Digital-Pill Adherence Platforms With ADF Brands | +0.4% | North America & EU, pilot programs in APAC | Medium term (2-4 years) |
| Source: Mordor Intelligence | |||
Rising Investments in R&D & Clinical Trials
Federal and philanthropic funding accelerated sharply in 2024, with the U.S. National Institutes of Health committing USD 3.9 billion to non-addictive pain research under the HEAL Initiative [1]National Institutes of Health, “HEAL Initiative Funding Overview,” nih.gov. Grants such as Ensysce Biosciences’ USD 5.3 million award and Tris Pharma’s USD 16.6 million grant sharpened the innovation race within the oxycodone market. Companies able to funnel these resources into Phase 2 and Phase 3 studies secure faster regulatory conversations and partnership interest, compressing the time needed to pivot from early science to commercial launch. The funding tide also forces incumbents to protect share by adding novel abuse-deterrent features, raising baseline R&D spend across the oxycodone market. A visible outcome is the pipeline clustering around tamper-resistant coatings, combination devices, and digital adherence platforms.
Expedited FDA Pathway for Abuse-Deterrent Formulations
The FDA’s streamlined review for abuse-deterrent platforms has become a gating mechanism for competitive entry. Collegium Pharmaceutical’s RoxyBond approval, achieved through SentryBond technology, demonstrated that tamper-resistance evidence can substitute for traditional bioequivalence data, cutting months from the review schedule. Fast-track access supports premium list prices because payers weigh offsetting costs of diversion and overdose. The oxycodone market therefore rewards manufacturers that produce hard-to-crush tablets, physical-chemical barriers, or prodrug strategies. Firms without these capabilities face dwindling formulary acceptance, raising the likelihood of exit or acquisition.
Growing Prevalence of Chronic & Cancer-Related Pain
CDC reporting shows chronic pain incidence in U.S. adults climbed to 24.3% in 2024, a multi-point increase over 2021 levels [2]Centers for Disease Control and Prevention, “Chronic Pain in U.S. Adults, 2024,” cdc.gov . Oncology protocols now embed long-acting oxycodone as standard for moderate-to-severe pain, driving rapid uptake of extended-release variants inside the oxycodone market. Demographic aging amplifies the trend: baby boomers have entered their high-pain years, and orthopedic interventions continue rising. Hospital formularies respond by specifying multimodal regimens that blend opioids with physiotherapy and behavioral therapy, creating fresh opportunities for dual-delivery patches and connected dosing devices that track adherence.
Patent-Expiry Driven Generic Cost Advantage in Emerging Markets
A wave of key patent expirations has opened the oxycodone market to low-cost producers, particularly in India and Brazil. Generic firms leverage contract manufacturing agreements to underprice branded drugs by upwards of 70%, spurring volume growth in public health systems. While gross margins compress, overall market value is sustained by newly addressable patient pools that previously lacked access. For Western innovators, the shift underlines the future importance of life-cycle extensions—most notably fixed-dose combos and abuse-deterrent coatings—to preserve revenue streams against generic encroachment.
Restraints Impact Analysis of Oxycodone Drugs Market*
| Restraint | (~) % Impact on CAGR Forecast | Geographic Relevance | Impact Timeline |
|---|---|---|---|
| High Addiction, Overdose & Litigation Risk Profile | -1.8% | Global, most severe in North America | Long term (≥ 4 years) |
| Multi-Jurisdictional Regulatory Hurdles & REMS Burden | -1.1% | Global, complex in federated systems | Medium term (2-4 years) |
| Escalating State-Level MME Prescription Caps | -0.7% | North America, spreading to other regions | Short term (≤ 2 years) |
| DEA Annual Quota Volatility Disrupting API Supply | -0.6% | Global supply chains, US manufacturing base | Short term (≤ 2 years) |
| Source: Mordor Intelligence | |||
High Addiction, Overdose & Litigation Risk Profile
Cumulative opioid settlements have crossed USD 57.1 billion, with the Purdue Pharma bankruptcy package alone amounting to USD 7.4 billion [3]U.S. Department of Justice, “Purdue Pharma Settlement Information,” justice.gov . Escalating liability has redrawn risk models inside the oxycodone market, lifting insurance premiums and constraining promotional activity. Physicians restrict prescribing volumes out of malpractice anxiety, and hospital boards adopt stringent stewardship rules that favor non-opioid modalities when clinically acceptable. Investor sentiment inherently discounts opioid portfolios, raising capital costs for small entrants and nudging the landscape toward large, diversified incumbents capable of maintaining multibillion-dollar litigation escrows.
Multi-Jurisdictional Regulatory Hurdles & REMS Burden
Risk Evaluation and Mitigation Strategies compel producers to run prescriber training, patient education, and distribution audits. Each additional market multiplies the administrative load, which now demands specialized compliance units embedded within commercial functions. Smaller firms often lack the infrastructure to handle separate e-prescribing databases, prescription caps, and patient registries, effectively granting scale advantages to global companies. For the oxycodone industry, these overlapping rules extend launch timelines and choke early-stage cash flow, dampening otherwise strong demand fundamentals in new territories.
*Our forecasts treat driver/restraint impacts as directional, not additive. The impact forecasts reflect baseline growth, mix effects, and variable interactions.
Oxycodone Drugs Market Segment Analysis
By Product Type:
Short-Acting Dominance amid Long-Acting InnovationShort-acting formulations captured 61.55% of oxycodone market share in 2025, underscoring their entrenched role in emergency settings and post-operative care. Their rapid onset and dosing flexibility fit acute applications, and budget-constrained hospitals continue to rely on these generics for first-line pain relief. However, the long-acting category is expanding at a 5.58% CAGR as physicians favor around-the-clock coverage for chronic and cancer pain. Within this context, the oxycodone market evolves toward differentiated delivery profiles that blunt peak-trough swings and reduce rescue-dose requirements.
Adjacently, the long-acting segment gains from parallel abuse-deterrent advancements. Extended-release cores embedded with polymer matrices or ion-exchange resins obstruct crushing and solvent extraction, addressing diversion concerns. Health plans recognize the public-health value and reimburse at higher tiers, reinforcing the shift. As regulatory caps on total morphine milligram equivalents tighten, practitioners lean on potent, longer-acting tablets to stay within dosing ceilings while still meeting analgesic targets. Consequently, short-acting incumbents must either bolt on deterrent coatings or risk volume erosion.



By Formulation Type:
Abuse-Deterrent Technologies Reshape CompetitionImmediate-release formats held 53.68% of the oxycodone market size in 2025, but the growth spotlight rests on extended-release lines clocking a 5.99% CAGR through 2031. Abuse-deterrent formulations, though starting from a smaller base, represent the fastest-moving slice of the oxycodone market because the FDA’s streamlined pathway endorses their public-health benefits. Tamper-resistant layers, hot-melt extrusions, and prodrugs that activate only gastrointestinally discourage inhalation or injection, aligning with payer strategies to curb misuse.
Digital pill systems augment these deterrents by logging ingestion events via micro-sensors transmitted to cloud dashboards. Early adopters such as PatchRx integrate adherence data into electronic health records, giving clinicians real-time visibility. The convergence of pharmaceutical chemistry with remote monitoring redefines value: manufacturers monetize not just tablets but also data services, maintenance contracts, and analytic dashboards. Such bundled offerings raise switching costs and differentiate portfolios beyond the reach of generic rivals.
By Distribution Channel:
Online Growth Challenges Traditional Pharmacy ModelsHospital pharmacies owned 42.88% of revenue in 2025, reflecting embedded stewardship committees and onsite dispensing linked to surgery volumes. Yet online pharmacies are sprinting at a 6.21% CAGR, catalyzed by 2024 federal telehealth waivers that permit remote prescribing. Platform operators invest heavily in identity verification, geofenced delivery, and electronic prescription of controlled substances (EPCS) systems to stay ahead of regulatory scrutiny, thereby carving a logistical moat.
Retail outlets, already hemmed in by reimbursement pressure, saw net closures of 2,202 locations between 2020 and 2024. Consolidation forces patients to seek convenience elsewhere, and subscription-based online refills resonate with chronic-pain cohorts. For the oxycodone market, channel dynamics imply higher direct-to-patient engagement, wider geographic reach, and increasingly data-rich fulfillment records that feed compliance analytics.
Geography Analysis
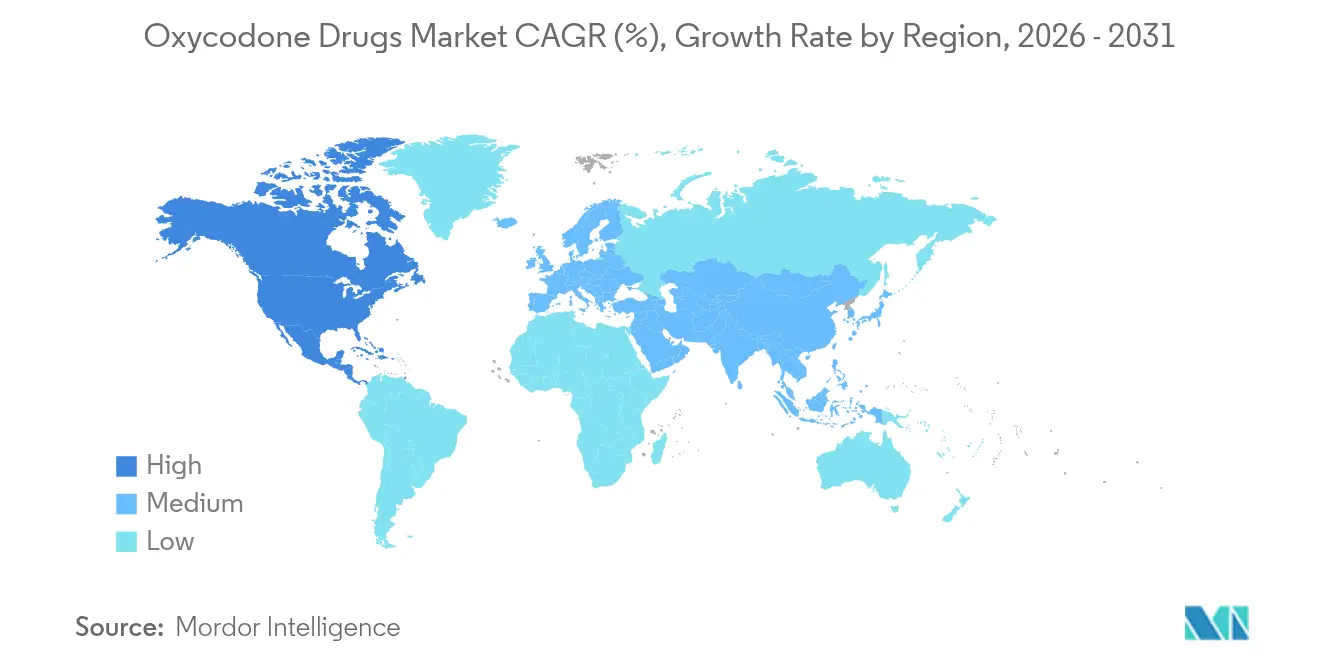
North America Oxycodone Drugs Market
North America remained the anchor of the oxycodone market in 2025, contributing 43.95% of global revenue. The combination of electronic prescription monitoring programs, mature litigation frameworks, and stable third-party reimbursement undergirds market resilience even as per-capita dosing falls. State-level morphine-milligram equivalent caps such as Alabama’s 120 MME and Maine’s 100 MME ceilings add complexity but also spur demand for potent, extended-release formulations that deliver higher analgesic intensity per unit. Payers continue to absorb premium prices for abuse-deterrent lines, arguing that reduced diversion offsets higher acquisition cost.
APAC Oxycodone Drugs Market
Asia-Pacific exhibits the fastest regional expansion, posting a 6.78% CAGR. India’s public-sector hospital investments and the rollout of Ayushman Bharat insurance expand prescription volumes. In parallel, patent expirations supply local manufacturers with open pathways into the oxycodone market, lowering unit prices and accelerating adoption. Southeast Asian health ministries publish updated pain management guidelines that formally endorse WHO Step III opioids, broadening prescriber confidence.
Europe Oxycodone Drugs Market
Europe remains a middle-growth territory. National health services enforce conservative opioid utilization policies, guided by EMA advisories that caution against overreliance. Even so, aging demographics and rising oncology incidence ensure a steady base of chronic-pain patients. Extended-release oxycodone attains formulary preference due to lower dosing frequency, which supports outpatient management efficiency. The market complexity stems from country-specific reimbursement dossiers and parallel import rules that require careful pricing choreography.
LATAM and MEA Oxycodone Drugs Market
Latin America and the Middle East & Africa trail in share but display pockets of high momentum where private insurance penetration is rising. Regulatory harmonization programs under Mercosur and the Gulf Cooperation Council modestly reduce approval times, improving regional accessibility. However, supply-chain fragility and fluctuating currency exchange rates impose planning challenges for multinational producers.

Regulatory Landscape
Regulation of oxycodone finished-dose medicines remains centered on controlled-substance scheduling, quota controls, and post-market risk governance. In the United States, the Drug Enforcement Administration (DEA) sets yearly Aggregate Production Quotas (APQs) that constrain Schedule II manufacturing. The 2026 APQ for oxycodone (for sale) was established effective January 5, 2026 at 50,237,652 grams, so quota allocation and any mid-year adjustments remain a primary lever for supply availability.
Safety and use conditions continue to tighten through labeling and pharmacovigilance actions. In July 2025, the US Food and Drug Administration (FDA) required major class-wide opioid labeling changes to emphasize risks associated with long-term use, reinforcing payer and provider stewardship requirements aligned with REMS expectations. In Europe, the European Medicines Agency (EMA) advanced periodic safety update assessments (PSUSA) for oxycodone and for oxycodone hydrochloride plus paracetamol during 2025, driving product information variations across nationally authorized products and adding ongoing compliance work for multi-country portfolios.
Value Chain Analysis
The oxycodone value chain begins upstream with regulated narcotic raw materials and controlled-substance synthesis. Production typically originates from thebaine (from poppy straw), which is converted through key intermediates to oxycodone base and then to oxycodone hydrochloride API, followed by formulation into immediate-release, extended-release, and abuse-deterrent formats, packaging, and controlled distribution. Quality control and process constraints are stringent, including tight impurity specifications referenced in regulatory expectations (for example, limits on 14-hydroxycodeinone), which raises the need for specialized analytical capability and compliant manufacturing systems.
Downstream, finished-dose supply moves through wholesalers into hospital, retail, and online pharmacies under enhanced controls (EPCS, auditing, and diversion prevention). In the United States, the DEA quota system is a structural choke point across the chain, since manufacturers must obtain manufacturing quota and procurement quota approvals. Quota volatility can affect API-to-finished-dose planning and inventory positioning, and operational modernization is also feeding into chain management as the DEA moved in 2026 to revise how manufacturing and procurement quota applications are managed, including digitization of key processes, which can change the speed and transparency of quota administration for controlled-substance producers.
Competitive Landscape
The oxycodone market shows moderate consolidation as capital requirements for litigation funds, risk-management teams, and R&D escalate. Mallinckrodt and Endo’s USD 6.7 billion merger in 2024 strengthened vertical integration from active pharmaceutical ingredient (API) production to finished-dose packaging, allowing combined leverage across hospital group purchasing contracts. Comparable tie-ups are expected as scale increasingly equates to regulatory survivability.
Product-level differentiation gravitates toward proprietary abuse-deterrent technologies. Collegium Pharmaceutical’s DETERx system interlaces oxycodone with fatty-acid waxes that limit grindability, securing hospital protocol endorsements. Amneal and Sun Pharmaceutical plug cost gaps with efficient generic capacity but now invest in second-generation deterrent coatings to stay relevant. Digital health alliances mark the next competitive fault line: DrFirst-PatchRx data integration offers prescribers dosage adherence dashboards, creating a wraparound service layer that pure-play generic firms struggle to match.
Intellectual-property strategy shifts from primary molecule patents to formulation, device, and software claims. Companies actively pursue dual-IP positions that shield both the chemical barrier and the digital companion app, effectively fencing off generic copies until at least 2035. Parallelly, API sourcing recalibrates as the U.S. Drug Enforcement Administration revises annual production quotas, prompting firms to lock in multi-year contracts with redundant suppliers to guard against shortages.
By 2030, competitive equilibrium is likely to hinge on a triad—tamper-resistant chemistry, real-time monitoring, and broad litigation shields. Entrants that lack any one of these pillars may find reimbursement discussions difficult and financing channels expensive, perpetuating the consolidation momentum across the oxycodone industry.
Oxycodone Drugs Industry Leaders
Teva Pharmaceutical Industries Ltd
Sun Pharmaceutical Industries Ltd
Endo Pharmaceuticals Inc
Collegium Pharmaceutical Inc
Mallinckrodt Pharmaceuticals
- *Disclaimer: Major Players sorted in no particular order
Oxycodone Drugs Market Companies Covered in this Report
- Purdue Pharma
- Teva Pharmaceutical Industries
- Collegium Pharmaceutical
- Endo International
- Mallinckrodt Pharmaceuticals / SpecGx
- Sun Pharmaceuticals Industries
- Amneal Pharmaceuticals
- Hikma Pharmaceuticals
- Lupin
- Rhodes Pharmaceuticals L.P.
- KVK-Tech Inc.
- Alvogen / Almatica
- Mundipharma International Ltd.
- Assertio
- Pfizer
- Apotex
- ANI Pharmaceuticals Inc.
- SpecGx LLC

Market Opportunities and Future Outlook
A near-term opportunity sits at the intersection of regulated access and better risk controls, particularly where policy bodies encourage balanced controlled-medicine frameworks. WHO published a comprehensive guideline report in September 2025 to help countries ensure safe and equitable access to controlled medicines while minimizing harms, which creates whitespace for manufacturers and distributors that can provide compliant supply, prescriber education, and monitoring-support services alongside product portfolios. FDA-mandated opioid labeling updates in July 2025 also reinforce the demand for clearer risk communication and evidence packages around long-term use, supporting differentiation for brands and generics that invest in robust labeling readiness, REMS operations, and abuse-deterrent science.
Supply resilience is another active opportunity area as shortages and discontinuations reshape sourcing decisions and channel strategies. US shortage listings and manufacturer actions around oxycodone-containing products, including discontinued presentations of acetaminophen/oxycodone combinations, heighten buyer focus on redundant suppliers, contingency inventory, and quota planning discipline for Schedule II products. Companies that can align DEA quota strategy with high-compliance distribution, including hospital systems and tightly controlled online dispensing, have a practical path to win contracts when providers prioritize continuity of care and auditable fulfillment for moderate-to-severe pain management.
Recent Industry Developments in Oxycodone Drugs Market
- January 2026: The US Drug Enforcement Administration (DEA) set the 2026 Aggregate Production Quotas for Schedule I and II controlled substances, including an initial oxycodone (for sale) quota effective January 5, 2026. The quota setting directly shapes how much controlled-substance API and finished dose can be manufactured and purchased through the year, influencing allocation strategies and supply continuity planning across manufacturers and distributors.
- November 2025: Endo Pharmaceuticals discontinued multiple strengths of Endocet (acetaminophen/oxycodone hydrochloride) tablets, as reflected in the FDA drug shortage database. Product-line exits at the manufacturer level tighten substitution options for providers and can shift share toward remaining approved suppliers and alternative oxycodone presentations in hospital and retail channels.
- April 2024: Collegium Pharmaceutical entered an authorized generic agreement with Hikma Pharmaceuticals USA for the Nucynta and Nucynta ER franchise, granting Hikma exclusive US marketing rights for authorized generic versions. The agreement underscored how branded pain portfolios use authorized generics to defend access and contracting leverage, and it also informs competitive playbooks around opioid-adjacent analgesic franchises.


Oxycodone Drugs Market Report Scope and Research Methodology
Market Definition and Coverage
This market covers prescription-only, finished-dose medicines where oxycodone is the lead active ingredient, used to treat moderate to severe pain across inpatient and outpatient settings. It includes commercially sold immediate-release and extended-release formats through common pharmacy channels.
Scope exclusions: We exclude oxycodone API trade, illicit or counterfeit circulation, and compounded preparations that sit outside regulated dispensing routes.
Segments Covered in This Report
- By Product Type
- Short-acting
- Long-acting
- By Formulation Type
- Immediate-Release (IR)
- Extended-Release (ER)
- Abuse-Deterrent Formulations (ADF)
- By Distribution Channel
- Hospital Pharmacies
- Retail Pharmacies
- Online Pharmacies
- By Geography
- North America
- United States
- Canada
- Mexico
- Europe
- Germany
- United Kingdom
- France
- Italy
- Spain
- Rest of Europe
- Asia-Pacific
- China
- Japan
- India
- Australia
- South Korea
- Rest of Asia-Pacific
- Middle East & Africa
- GCC
- South Africa
- Rest of Middle East & Africa
- South America
- Brazil
- Argentina
- Rest of South America
- North America
Data Sources, Market Sizing, and Validation
Desk Research
Desk work starts with public statistics and clinical context so we do not build the model on assumptions alone. We typically reference sources such as US FDA drug approvals and safety communications, CDC opioid prescribing and overdose surveillance, WHO medicine and health system data, and NIH hosted clinical literature for pain management patterns.
On the market side, we cross-check basic demand signals using national prescription and reimbursement updates where available, public payer and regulator notices, trade association publications, and company filings plus investor presentations that discuss product mix and geographic exposure. For pricing and volume guardrails, we also use paid subscriptions for company financials and intelligence, patent databases, and an import and export shipment-level database where it helps validate supply availability. These examples are not exhaustive, and many other public and subscription sources were also reviewed for data collection, validation, and clarification.
Primary Interviews and Surveys
Primary work is used to pressure-test what desk sources cannot fully explain, especially the real-world split between IR, ER, and abuse-deterrent formulations and how channel mix changes with controlled-substance prescribing controls. We speak with stakeholders across manufacturers, distributors, pharmacy channel participants, and clinicians, and then we validate assumptions across APAC, EMEA, and the Americas so regional policy differences are not averaged out.
Distribution of primary research fieldwork respondents
| Company type | Respondent position | Region |
|---|---|---|
| Top tier: 33% | CXOs: 13% | APAC: 45% |
| Mid tier: 51% | Functional/Unit leaders: 34% | EMEA: 29% |
| Smaller Players: 16% | Managers: 53% | Americas: 26% |
Market-Sizing & Forecasting
Sizing is anchored in a top-down build where prescription and treatment activity, along with regulated distribution signals, are translated into a revenue pool for finished oxycodone medicines by geography. Once that total is formed, it is corroborated with selective bottom-up approximations, like sampled price per unit times estimated volumes by formulation type, plus channel checks from pharmacy stakeholders, and then the total is adjusted where mismatches persist.
Key inputs that feed the model include the mix of IR versus ER utilization, the adoption curve of abuse-deterrent formulations, changes in prescribing guidelines and controlled-substance monitoring, shifts in surgical volumes and chronic pain prevalence proxies, and channel share movement between hospital, retail, and online pharmacies. Where direct volume indicators are weak in a country, we fill gaps using proxy variables that are discussed with local experts, and the proxy is used only after the direction and magnitude are consistent with what interviewees describe.
Forecasting is done using scenario analysis supported by time series smoothing on the historical baseline, since policy changes and reformulations can create step changes that a single straight-line trend does not capture well. Assumptions on pricing progression and mix shift are reviewed with interviewees, and then a conservative, base-case view is kept as the central forecast.
Data Validation & Update Cycle
Outputs are validated through multiple checks so single-source noise does not drive the final number. We compare results against independent signals such as controlled-substance policy timing, expected channel shares, and publicly visible supply and product availability cues, and then we re-check any region where the model shows unusual jumps.
Before sign-off, the model and assumptions go through a multi-step analyst review, and a re-contact is triggered when an interview insight conflicts with the desk evidence or when a new regulatory update changes access. Reports are refreshed annually, with interim updates when material events happen, and a final pre-delivery pass is completed so clients receive the latest view.
Mordor Intelligence's Oxycodone Drugs Market Size Versus Other Published Estimates
Published market sizes for oxycodone drugs can look inconsistent, even when they report USD figures, because the counted product boundary and the timing assumptions are not always the same. Differences often come from what is treated as in-scope revenue, which year is used as the anchor, and how pricing and mix are allowed to evolve in the forecast.
The benchmark table shows a spread that largely tracks scope choices. In Mordor Intelligence's model, we count only prescription-only, finished-dose oxycodone medicines sold through regulated hospital, retail, and online pharmacies, rather than folding in adjacent opioid categories or upstream API value. Other gaps can come from using a more aggressive scenario around abuse-deterrent uptake, applying a single global pricing curve without local controls, or using older currency conversion timing that does not match the base year.
Benchmark comparison
| Source | Market Size | Gaps in Research Methodology |
|---|---|---|
| Mordor Intelligence | USD 5.70 B (2025) | |
| Global Research House A | USD 7.06 B (2025) | Uses a broader counted revenue pool that appears to include adjacent opioid therapy value and applies a higher near-term price and mix uplift, which can inflate the 2025 total versus a finished-dose-only scope. |
| Industry Publisher B | USD 5.65 B (2025) | Uses a narrower channel and use-case lens, with limited coverage of online pharmacy revenue and differing treatment of abuse-deterrent products, which can reduce the counted 2025 value. |
Taken together, the comparison suggests that the main swing factor is what gets counted as oxycodone drug revenue and how channel coverage is handled in the base year. By tying the model to prescription-led demand signals and then checking the totals with practical price times volume tests, we keep a traceable number that can be repeated when inputs change.


Key Questions Answered in the Report
What is the current Oxycodone Drugs Market size?
The oxycodone market size is USD 5.99 billion in 2026 and is forecast to reach USD 7.69 billion by 2031.
Who are the key players in Oxycodone Drugs Market?
Teva Pharmaceutical Industries Ltd, Sun Pharmaceutical Industries Ltd, Endo Pharmaceuticals Inc, Collegium Pharmaceutical Inc and Mallinckrodt Pharmaceuticals are the major companies operating in the Oxycodone Drugs Market.
Which is the fastest growing region in Oxycodone Drugs Market?
Asia-Pacific registers the quickest pace at a 6.78% CAGR through 2031, driven by broader healthcare access and generic entry.
Which region has the biggest share in Oxycodone Drugs Market?
In 2025, the North America accounts for the largest market share in Oxycodone Drugs Market.
Page last updated on:


 Your data is secure and never sold or shared.


