United States Dairy Market Size and Share
Market Overview
| Study Period | 2018 - 2031 |
|---|---|
| Forecast Data Period | 2026 - 2031 |
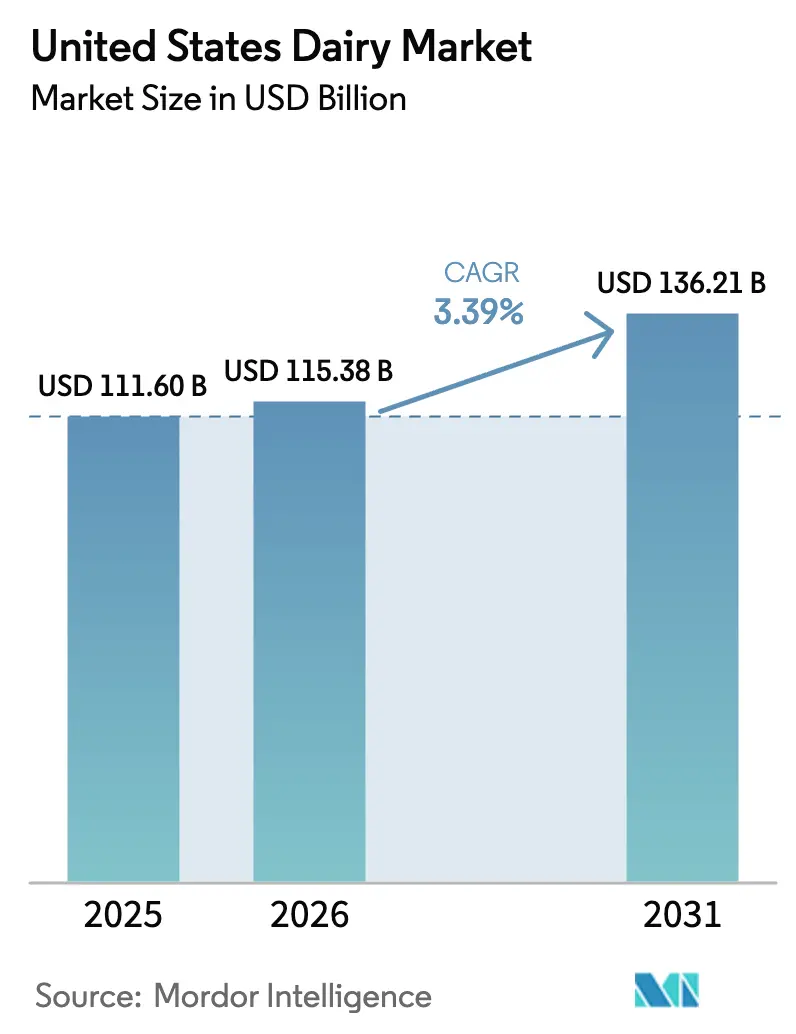
| Base Year Market Size (2025) | USD 111.6 Billion |
| Market Size (2026) | USD 115.38 Billion |
| Market Size (2031) | USD 136.21 Billion |
| Growth Rate (2026 - 2031) | 3.39% CAGR |
| Market Concentration | Low |
Major Players*Disclaimer: Major Players sorted in no particular order Image © Mordor Intelligence. Reuse requires attribution under CC BY 4.0. | |
United States Dairy Market Analysis by Mordor Intelligence
The United States Dairy Market size market size in 2026 is estimated at USD 115.38 billion, growing from 2025 value of USD 111.6 billion with 2031 projections showing USD 136.21 billion, growing at 3.39% CAGR over 2026-2031.
The United States dairy market is experiencing significant transformation in its retail landscape, characterized by the dominance of traditional brick-and-mortar establishments alongside emerging digital channels. Supermarkets and hypermarkets continue to lead the dairy distribution network, commanding 61.77% of the overall channel share in 2022, with major players like Walmart, Target, Kroger, and Amazon maintaining a strong market presence. The retail infrastructure has expanded considerably, with 63,348 supermarkets and 150,174 convenience stores operating across the nation as of 2023, providing consumers with unprecedented access to dairy products through various price points and formats.
Consumer preferences are increasingly shifting toward clean-label dairy products across dairy segments, reflecting a growing demand for transparency and natural ingredients. Retailers are responding by expanding their offerings of dairy products free from artificial colors, flavors, and preservatives. This trend is particularly evident in the product development strategies of major retailers and manufacturers, who are reformulating their products to meet these evolving consumer preferences. The market has witnessed a significant rise in premium and specialty dairy products, with retailers dedicating more shelf space to organic, natural, and functional dairy offerings.
The digital transformation of dairy retail is accelerating, driven by high internet penetration rates reaching 92% of the total population in 2022. This digital shift is particularly pronounced among younger consumers, with 95% of Gen-Z consumers using smartphones for an average of 10 hours daily, significantly influencing purchasing patterns and channel preferences. Major retailers are investing heavily in their digital infrastructure, developing sophisticated e-commerce platforms and mobile applications to enhance the online shopping experience for dairy products.
The foodservice sector represents a crucial distribution channel for dairy products, with approximately 23.1 million Americans consuming food outside their homes at least once per week in 2022. This trend has led to the expansion of on-trade distribution networks, with the milk segment accounting for 79.87% of on-trade dairy sales in 2022. The foodservice landscape continues to evolve, with establishments focusing on innovative dairy-based offerings and premium products to meet diverse consumer preferences and dietary requirements. Major restaurant chains and foodservice operators are increasingly partnering with dairy manufacturing companies to develop exclusive products and formulations, driving innovation in the foodservice dairy segment.
Note: Market size and forecast figures in this report are generated using Mordor Intelligence’s proprietary estimation framework, updated with the latest available data and insights as of 2026.
United States Dairy Market Trends and Insights
Increased demand for milk's nutritional profile largely impacts the consumption of dairy in the United States
- Among dairy products, milk is the top source of 13 essential nutrients, including vitamin A (15%), vitamin D (15%), riboflavin B2 (30%), niacin B3 (15%), and calcium (25%). Due to its nutritional profile, it is highly preferred in the diets of children and youth aged 18 and younger. The average US consumer consumed 667 pounds of dairy on a milk-fat basis in 2021. For the overall milk per capita consumption, school meal programs play an important role in promoting the consumption of dairy. They allow the consumption and promotion of healthy dietary patterns. In 2021, children aged between 6 and 12 years received 35% of their liquid milk at schools, and those aged between 13 and 18 received 25%.
- Among the dairy products consumed, the increasing popularity of cheese among the US population has positively impacted the consumption of pizza. Large chains such as Domino's Pizza, Pizza Hut, Little Caesars, and Marco's Pizza have boosted the carry-out and delivery of pizza throughout the country. This is also because consumers are more interested in cooking meals at home, and during an uncertain time, they long for more nostalgic dishes, like grilled cheese sandwiches, nachos, and mac and cheese, driving per capita consumption. In 2021, the per capita consumption of cheese increased by 5.3% compared to 2020.
- The per capita consumption of dairy products declined by 2% in 2020 because of the COVID-19 pandemic and negative producer price differentials. In 2020, the United States lost more than 9% of licensed dairy operations, which resulted in only 32,000 dairy operation facilities in that year. The market has seen a considerable recovery during 2021-2023, with a steady growth of 4.3% in per capita consumption.


OTHER KEY INDUSTRY TRENDS COVERED IN THE REPORT
- Increasing demand for butter in domestic and international markets influences its production in the United States
- Rising number of milk cows in the country impacts the production of milk in the country
- Increasing domestic use of various Italian cheese types in the country impacts the production of cheese
Segment Analysis: Category
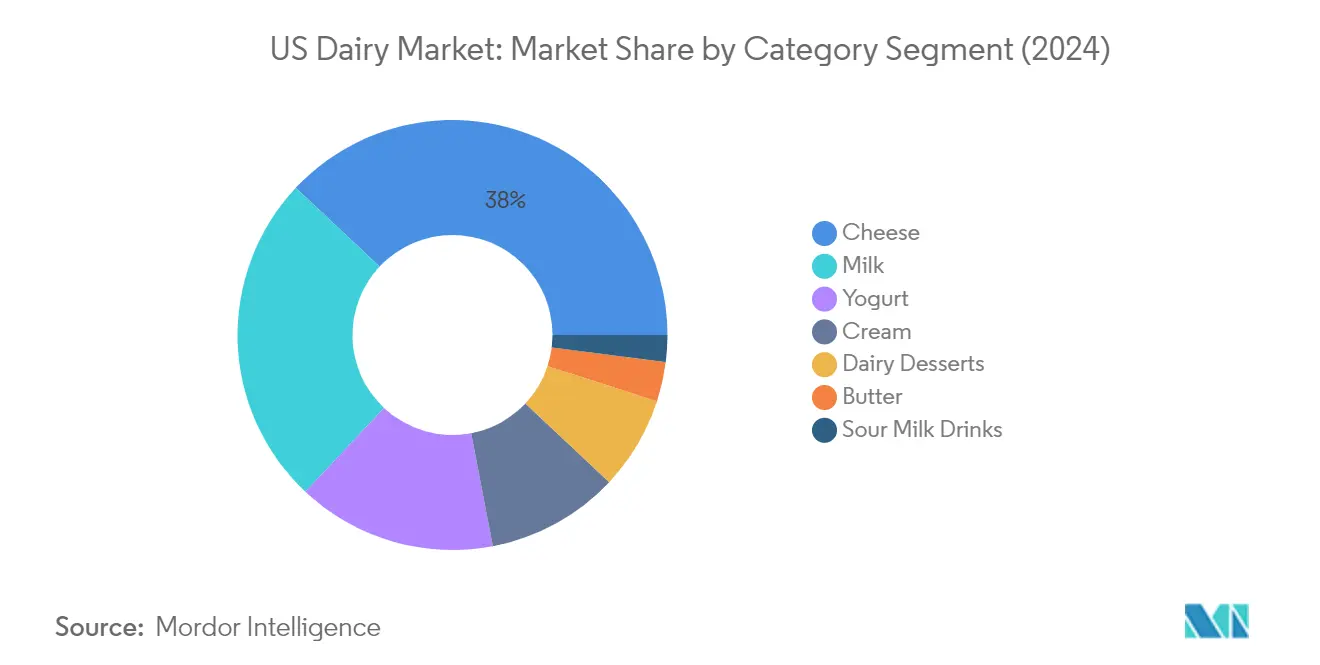
Cheese Segment in US Dairy Market
The cheese segment continues to dominate the US dairy market, holding approximately 37.45% market share in 2025. This dominance is driven by strong product consistency and increasing cheese consumption across different cuisines. Product innovations in natural and processed cheese varieties, along with the growing popularity of specialty and artisanal cheeses, have strengthened this segment's position. The segment's growth is further supported by the expanding quick-service restaurant industry, particularly pizza chains, which are major cheese consumers. Wisconsin remains the leading cheese-producing state, contributing significantly to domestic production. Additionally, the rising consumer preference for protein-rich dairy foods and the versatility of cheese in various applications, from direct consumption to ingredient use in prepared foods, continue to reinforce its market leadership.

Milk Segment in US Dairy Market
The milk segment is projected to exhibit the strongest growth trajectory in the US dairy market during 2026-2031, with an expected growth rate of approximately 4.64%. This accelerated growth is attributed to several factors, including increasing public-private funding in dairy farming and technological advancements in the industry. The segment's expansion is further driven by rising consumer demand for value-added dairy products, including flavored milk, organic milk, and fortified milk varieties. Innovations in packaging and processing technologies, particularly in UHT and extended shelf-life products, are creating new market opportunities. Additionally, the growing adoption of plant-based and lactose-free alternatives within the traditional milk category is contributing to segment diversification and market expansion.
Remaining Segments in US Dairy Market
The US dairy market encompasses several other significant segments, including yogurt, cream, dairy desserts, butter, and sour milk drinks, each serving distinct consumer needs and preferences. The yogurt segment maintains its strong position through probiotic and functional offerings, while the cream segment caters to both retail and foodservice sectors with various fat content options. Dairy desserts continue to innovate with premium and indulgent offerings, particularly in the ice cream category. The butter segment focuses on natural and organic varieties, while sour milk drinks target health-conscious consumers seeking probiotic benefits. These segments collectively contribute to the market's diversity and cater to evolving consumer preferences for both traditional and innovative dairy products.
Segment Analysis: Distribution Channel
Off-Trade Segment in US Dairy Market
The off-trade distribution channel dominates the US dairy market, accounting for approximately 81% of the total market value in 2024. This channel encompasses supermarkets, hypermarkets, convenience stores, specialty retailers, and online retail platforms. Supermarkets and hypermarkets hold the largest share within off-trade channels at around 77%, driven by their extensive product range and strong retail presence across the country. The channel's strength is further reinforced by the presence of major retail chains like Walmart, Target, Kroger, and Amazon, which offer diverse dairy product portfolios at competitive prices. These retailers have also enhanced their cold chain infrastructure and implemented advanced inventory management systems to ensure product freshness and availability. Additionally, the growing adoption of private label dairy products by major retail chains has further strengthened the off-trade channel's market position.
On-Trade Segment in US Dairy Market
The on-trade distribution channel is projected to be the fastest-growing segment in the US dairy market, with an expected growth rate of approximately 4% during 2024-2029. This growth is primarily driven by the expanding foodservice industry and changing consumer dining preferences. The channel encompasses fast-food chains, full-service restaurants, cafeterias, and catering services. The segment's expansion is supported by the increasing number of food outlets, with over 72,000 coffee and snack shops operating in the United States as of 2024. Quick-service restaurants like McDonald's, Starbucks, and Chick-fil-A are significantly contributing to dairy product consumption through their menu offerings. The trend toward out-of-home food consumption is particularly strong among younger consumers, with approximately 15% of the population preferring to consume food outside at least three times a week.
Competitive Landscape
Top Companies in United States Dairy Market
The US dairy market is characterized by companies focusing on continuous product innovation and operational excellence to maintain their competitive edge. Major dairy companies are actively expanding their product portfolios through the introduction of clean-label dairy products, organic variants, and innovative flavors to cater to evolving consumer preferences. Operational agility is demonstrated through investments in advanced dairy manufacturing facilities and the adoption of sustainable practices across the value chain. Strategic partnerships with local dairy farmers and retail chains have become crucial for ensuring consistent supply and market reach. Companies are also pursuing geographical expansion through both organic growth and acquisitions, particularly focusing on strengthening their presence in high-growth regions and entering new market segments.
Fragmented Market with Strong Local Players
The US dairy market exhibits a fragmented structure with a mix of global conglomerates and regional specialists competing for market share. While multinational corporations leverage their extensive distribution networks and brand portfolios, local players maintain strong positions through their deep understanding of regional preferences and established relationships with local dairy farmers. The market is characterized by the presence of both diversified food companies that include dairy in their broader portfolio and specialized dairy cooperatives focused exclusively on dairy products.
The industry has witnessed significant merger and acquisition activity as companies seek to consolidate their positions and achieve economies of scale. Large players are actively acquiring smaller, innovative brands to expand their product offerings and capture emerging market segments. Regional cooperatives are forming strategic alliances to enhance their competitive position against larger corporations, while international players are entering the market through acquisitions of established local brands to gain immediate market access and distribution capabilities.
Innovation and Sustainability Drive Future Success
For incumbent players to maintain and increase their market share, a focus on product innovation, sustainability initiatives, and digital transformation will be crucial. Companies need to invest in research and development to create differentiated products that align with health and wellness trends. Building strong relationships with retailers, implementing efficient supply chain management systems, and developing direct-to-consumer channels will be essential for maintaining a competitive advantage. Additionally, sustainability initiatives and transparent sourcing practices will become increasingly important for maintaining consumer trust and brand loyalty.
New entrants and challenger brands can gain ground by focusing on niche market segments and leveraging digital platforms for market penetration. Success will depend on developing unique value propositions, such as specialized product offerings or innovative packaging solutions. Companies must also consider potential regulatory changes regarding labeling requirements and food safety standards, which could impact market dynamics. The ability to adapt to changing consumer preferences while maintaining operational efficiency will be crucial for long-term success in this competitive landscape.
United States Dairy Industry Leaders
Danone SA
Froneri International Limited
Groupe Lactalis
Nestlé SA
The Kraft Heinz Company
- *Disclaimer: Major Players sorted in no particular order


Recent Industry Developments
- December 2022: Lactalis Canada acquired Kraft Heinz's Grated Cheese business in Canada, marking its entry into the ambient category.
- November 2022: The Kraft Heinz Company launched the cheesecake kit Philly Handbag.
- August 2022: Dairy Farmers of America acquired two shelf-extended facilities of SmithFoods. The strategy of this acquisition was to assist the corporation in capitalizing on the market's growing demand for products with extended shelf lives.


United States Dairy Market Report Scope
Butter, Cheese, Cream, Dairy Desserts, Milk, Sour Milk Drinks, Yogurt are covered as segments by Category. Off-Trade, On-Trade are covered as segments by Distribution Channel.| Butter | Salted Butter | |
| Unsalted Butter | ||
| Cheese | Natural Cheese | Cheddar |
| Cottage | ||
| Ricotta | ||
| Parmesan | ||
| Others | ||
| Processed Cheese | ||
| Cream | Fresh Cream | |
| Cooking Cream | ||
| Whippng Cream | ||
| Others (Clottted, Sour Cream) | ||
| Dairy Desserts | Ice Cream | |
| Cheesecakes | ||
| Frozen Desserts | ||
| Others (Puddings/desserts, trifles, fools) | ||
| Milk | Condensed milk | |
| Flavored Milk | ||
| Fresh Milk | ||
| UHT Milk (Ultra-high temperature milk) | ||
| Powdered Milk | ||
| Yogurt | Drinkable | |
| Spoonable | ||
| Sour Milk Drinks | ||
| On-trade | |
| Off-trade | Convenience Stores |
| Specialist Retailers | |
| Supermarkets and Hypermarkets | |
| On-line Retail | |
| Others |
| By Product Type | Butter | Salted Butter | |
| Unsalted Butter | |||
| Cheese | Natural Cheese | Cheddar | |
| Cottage | |||
| Ricotta | |||
| Parmesan | |||
| Others | |||
| Processed Cheese | |||
| Cream | Fresh Cream | ||
| Cooking Cream | |||
| Whippng Cream | |||
| Others (Clottted, Sour Cream) | |||
| Dairy Desserts | Ice Cream | ||
| Cheesecakes | |||
| Frozen Desserts | |||
| Others (Puddings/desserts, trifles, fools) | |||
| Milk | Condensed milk | ||
| Flavored Milk | |||
| Fresh Milk | |||
| UHT Milk (Ultra-high temperature milk) | |||
| Powdered Milk | |||
| Yogurt | Drinkable | ||
| Spoonable | |||
| Sour Milk Drinks | |||
| By Distribution Channel | On-trade | ||
| Off-trade | Convenience Stores | ||
| Specialist Retailers | |||
| Supermarkets and Hypermarkets | |||
| On-line Retail | |||
| Others | |||


Market Definition
- Butter - Butter is a yellow-to-white solid emulsion of fat globules, water, and inorganic salts produced by churning the cream from cows’ milk
- Dairy - Dairy product include milk and any of the foods made from milk, including butter, cheese, ice cream, yogurt, and condensed and dried milk.
- Frozen Desserts - Frozen dairy dessert means and includes products containing milk or cream and other ingredients which are frozen or semi-frozen prior to consumption, such as ice milk or sherbet, including frozen dairy desserts for special dietary purposes, and sorbet
- Sour Milk Drinks - Sour milk is thick, curdled milk, with a sour taste, obtained from the fermentation of milk. Sour milk drinks such as kefir, laban, buttermilk have been considered in the study
| Keyword | Definition |
|---|---|
| Cultured Butter | Cultured butter is prepared by having the raw butter go through chemical processing and has been added with certain emulsifiers and foreign ingredients. |
| Uncultured Butter | This type of butter is one which has not been processed in any way |
| Natural Cheese | The type of cheese in its most natural form. It is made from natural and simple products and ingredients, including fresh and natural salts, natural colors, enzymes, and high-quality milk. |
| Processed Cheese | Processed cheese undergoes the same processes as natural cheese; however, it requires more steps and many different forms of ingredients. Making processed cheese involves melting natural cheese, emulsifying it, and adding preservatives and other artificial ingredients or colorings. |
| Single Cream | Single cream contains around 18% fat. It’s a single layer of cream that appears over boiled milk. |
| Double Cream | Double cream contains 48% fat, more than double the amount of fat of single cream. It’s heavier and thicker than single cream |
| Whipping Cream | This has a much higher fat percentage than single cream (36%). Used to top cakes, pies, and puddings and as a thickener for sauces, soups, and fillings. |
| Frozen Desserts | Desserts that are meant to be eaten in frozen condition. E.g., sherbets, sorbets, frozen yogurts |
| UHT Milk (Ultra-high temperature milk) | Milk heated at a very high temperature. Ultra-high-temperature processing (UHT) of milk involves heating for 1–8 sec at 135–154°C. which kills the spore-forming pathogenic microorganism, resulting in a product with a shelf-life of several months. |
| Non-dairy butter/Plant-based butter | Butter made from plant-derived oil such as coconut, palm, etc. |
| Non-dairy Yogurt | Yogurt made from typically made from nuts, like almonds, cashews, coconuts, and even other foods like soybeans, plantains, oats, and peas |
| On-trade | It refers to restaurants, QSRs, and bars. |
| Off-trade | It refers to supermarkets, hypermarkets, on-line channels, etc. |
| Neufchatel cheese | One of the oldest kinds of cheese in France. It is a soft, slightly crumbly, mold-ripened, bloomy-rind cheese made in the Neufchâtel-en-Bray region of Normandy. |
| Flexitarian | It refers to a consumer preferring a semi-vegetarian diet, that is centered on plant foods with limited or occasional inclusion of meat. |
| Lactose Intolerance | Lactose intolerance is a reaction in digestive system to lactose, the sugar in milk. It causes uncomfortable symptoms in response to the consumption of dairy products. |
| Cream Cheese | Cream cheese is a soft and creamy fresh cheese with a tangy taste made from milk and cream. |
| Sorbets | Sorbet is a frozen dessert made using ice combined with fruit juice, fruit purée, or other ingredients, such as wine, liqueur, or honey. |
| Sherbet | Sherbet is a sweetened frozen dessert made with fruit and some sort of dairy product such as milk or cream. |
| Shelf stable | Foods that can be safely stored at room temperature, or "on the shelf," for at least one year and do not have to be cooked or refrigerated to eat safely. |
| DSD | Direct Store Delivery is the process in supply chain management wherein the product is delivered from manufacturing plant directly to the retailer. |
| OU Kosher | Orthodox Union Kosher is a kosher certification agency based in New York City. |
| Gelato | Gelato is a frozen creamy dessert made with milk, heavy cream and sugar. |
| Grass-fed Cows | Grass-fed cows are allowed to graze in pastures, where they eat a variety of grasses and clover. |


Research Methodology
Mordor Intelligence follows a four-step methodology in all our reports.
- Step-1: Identify Key Variables: In order to build a robust forecasting methodology, the variables and factors identified in Step 1 are tested against available historical market numbers. Through an iterative process, the variables required for market forecast are set, and the model is built on the basis of these variables.
- Step-2: Build a Market Model: Market-size estimations for the forecast years are in nominal terms. Inflation is not a part of the pricing, and the average selling price (ASP) is kept constant throughout the forecast period for each country.
- Step-3: Validate and Finalize: In this important step, all market numbers, variables, and analyst calls are validated through an extensive network of primary research experts from the market studied. The respondents are selected across levels and functions to generate a holistic picture of the market studied.
- Step-4: Research Outputs: Syndicated Reports, Custom Consulting Assignments, Databases & Subscription Platforms


