North America Dairy Market Size and Share
Market Overview
| Study Period | 2021 - 2031 |
|---|---|
| Forecast Data Period | 2026 - 2031 |
| Historical Data Period | 2021 - 2024 |
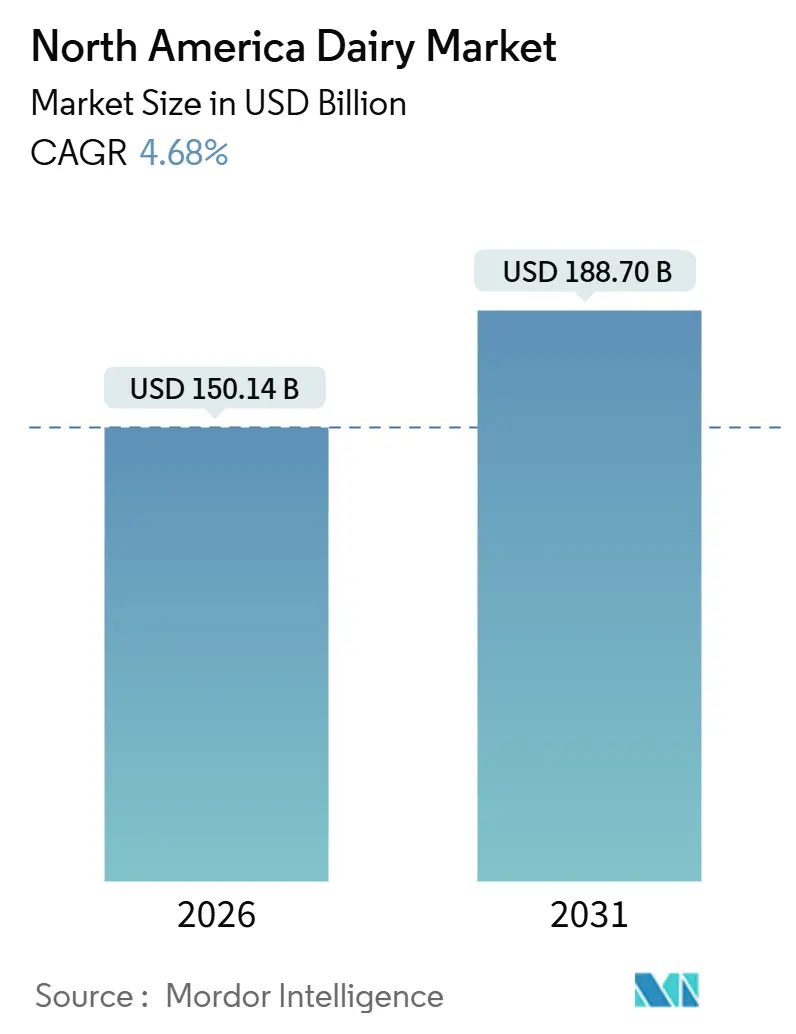
| Market Size (2026) | USD 150.14 Billion |
| Market Size (2031) | USD 188.70 Billion |
| Growth Rate (2026 - 2031) | 4.68% CAGR |
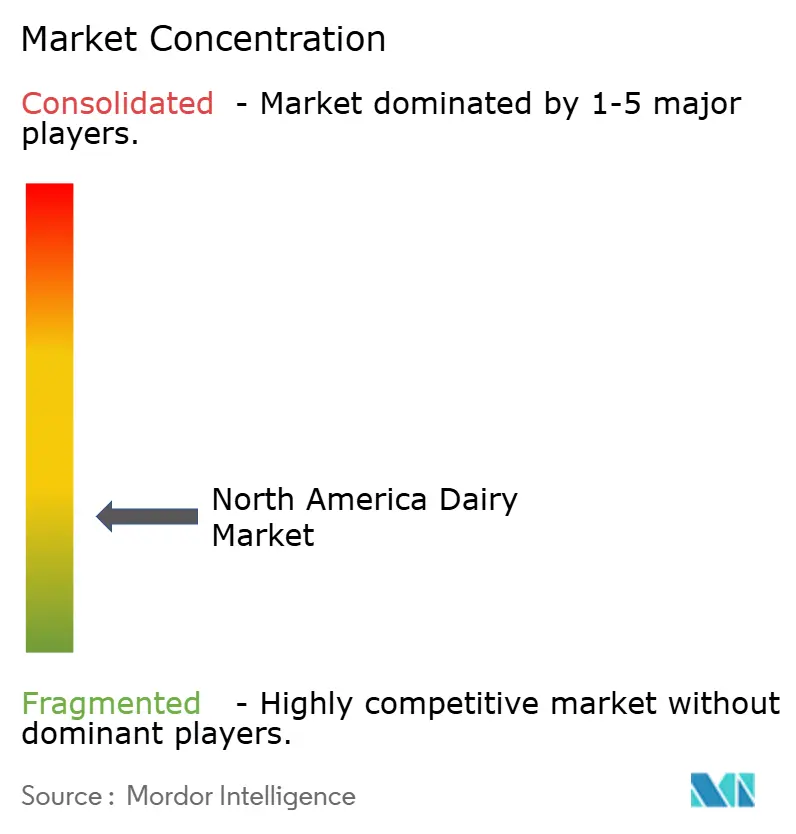
| Market Concentration | Low |
Major Players
*Disclaimer: Major Players sorted in no particular order Image © Mordor Intelligence. Reuse requires attribution under CC BY 4.0. |
|
North America Dairy Market Analysis by Mordor Intelligence
The North America dairy market size stood at USD 150.14 billion in 2026 and is projected to reach USD 188.70 billion by 2031, advancing at a 4.68% CAGR during the forecast period. While cheese continues to be a key component in both retail and foodservice menus, demand is increasingly shifting toward value-added products such as lactose-free milk and high-protein yogurts. Retailers are adopting vertical integration in milk bottling, which, although reducing processor margins, is driving downstream cost efficiencies and helping to curb consumer price inflation. On the supply side, investments in cheese and whey production lines are increasing processing capacity to meet the growing demand for premium protein products both domestically and internationally. Canada's supply-managed system is driving faster regional growth, while U.S. processors are leveraging export orders to Mexico and Asia to manage domestic surpluses.
Key Report Takeaways
- By product type, cheese controlled 38.96% of the North American dairy market share in 2025, whereas milk products are forecast to deliver a 5.39% CAGR through 2031.
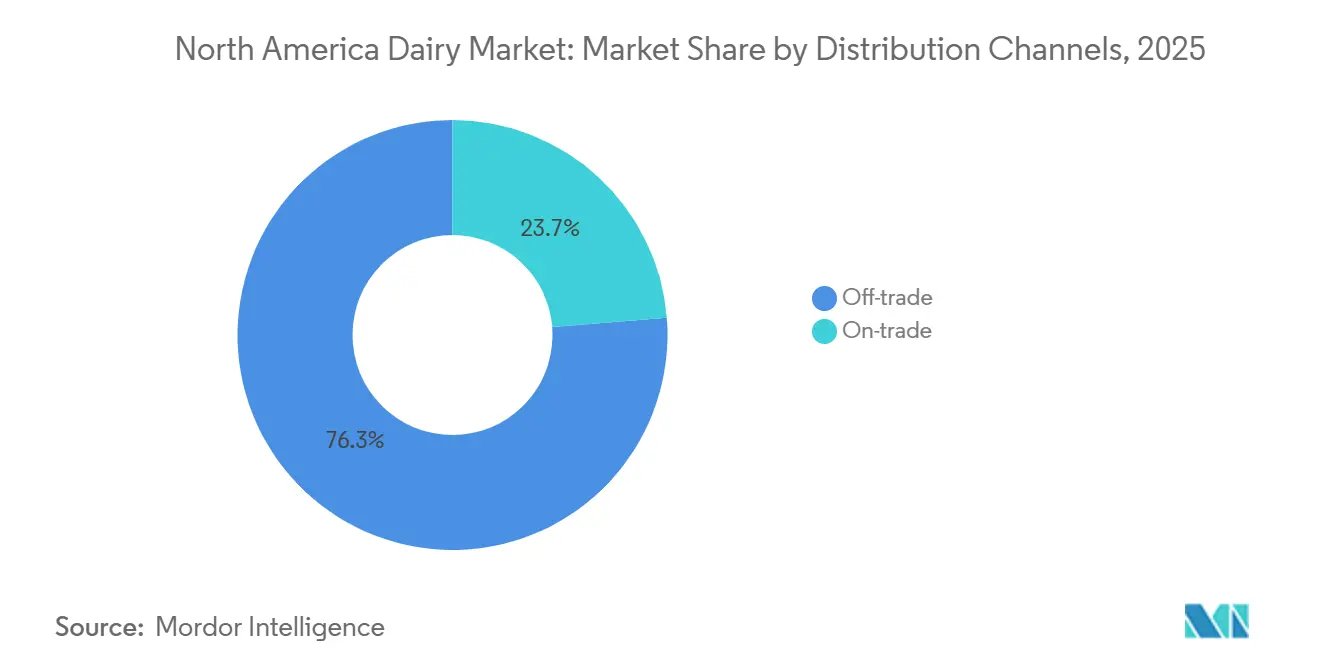
- By distribution channel, off-trade held 76.28% of the North America dairy market size in 2025; on-trade is expected to post the quickest expansion at a 5.12% CAGR between 2026 and 2031.
- By geography, the United States captured 79.25% revenue share in 2025, but Canada is anticipated to lead growth at a 5.84% CAGR to 2031.
Note: Market size and forecast figures in this report are generated using Mordor Intelligence’s proprietary estimation framework, updated with the latest available data and insights as of January 2026.
North America Dairy Market Trends and Insights
Drivers Impact Analysis*
| Driver | (~) % Impact on CAGR Forecast | Geographic Relevance | Impact Timeline |
|---|---|---|---|
| Surge in cheese-based foodservice demand | +1.2% | United States, Canada (urban centers, QSR corridors) | Medium term (2-4 years) |
| Premiumization of butter and cream segments | +0.8% | United States, Canada (coastal metros, affluent suburbs) | Long term (≥ 4 years) |
| Increasing demand for probiotic and functional dairy | +0.9% | United States, Canada | Medium term (2-4 years) |
| Increasing adoption of sustainable and ethical dairy options | +0.6% | United States, Canada (West Coast, Northeast) | Long term (≥ 4 years) |
| Government support for dairy development and supply stability | +0.7% | United States (federal), Canada (national and provincial) | Short term (≤ 2 years) |
| Expansion of lactose-digestive aids supporting dairy intake | +0.5% | United States, Canada, Mexico | Medium term (2-4 years) |
| Source: Mordor Intelligence | |||


Surge in cheese-based foodservice demand
Foodservice operators are embedding cheese into their menus to increase check averages and achieve differentiation, driving consistent demand for mozzarella, cheddar, and specialty varieties. Quick-service restaurants are enhancing their cheese-focused offerings as delivery platforms boost order frequency and ticket sizes. The USDA Foreign Agricultural Service reported that U.S. cheese consumption reached 6,256 thousand metric tons in 2025[1]Source: United States Department of Agriculture, "USDA Foreign Agricultural Service", usda.gov. Investment bank analysts indicate that U.S. cheese and whey processing capacity is expanding to meet both domestic and export demands. Processors are installing additional cheese vats and whey dryers to capitalize on high-value protein markets. This expansion enables the sector to manage increased milk volumes while aligning with foodservice recovery trends. As restaurants recover post-pandemic, cheese usage per meal occasion is rising, channeling more milk into production and reducing fluid milk's share of total consumption.
Premiumization of butter and cream segments
Driven by culinary media, consumers are increasingly choosing European-style butter, cultured cream, and artisanal dairy products, often willing to pay a premium for attributes like provenance and fat content. According to the United States Department of Agriculture, United States butter consumption reached 861 thousand metric tons in 2025[2]Source: United States Department of Agriculture, "Food and Agricultural Policy Research Institute", usda.gov. Premium butter categories hold strong retail pricing power, allowing processors to improve margins despite rising input costs. This trend is dividing the butter market into commodity and premium segments. Although the premium segment is growing faster, it originates from a smaller volume base. Processors are focusing on small-batch churning and regional sourcing to cater to specialty retailers and direct-to-consumer channels. The premiumization trend also applies to cream, where organic and grass-fed certifications command higher prices, offsetting lower throughput volumes.
Increasing demand for probiotic and functional dairy
Consumers, influenced by culinary media, are increasingly opting for European-style butter, cultured cream, and artisanal dairy products, showing a willingness to pay a premium for attributes like provenance and fat content. The United States Department of Agriculture reported that U.S. butter consumption reached 861 thousand metric tons in 2025. Premium butter categories exhibit strong retail pricing power, enabling processors to enhance margins despite rising input costs. This trend is segmenting the butter market into commodity and premium tiers. While the premium segment is expanding more rapidly, it originates from a smaller volume base. Processors are prioritizing small-batch churning and regional sourcing to serve specialty retailers and direct-to-consumer channels. The premiumization trend is also evident in the cream segment, where organic and grass-fed certifications command higher prices, compensating for lower throughput volumes.
Increasing adoption of sustainable and ethical dairy options
Corporate sustainability mandates, along with increasing consumer demand for carbon-neutral products, are propelling on-farm emissions reduction programs and the adoption of regenerative agriculture practices. Dairy Farmers of Canada has committed to achieving net-zero greenhouse gas emissions by 2050. This initiative outlines a sector-wide decarbonization strategy that prioritizes improved feed efficiency, enhanced manure management, and the integration of renewable energy. Similarly, Straus Family Creamery has introduced a carbon-farming program that emphasizes soil carbon sequestration and emissions monitoring on its supplier dairy farms, enabling the company to provide verified low-carbon milk to institutional buyers. These efforts align with procurement requirements from major foodservice chains and retailers that have established Scope 3 emissions reduction goals. Processors capable of documenting and verifying farm-level carbon reductions gain a competitive advantage. This has resulted in a two-tier market where low-carbon milk commands a premium, while conventional milk faces declining margins. Although regulatory influence is indirect, it remains significant. State-level climate policies and the potential implementation of federal carbon pricing mechanisms could accelerate the adoption of these practices and reshape cost structures across the supply chain.
Restraint Impact Analysis*
| Restraint | (~) % Impact on CAGR Forecast | Geographic Relevance | Impact Timeline |
|---|---|---|---|
| Rising lactose intolerance and dairy sensitivities | -0.6% | United States, Canada (urban centers, diverse demographics) | Medium term (2-4 years) |
| Volatile feed and energy input costs | -0.9% | United States, Canada, Mexico | Short term (≤ 2 years) |
| Labor shortages at processing plants | -0.5% | United States, Canada (rural processing hubs) | Short term (≤ 2 years) |
| Frequent quality and adulteration issues | -0.4% | United States, Mexico | Short term (≤ 2 years) |
| Source: Mordor Intelligence | |||
Rising lactose intolerance and dairy sensitivities
Shifting demographics, particularly the growth of Asian and Hispanic populations with higher rates of lactose intolerance, are reducing fluid milk consumption. This trend is most evident in urban areas, where immigration drives population growth and increases the share of individuals genetically predisposed to lactase non-persistence. Plant-based milk alternatives have gained market share by positioning themselves as naturally lactose-free, prompting dairy processors to invest in lactase treatments and reformulations. According to The Good Food Institute, the plant-based foods market in the United States was valued at USD 8.1 billion in 2024[3]Source: The Good Food Institute, "U.S. retail market insights for the plant-based industry", gfi.org. Although lactose-free product launches provide some mitigation, the overall impact remains negative as many consumers permanently transition to plant-based options due to perceived health and environmental benefits. Regulatory uncertainties, such as FDA oversight of the term "milk" for plant-based beverages, further complicate competitive positioning and influence consumer perceptions.
Volatile feed and energy input costs
Fluctuations in corn and soybean meal prices significantly influence dairy producer margins. The rising demand for ethanol has redirected corn supplies away from feed channels, leading to reduced availability. This scarcity drives up feed costs for dairy operations, compressing profit margins and often forcing producers to make difficult decisions, such as culling livestock or reducing feed supplementation. These actions directly result in lower milk production per cow. Furthermore, the volatility of natural gas prices adds another layer of financial pressure, particularly for energy-intensive processes like spray drying, evaporation, and cold storage. Processors with limited capacity to transfer these increased input costs to consumers experience further margin compression. This financial strain has accelerated industry consolidation, with smaller plants either shutting down or merging with larger entities to survive. The impact is especially severe in regions where access to alternative feed sources or renewable energy is limited. In such areas, rigid cost structures and heightened exposure to commodity price shocks exacerbate the challenges faced by dairy producers and processors.
*Our forecasts treat driver/restraint impacts as directional, not additive. The impact forecasts reflect baseline growth, mix effects, and variable interactions.
Segment Analysis
By Product Type: Milk Leads Growth, Cheese Dominates Share
In 2025, cheese accounted for 38.96% of the market share, highlighting its strong presence in foodservice, snacking, and ingredient applications. Natural cheeses, including cheddar, cottage, ricotta, and parmesan, dominate in volume due to their widespread use in restaurant menus and home cooking. Processed cheese caters to quick-service restaurants and convenience formats, with mozzarella leading in pizza and sandwich applications. To meet growing domestic and export demands, U.S. cheese and whey processing capacities are expanding. Processors are investing in additional cheese vats and whey dryers to capitalize on high-value protein markets. The butter and cream segments are shifting toward premium offerings, with artisanal and European-style products gaining popularity in affluent coastal metros and suburbs. While dairy desserts such as ice cream, cheesecakes, and puddings face competition from plant-based and low-calorie alternatives, they continue to maintain a loyal consumer base for indulgent occasions.
Between 2026 and 2031, milk products are projected to grow at a leading CAGR of 5.39%, surpassing other categories. This growth is driven by advancements in lactose-free products and fortified options, which are successfully attracting consumers who have shifted to plant-based alternatives. In February 2025, Dairy Farmers of America launched Milk50, a lactose-free milk with only 50 calories and 9 grams of protein, aimed at health-conscious consumers. Different milk types, condensed, flavored, fresh, UHT, and powdered, serve varied purposes such as foodservice, retail, institutional use, exports, and as ingredients. This variety helps protect the segment from disruptions in any single channel. Although fresh milk faces challenges with declining per-capita consumption, it benefits from school meal programs. The 2025 Whole Milk for Healthy Kids Act notably expanded fat content allowances in offerings under the National School Lunch Program.


By Distribution Channel: On-Trade Accelerates, Off-Trade Dominates
In 2025, off-trade channels accounted for 76.28% of the market share, highlighting the significant roles of supermarkets, hypermarkets, convenience stores, online platforms, and specialty retailers in dairy distribution. Supermarkets and hypermarkets lead this category by offering extensive product ranges, private-label competition, and aggressive promotions that drive volume. Retail consolidation is transforming the channel as major grocers increasingly integrate milk bottling, compressing processor margins and shifting value capture downstream. Online retail is expanding rapidly, with direct-to-consumer dairy subscriptions and e-commerce platforms extending their reach beyond traditional store footprints. Convenience stores address immediate consumption needs, while specialty retailers focus on premium niches, benefiting from higher margins on organic, grass-fed, and artisanal certifications.
On-trade channels, comprising restaurants, cafes, quick-service outlets, and institutional foodservice, are projected to grow at a 5.12% CAGR from 2026 to 2031, making them the fastest-growing distribution type. The recovery of the foodservice sector from pandemic disruptions is driving increased cheese usage in meals. Quick-service restaurants are incorporating cheese into menu innovations to differentiate offerings and boost average check sizes. Delivery platforms further enhance on-trade demand by increasing order frequency and encouraging menu experimentation that favors cheese-centric items. Institutional foodservice, including schools, hospitals, and corporate cafeterias, is benefiting from federal nutrition programs and the return-to-office trend, which is rebuilding cafeteria traffic. Growth in the on-trade channel is self-reinforcing: as restaurants attract more patrons, dairy usage per meal rises, channeling more milk into manufacturing and reducing fluid milk's share of total consumption. This trend favors cheese and butter processors over fluid milk bottlers, driving portfolio shifts among diversified dairy companies.
Geography Analysis
In 2025, the United States held a commanding 79.25% share of North America's dairy market, driven by its extensive production capacity, advanced processing infrastructure, and large consumer base. Federal programs, such as the Dairy Margin Coverage initiative, have been instrumental in stabilizing producer margins. However, retail giants like Walmart and Kroger are vertically integrating milk bottling operations, reducing processor margins and capturing value that was previously held by regional cooperatives and independent processors. At the same time, innovation in the lactose-free and high-protein segments is gaining momentum. Leading companies like Dairy Farmers of America, General Mills, and Chobani are introducing products aimed at health-conscious consumers who have previously shifted to plant-based alternatives.
Canada is projected to grow at a robust 5.84% CAGR from 2026 to 2031, the fastest rate among North American regions. This growth is supported by immigration-driven population increases and a supply management system that protects domestic producers from import competition. This system, which includes production quotas, cost-of-production pricing, and import controls, ensures stable farmgate prices but limits export competitiveness and remains a contentious issue in U.S.-Canada trade relations. Dairy Farmers of Canada has committed to achieving net-zero greenhouse gas emissions by 2050, with strategies such as improving feed efficiency, better manure management, and adopting renewable energy. Reflecting this trend, Danone Canada launched Activia EXPERT in August 2025, positioning it as the most advanced yogurt in Canada for gut health. While provincial regulations and oversight by the Canadian Food Inspection Agency enhance consumer confidence through strict quality standards, they also increase compliance costs for producers.
Mexico and the rest of North America are smaller but strategically important markets. Mexico is a key export destination for United States cheese, whey, and other dairy ingredients. However, cross-border trade is highly sensitive to tariff policies and sanitary regulations, with disruptions to USMCA provisions potentially impacting bilateral dairy trade. Domestically, Mexico faces challenges with feed costs, as drought in Sinaloa has reduced corn output, increasing reliance on imports and straining regional feed availability. This situation supports United States exports of corn and dairy ingredients but introduces volatility, particularly with fluctuations in the Mexican peso or a recovery in domestic production. Meanwhile, Central American and Caribbean markets, collectively referred to as the "Rest of North America," depend heavily on dairy imports from the United States and Canada. Limited domestic processing infrastructure restricts local value-added production, making these markets reliant on imported processed dairy products.
Competitive Landscape
The North American dairy market is moderately fragmented. Large cooperatives and multinational processors hold significant market shares, while regional players focus on niches such as organic, artisanal, and direct-to-consumer channels. Companies are prioritizing portfolio optimization, with major retailers like Walmart and Kroger vertically integrating by bottling private-label milk. This strategy is squeezing processor margins and driving cooperative consolidation. To capitalize on high-value protein markets, processors are expanding cheese and whey processing capacities by adding cheese vats and whey dryers to meet both domestic and export demands. Opportunities in sustainable dairy are growing, as processors invest in carbon-farming programs and commit to net-zero goals to meet corporate buyer requirements and differentiate their products in premium channels.
The North American dairy market emphasizes product innovation as a key strategy for maintaining competitiveness. Leading companies are expanding their product portfolios by introducing new flavors, organic options, and health-focused products, particularly in cheese, yogurt, and ice cream segments. They are modernizing manufacturing facilities and adopting advanced technologies to enhance production efficiency. Strategic collaborations with technology providers, research institutions, and retail chains are becoming more common to strengthen market presence. Companies are pursuing geographic expansion through organic growth and acquisitions, focusing on improving distribution networks and establishing new production facilities across North America.
Emerging disruptors include precision-fermentation companies collaborating with established brands to deliver lactose-free dairy products without animal-derived ingredients. For example, Breyers launched lactose-free ice cream in February 2024, using Perfect Day's animal-free whey proteins. To address labor shortages, processors are increasingly adopting automation, investing in robotic systems for packaging, palletizing, and quality inspections, which reduce reliance on manual labor in rural processing hubs. Regulatory compliance, particularly with FDA HACCP protocols and USDA oversight, creates barriers to entry that favor large, vertically integrated operators with dedicated quality assurance teams.
North America Dairy Industry Leaders
-
Danone SA
-
Froneri International Limited
-
Groupe Lactalis
-
The Kraft Heinz Company
-
Unilever PLC
- *Disclaimer: Major Players sorted in no particular order

Recent Industry Developments
- August 2025: Danone Canada has introduced Activia EXPERT, promoted as the most advanced yogurt for gut health in Canada. This initiative expands Danone's functional dairy portfolio within the Canadian market. Targeting consumers focused on digestive health, the launch highlights Danone's emphasis on clinical validation and specific health claims.
- June 2025: Marubeni has entered the U.S. ice cream manufacturing market. The company's flagship products, ice cream wrapped in mochi (rice cake) dough, are highly popular among health-conscious and trend-savvy consumers. Their popularity stems from their vibrant appearance, extensive flavor options, and use of natural ingredients.
- May 2024: Amul, an Indian cooperative giant, has introduced Amul milk in the U.S. market. The Gujarat Cooperative Milk Marketing Federation (GCMMF) has collaborated with the 108-year-old Michigan Milk Producers Association (MMPA) to launch fresh milk for American consumers.


North America Dairy Market Report Scope
Dairy products are foods produced from the milk of mammals, primarily cows, buffalo, goats, and sheep. The North American dairy market is segmented by product type, distribution channel, and geography. By product type, the market is segmented into butter, cheese, cream, dairy desserts, milk, yogurt, sour milk, and drinks. By distribution channel, the market is segmented into on-trade and off-trade. By geography, the market is segmented into the United States, Canada, Mexico, rest of North America. The market forecasts are provided in terms of value (USD) and volume (tons).
| Butter | Salted Butter | |
| Unsalted Butter | ||
| Cheese | Natural Cheese | Cheddar |
| Cottage | ||
| Ricotta | ||
| Parmesan | ||
| Others | ||
| Processed Cheese | ||
| Cream | Fresh Cream | |
| Cooking Cream | ||
| Whippng Cream | ||
| Others (Clottted, Sour Cream) | ||
| Dairy Desserts | Ice Cream | |
| Cheesecakes | ||
| Frozen Desserts | ||
| Others (Puddings/desserts, trifles, fools) | ||
| Milk | Condensed milk | |
| Flavored Milk | ||
| Fresh Milk | ||
| UHT Milk (Ultra-high temperature milk) | ||
| Powdered Milk | ||
| Yogurt | Drinkable | |
| Spoonable | ||
| Sour Milk Drinks | ||
| On-trade | |
| Off-trade | Convenience Stores |
| Specialist Retailers | |
| Supermarkets and Hypermarkets | |
| On-line Retail | |
| Others (Warehouse clubs, gas stations, etc.) |
| United States |
| Canada |
| Mexico |
| Rest of North America |
| Product Type | Butter | Salted Butter | |
| Unsalted Butter | |||
| Cheese | Natural Cheese | Cheddar | |
| Cottage | |||
| Ricotta | |||
| Parmesan | |||
| Others | |||
| Processed Cheese | |||
| Cream | Fresh Cream | ||
| Cooking Cream | |||
| Whippng Cream | |||
| Others (Clottted, Sour Cream) | |||
| Dairy Desserts | Ice Cream | ||
| Cheesecakes | |||
| Frozen Desserts | |||
| Others (Puddings/desserts, trifles, fools) | |||
| Milk | Condensed milk | ||
| Flavored Milk | |||
| Fresh Milk | |||
| UHT Milk (Ultra-high temperature milk) | |||
| Powdered Milk | |||
| Yogurt | Drinkable | ||
| Spoonable | |||
| Sour Milk Drinks | |||
| Distribution Channel | On-trade | ||
| Off-trade | Convenience Stores | ||
| Specialist Retailers | |||
| Supermarkets and Hypermarkets | |||
| On-line Retail | |||
| Others (Warehouse clubs, gas stations, etc.) | |||
| By Country | United States | ||
| Canada | |||
| Mexico | |||
| Rest of North America | |||


Market Definition
- Butter - Butter is a yellow-to-white solid emulsion of fat globules, water, and inorganic salts produced by churning the cream from cows’ milk
- Dairy - Dairy product include milk and any of the foods made from milk, including butter, cheese, ice cream, yogurt, and condensed and dried milk.
- Frozen Desserts - Frozen dairy dessert means and includes products containing milk or cream and other ingredients which are frozen or semi-frozen prior to consumption, such as ice milk or sherbet, including frozen dairy desserts for special dietary purposes, and sorbet
- Sour Milk Drinks - Sour milk is thick, curdled milk, with a sour taste, obtained from the fermentation of milk. Sour milk drinks such as kefir, laban, buttermilk have been considered in the study
| Keyword | Definition |
|---|---|
| Cultured Butter | Cultured butter is prepared by having the raw butter go through chemical processing and has been added with certain emulsifiers and foreign ingredients. |
| Uncultured Butter | This type of butter is one which has not been processed in any way |
| Natural Cheese | The type of cheese in its most natural form. It is made from natural and simple products and ingredients, including fresh and natural salts, natural colors, enzymes, and high-quality milk. |
| Processed Cheese | Processed cheese undergoes the same processes as natural cheese; however, it requires more steps and many different forms of ingredients. Making processed cheese involves melting natural cheese, emulsifying it, and adding preservatives and other artificial ingredients or colorings. |
| Single Cream | Single cream contains around 18% fat. It’s a single layer of cream that appears over boiled milk. |
| Double Cream | Double cream contains 48% fat, more than double the amount of fat of single cream. It’s heavier and thicker than single cream |
| Whipping Cream | This has a much higher fat percentage than single cream (36%). Used to top cakes, pies, and puddings and as a thickener for sauces, soups, and fillings. |
| Frozen Desserts | Desserts that are meant to be eaten in frozen condition. E.g., sherbets, sorbets, frozen yogurts |
| UHT Milk (Ultra-high temperature milk) | Milk heated at a very high temperature. Ultra-high-temperature processing (UHT) of milk involves heating for 1–8 sec at 135–154°C. which kills the spore-forming pathogenic microorganism, resulting in a product with a shelf-life of several months. |
| Non-dairy butter/Plant-based butter | Butter made from plant-derived oil such as coconut, palm, etc. |
| Non-dairy Yogurt | Yogurt made from typically made from nuts, like almonds, cashews, coconuts, and even other foods like soybeans, plantains, oats, and peas |
| On-trade | It refers to restaurants, QSRs, and bars. |
| Off-trade | It refers to supermarkets, hypermarkets, on-line channels, etc. |
| Neufchatel cheese | One of the oldest kinds of cheese in France. It is a soft, slightly crumbly, mold-ripened, bloomy-rind cheese made in the Neufchâtel-en-Bray region of Normandy. |
| Flexitarian | It refers to a consumer preferring a semi-vegetarian diet, that is centered on plant foods with limited or occasional inclusion of meat. |
| Lactose Intolerance | Lactose intolerance is a reaction in digestive system to lactose, the sugar in milk. It causes uncomfortable symptoms in response to the consumption of dairy products. |
| Cream Cheese | Cream cheese is a soft and creamy fresh cheese with a tangy taste made from milk and cream. |
| Sorbets | Sorbet is a frozen dessert made using ice combined with fruit juice, fruit purée, or other ingredients, such as wine, liqueur, or honey. |
| Sherbet | Sherbet is a sweetened frozen dessert made with fruit and some sort of dairy product such as milk or cream. |
| Shelf stable | Foods that can be safely stored at room temperature, or "on the shelf," for at least one year and do not have to be cooked or refrigerated to eat safely. |
| DSD | Direct Store Delivery is the process in supply chain management wherein the product is delivered from manufacturing plant directly to the retailer. |
| OU Kosher | Orthodox Union Kosher is a kosher certification agency based in New York City. |
| Gelato | Gelato is a frozen creamy dessert made with milk, heavy cream and sugar. |
| Grass-fed Cows | Grass-fed cows are allowed to graze in pastures, where they eat a variety of grasses and clover. |


Research Methodology
Mordor Intelligence follows a four-step methodology in all our reports.
- Step-1: Identify Key Variables: In order to build a robust forecasting methodology, the variables and factors identified in Step 1 are tested against available historical market numbers. Through an iterative process, the variables required for market forecast are set, and the model is built on the basis of these variables.
- Step-2: Build a Market Model: Market-size estimations for the forecast years are in nominal terms. Inflation is not a part of the pricing, and the average selling price (ASP) is kept constant throughout the forecast period for each country.
- Step-3: Validate and Finalize: In this important step, all market numbers, variables, and analyst calls are validated through an extensive network of primary research experts from the market studied. The respondents are selected across levels and functions to generate a holistic picture of the market studied.
- Step-4: Research Outputs: Syndicated Reports, Custom Consulting Assignments, Databases & Subscription Platforms


