Non-Dairy Milk Market Size and Share
Market Overview
| Study Period | 2021 - 2031 |
|---|---|
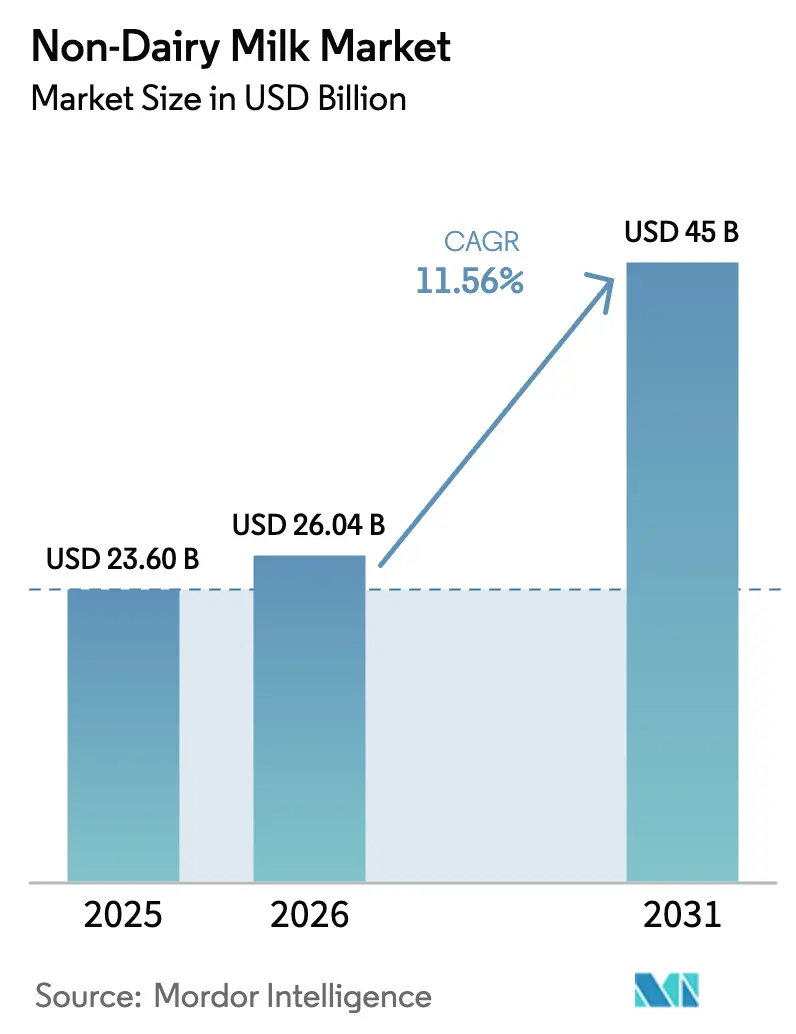
| Market Size (2026) | USD 26.04 Billion |
| Market Size (2031) | USD 45 Billion |
| Growth Rate (2026 - 2031) | 11.56% CAGR |
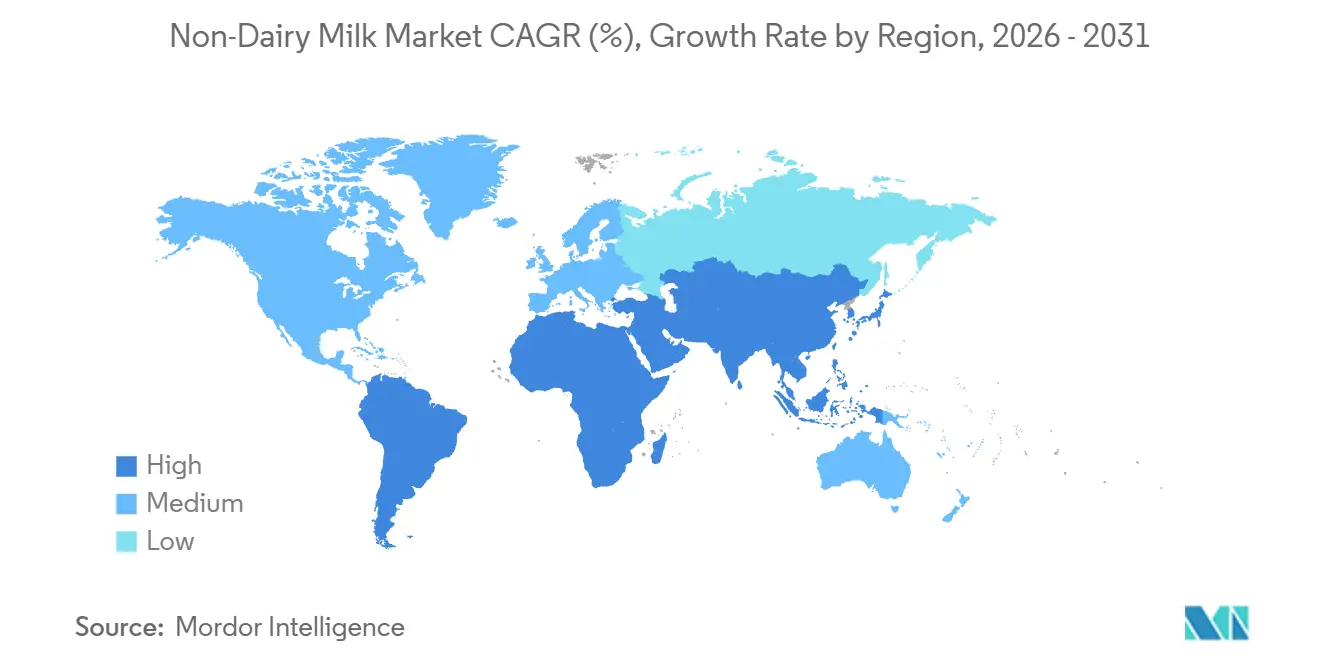
| Fastest Growing Market | Asia Pacific |
| Largest Market | North America |
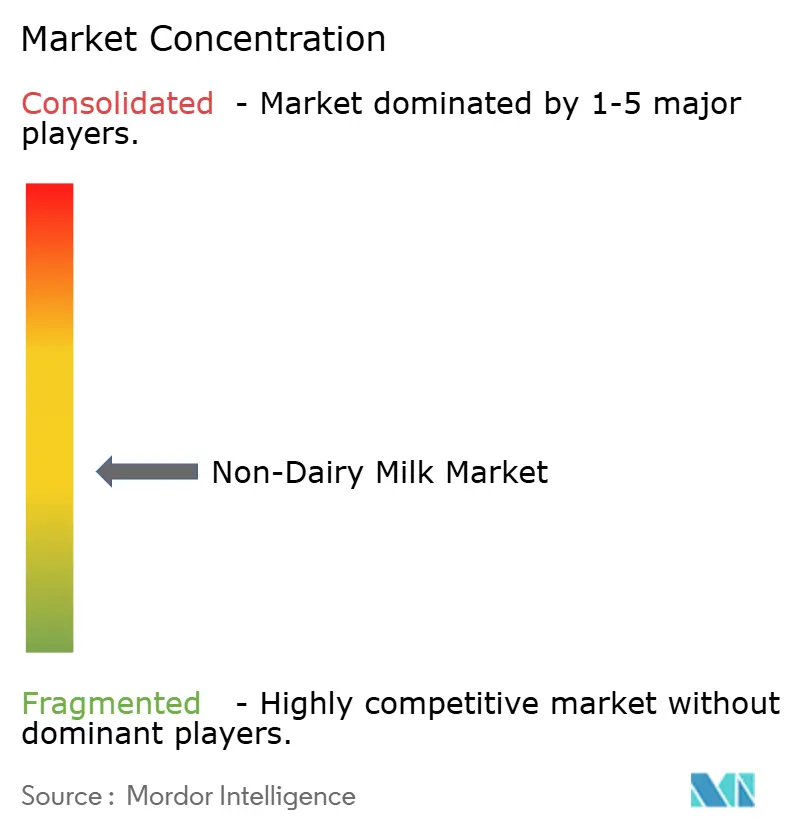
| Market Concentration | Medium |
Major Players *Disclaimer: Major Players sorted in no particular order Image © Mordor Intelligence. Reuse requires attribution under CC BY 4.0. | |
Non-Dairy Milk Market Analysis by Mordor Intelligence
The non-dairy milk market was valued at USD 23.60 billion in 2025 and expected to grow from USD 26.04 billion in 2026 to reach USD 45 billion by 2031, at a CAGR of 11.56% during the forecast period (2026-2031). Demand for plant-based beverages is increasing as regulatory definitions now classify fortified soy and nutritionally comparable beverages as part of the dairy group, allowing plant-based products unrestricted access to grocery categories. Supply chains are also becoming more robust, with vertical integration among almond and oat processors reducing input volatility. Additionally, investments in aluminum cans are extending ambient shelf life, enabling greater availability in convenience stores and vending machines. Product innovation has shifted focus from novelty flavors to nutrient-dense formulations that meet the requirements of school lunch programs and hospital menus, driven by stricter fortification standards in both the United States and the European Union. Coffee-shop standardization continues to play a significant role, with national rollouts at Starbucks and boutique café chains reinforcing consumer expectations for plant-based options across all foodservice venues.
Key Report Takeaways
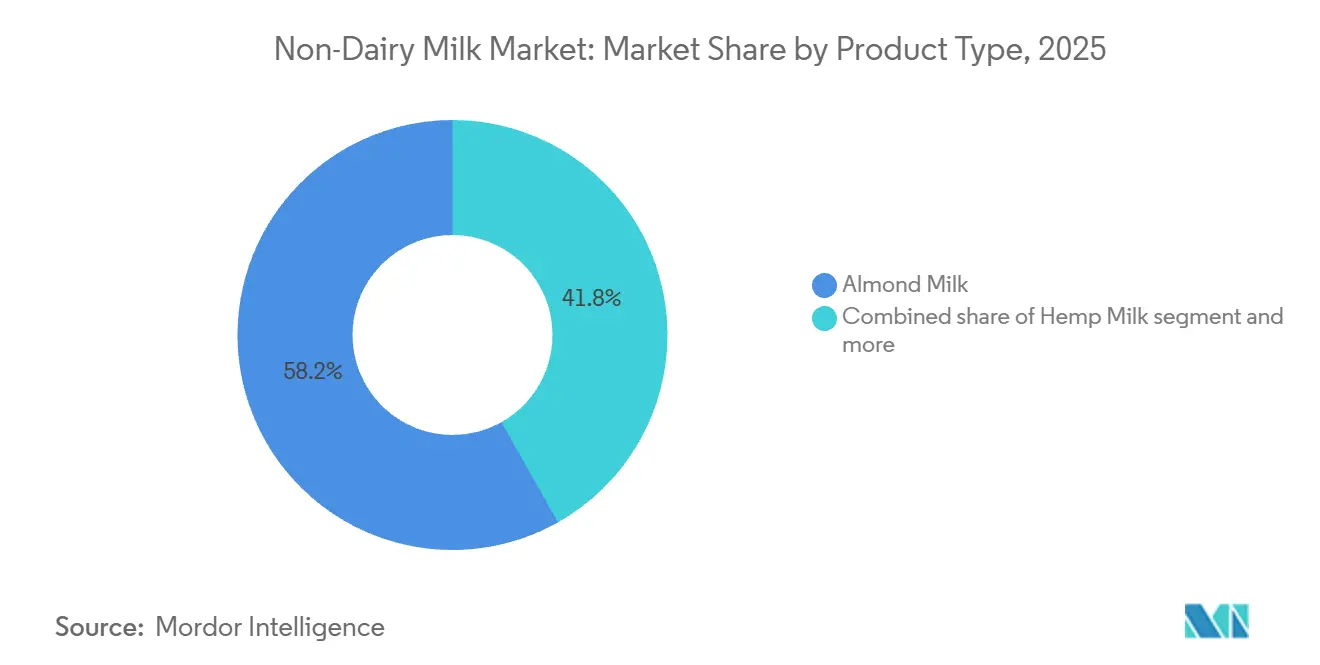
- By product type, almond milk led with 58.16% revenue share in 2025; hemp milk is on track to post the fastest 12.88% CAGR to 2031.
- By flavour, un-flavoured held 72.99% of the non-dairy milk market share in 2025, while flavoured variants are advancing at a 12.70% CAGR through 2031.
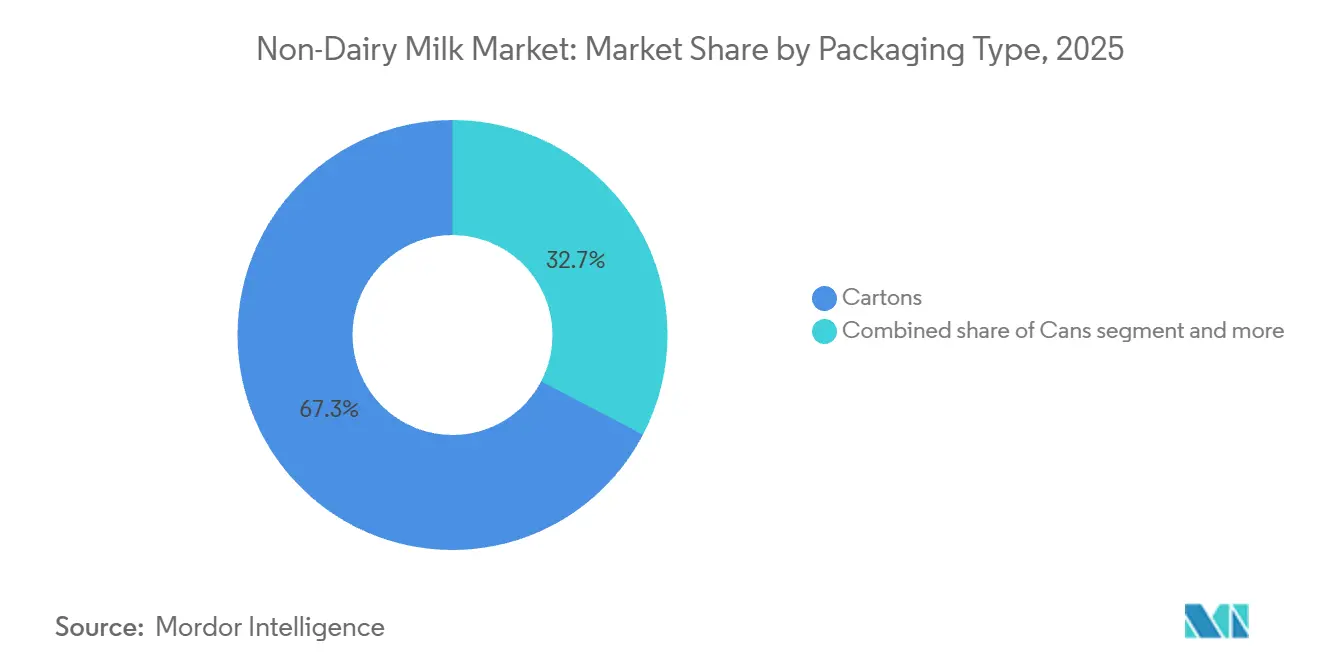
- By packaging, cartons commanded 67.81% of 2025 sales; cans are forecast to expand at a 13.28% CAGR to 2031.
- By distribution channel, off-trade captured 65.01% of 2025 revenue, whereas on-trade is projected to grow at 13.02% annually during 2026-2031.
- By region, Asia-Pacific is the fastest-growing territory with a 13.00% CAGR forecast through 2031.
Note: Market size and forecast figures in this report are generated using Mordor Intelligence’s proprietary estimation framework, updated with the latest available data and insights as of January 2026.
Global Non-Dairy Milk Market Trends and Insights
Drivers Impact Analysis*
| Driver | (~) % Impact on CAGR Forecast | Geographic Relevance | Impact Timeline |
|---|---|---|---|
| Rising lactose intolerance and dairy allergies worldwide | +2.3% | Global, with highest prevalence in Asia-Pacific (90%+ in East Asia) and moderate in Europe/North America | Long term (≥ 4 years) |
| Increasing vegan and flexitarian lifestyles | +1.8% | North America and Europe core, expanding to urban Asia-Pacific | Medium term (2-4 years) |
| Fortification with vitamins, minerals, and proteins enhancing nutrition | +2.1% | Global, particularly North America and Europe where regulatory frameworks support health claims | Medium term (2-4 years) |
| Lower calorie profiles supporting weight management | +1.5% | North America, Europe, and affluent Asia-Pacific urban centers | Short term (≤ 2 years) |
| Reduced environmental impact from lower greenhouse gas emissions | +1.9% | Europe leading, North America and Asia-Pacific following | Long term (≥ 4 years) |
| Advancements in taste and texture mimicking dairy | +2.0% | Global, with research and development concentrated in North America and Europe | Medium term (2-4 years) |
| Source: Mordor Intelligence | |||


Rising lactose intolerance and dairy allergies worldwide
A significant portion of the global population experiences some level of lactose malabsorption after infancy, with prevalence rates exceeding 90% in East Asian populations and 80% in West African communities. This genetic predisposition establishes a consistent baseline demand for lactose-free alternatives, irrespective of dietary trends. The 2025 United States Dietary Guidelines Advisory Committee explicitly included fortified soy beverages in the dairy group and noted that other plant-based milks could qualify if they meet the nutrient profile of dairy, effectively integrating these alternatives into federal nutrition policy. Similarly, Japan's Ministry of Health, Labour and Welfare has updated school lunch guidelines to include non-dairy options, reflecting demographic changes as the aging population increasingly reports digestive issues with traditional milk. The regulatory inclusion of plant-based alternatives in public sector procurement such as hospitals, schools, and the military serves as a significant driver of demand that remains unaffected by changes in consumer preferences.
Increasing vegan and flexitarian lifestyles
While self-identified veganism remains below 5% in most Western markets, flexitarian behavior, which refers to the periodic substitution of animal products with plant-based alternatives, has become mainstream. A 2024 survey conducted in the United Kingdom revealed that 56% of consumers purchased plant-based milk at least once a month. However, the Agriculture and Horticulture Development Board reported a decline in flexitarian self-identification from 23.2% to 21.5% between 2023 and 2024. This suggests that the adoption of plant-based products may be stabilizing in mature markets [1]Source: AHDB, “Flexitarian Numbers Fall as Consumers Seek Value,” ahdb.org.uk. Generational cohorts provide a more strategic perspective: Generation Z consumers in urban areas of China and India are increasingly adopting plant-based options, not for ethical reasons, but as status symbols associated with Western lifestyle branding. For instance, Starbucks China introduced oat-milk lattes in 2020 and expanded the offering nationwide by 2024, integrating non-dairy milk into the daily routines of millions of middle-class consumers. This diffusion mechanism, which focuses on premiumization through coffee-shop channels, avoids the need for ideological alignment and instead capitalizes on aspirational consumption patterns.
Fortification with vitamins, minerals, and proteins enhancing nutrition
The European Food Safety Authority's 2024 guidance on nutrient bioavailability in fortified plant-based beverages introduced stricter thresholds for calcium and vitamin D claims. Manufacturers are now required to demonstrate absorption rates comparable to those of dairy products. This regulatory change provides an advantage to established companies with significant research and development budgets capable of funding clinical trials, while smaller entrants face challenges in meeting these evidentiary standards. Ripple Foods' pea-protein formulation offers 8 grams of protein per serving and contains 50% more calcium than dairy milk, making it well-suited for institutional buyers, such as school districts, that must comply with federal nutrition benchmarks. Furthermore, the United States Food and Drug Administration's (FDA) 2024 update to the "healthy" definition encourages fortification by allowing products that meet nutrient-density criteria to display front-of-pack claims. This creates a competitive advantage for brands that prioritize investments in ingredient science. The strategic implication is that fortification is transitioning from being a marketing feature to becoming a regulatory requirement for securing premium shelf placement.
Lower calorie profiles supporting weight management
Unsweetened almond milk typically contains 30-40 calories per 240-milliliter serving, which is significantly lower compared to 150 calories for whole dairy milk. This calorie difference resonates strongly with weight-conscious consumers and clinical dietitians who prioritize lower-calorie options. The 2025 Dietary Guidelines Advisory Committee's modeling scenarios included plant-based milks in "healthy dietary patterns" for weight management, further supporting the credibility of calorie-reduction claims. However, this trend faces a counter-development as protein-fortified options, such as oat milk with added pea protein, can contain 120-140 calories per serving, narrowing the calorie gap with dairy milk by approximately 20-30%. This divergence highlights that calorie-focused positioning is most effective in the unflavored and unsweetened segment, while flavored and protein-enhanced products compete based on other nutritional attributes. Brands that do not tailor their messaging effectively, such as emphasizing calorie reduction for base products and protein content for premium offerings, risk creating confusion among retail buyers and weakening their health-focused positioning.
Restraints Impact Analysis*
| Restraint | (~) % Impact on CAGR Forecast | Geographic Relevance | Impact Timeline |
|---|---|---|---|
| Regulatory hurdles on labeling and claims | -1.2% | Europe (dairy nomenclature restrictions), fragmented compliance in Asia-Pacific | Medium term (2-4 years) |
| Supply chain volatility from crop yields | -0.9% | Global, with acute risk in California (almonds), Northern Europe (oats) | Short term (≤ 2 years) |
| Shorter shelf life for some plant-based options | -0.7% | Emerging markets with limited cold-chain infrastructure (South America, Africa) | Long term (≥ 4 years) |
| Taste inconsistencies compared to dairy milk | -1.1% | Global, particularly in markets with strong dairy traditions (Europe, South Asia) | Medium term (2-4 years) |
| Source: Mordor Intelligence | |||
Regulatory hurdles on labeling and claims
The European Court of Justice's 2017 ruling prohibits the use of dairy-related terms such as "milk," "butter," or "cheese" for plant-based products. This decision has forced brands to adopt alternative descriptors like "oat drink" or "almond beverage," which can diminish consumer recognition and create challenges for cross-border marketing [2]Source: EUR-Lex, “Judgment of the Court (Seventh Chamber) of 14 June 2017,” eur-lex.europa.eu. Furthermore, this regulatory fragmentation extends to health claims. The European Food Safety Authority (EFSA) requires clinical trials to demonstrate bioavailability for calcium and vitamin D fortification claims, a standard that many smaller brands find financially unfeasible. On the other hand, the United States Food and Drug Administration (FDA) issued guidance in 2023 allowing the use of the term "milk" for plant-based alternatives, underscoring a regulatory divide between Europe and the United States that complicates global product development. The compliance burden is particularly pronounced in the Asia-Pacific region, where countries such as India, China, and Indonesia enforce distinct labeling regulations with minimal harmonization. For instance, Danone's decision in 2024 to streamline its plant-based portfolio was partly driven by the high costs of maintaining separate formulations and packaging for each jurisdiction, which can significantly impact operational efficiency and profitability.
Supply chain volatility from crop yields
California accounts for 80% of global almond production. In 2024, the state's water-allocation restrictions reduced irrigation availability for growers by 15%, leading to tighter supply and increased raw material costs [3]Source: U.S. Department of Agriculture, “USDA Announces Water Conservation Measures in California,” usda.gov. At the same time, oat prices rose by 22% in 2024 due to drought conditions in Scandinavia and Canada, which are the primary sourcing regions for food-grade oats. These significant increases in input costs have placed considerable pressure on profit margins for brands that do not have vertical integration or commodity-hedging capabilities. Blue Diamond Growers, a cooperative managing almond orchards and processing facilities, successfully maintained stable pricing throughout 2024. However, smaller competitors faced double-digit cost increases, which they were unable to fully pass on to price-sensitive retail channels. This situation underscores the strategic importance of building supply-chain resilience through approaches such as geographic diversification, contract farming, or backward integration. As climate volatility continues to escalate, brands that rely on spot-market procurement face ongoing structural margin pressures, which restrict their ability to invest in innovation or expand their distribution networks.
*Our forecasts treat driver/restraint impacts as directional, not additive. The impact forecasts reflect baseline growth, mix effects, and variable interactions.
Segment Analysis
By Product Type: Almond Dominance Masks Hemp's Protein Surge
Almond milk is projected to account for 58.16% of the 2025 volume, reflecting its strong distribution networks and the trust it has built among consumers over more than two decades of category development. Blue Diamond's Almond Breeze brand, which was launched in 1998, has successfully leveraged vertical integration across its supply chain, including almond orchards, processing facilities, and retail partnerships. This integrated approach has enabled the brand to achieve cost efficiencies that smaller competitors find difficult to match, further solidifying its position in the market.
Hemp milk, on the other hand, is experiencing rapid growth, with an annual growth rate of 12.88% projected through 2031, making it the fastest-growing product type in the category. This growth is largely attributed to its complete amino-acid profile and omega-3 fatty acid content, which are highly valued by performance-nutrition consumers and clinical dietitians. Soy milk, which was once the leading product in the category, has now stabilized as some consumers associate it with genetically modified crops, despite the availability of non-genetically modified organism (non-GMO) variants. Coconut milk continues to serve niche markets, particularly in culinary and ethnic cuisines, but its growth potential is constrained by its high saturated-fat content, which conflicts with messaging around cardiovascular health. Meanwhile, oat milk has gained significant traction, especially in coffee-shop channels, due to its superior frothing properties. This functional advantage is highly prioritized by baristas, even more so than its nutritional attributes. Additionally, Nestlé's upcoming 2024 launch of Wunda pea-based milk in Europe is set to address the protein gap in the market, offering 7 grams of protein per serving to meet the protein benchmark traditionally associated with dairy products.


By Flavour: Premiumization Drives Flavoured Acceleration
Unflavored variants accounted for 72.99% of 2025 sales, driven by their versatility in cooking, baking, and coffee applications where added sweetness is not preferred. However, flavored offerings are projected to grow at a rate of 12.70% through 2031, supported by seasonal product launches and the inclusion of functional ingredients, which allow for 20% to 30% price premiums. For example, Califia Farms' planned 2024 launch of a turmeric-ginger oat milk and Oatly's limited-edition matcha variant demonstrate how brands are leveraging flavor to position products for wellness benefits rather than solely for taste differentiation. While chocolate and vanilla remain the top-selling flavors within the flavored segment, growth is increasingly concentrated in botanicals, adaptogens, and protein-enhanced formulations aimed at morning routines and post-workout recovery occasions.
The unflavored segment is facing commoditization pressures as private-label penetration surpasses 35% in European grocery chains, diminishing the pricing power of branded players. In contrast, flavored stock-keeping units (SKUs) secure shelf space through innovation and limited-time-offer strategies, which mitigate retailer risks. This divergence indicates that brands must either defend their unflavored market share through cost leadership and institutional contracts or shift toward premiumization in the flavored segment to maintain margin growth. Companies pursuing both strategies, such as Danone, which manages mass-market Silk alongside premium So Delicious, are reevaluating their portfolios as the middle ground becomes increasingly unsustainable.
By Packaging Type: Cans Disrupt Carton Incumbency
Cartons accounted for 67.81% of the projected 2025 volume, supported by decades of investment in aseptic filling infrastructure and widespread consumer familiarity with the Tetra Pak format. However, cans are experiencing the fastest growth among packaging types, with an annual growth rate of 13.28% through 2031. This growth is driven by aluminum's infinite recyclability and its ability to extend ambient shelf life, which helps reduce cold-chain costs. For example, Califia Farms' planned 2024 expansion into 12-ounce cans for single-serve convenience-store distribution highlights how this format enables impulse-purchase opportunities that cartons cannot address. PET (Polyethylene Terephthalate) bottles, while suitable for on-the-go consumption, are facing increasing sustainability challenges in Europe, where single-use plastic levies are rising under extended producer-responsibility mandates.
The key strategic insight is that packaging choices are increasingly influencing channel access. Cartons dominate grocery channels due to their shelf-stable economics, cans are gaining traction in convenience stores and vending machines, and PET bottles maintain relevance in gyms and travel retail due to their resealability. Brands focusing on a single packaging format risk channel lock-in, while those managing multi-format portfolios face added complexity and margin compression. For instance, Oatly's 2024 restructuring involved reducing its packaging formats from five to three, prioritizing cartons for retail and cans for foodservice applications.
By Distribution Channel: On-Trade Gains as Foodservice Standardizes
Off-trade channels, including supermarkets, hypermarkets, online retail, and convenience stores, accounted for 65.01% of projected sales in 2025. This reflects the category's focus on grocery-based origins and its emphasis on household penetration. However, on-trade channels are projected to grow at a rate of 13.02% through 2031. This growth is being driven by the increasing adoption of plant-based milk in coffee shops and the standardization of these products in hotel breakfasts, which are embedding plant-based milk into consumers' daily routines. For example, Starbucks' 2020 introduction of oat milk across China and its subsequent nationwide expansion established a consumption habit among millions of middle-class consumers who now expect non-dairy options in foodservice settings. Similarly, Marriott International's 2024 commitment to offering plant-based milk across all properties by 2026 highlights the shift of on-trade channels from niche offerings to standard practices.
Within off-trade channels, online retail is experiencing faster growth compared to brick-and-mortar outlets, particularly in the Asia-Pacific region, where e-commerce platforms such as JD.com and Tmall dominate grocery delivery services. While supermarkets and hypermarkets continue to hold the largest market share, they are facing margin pressures due to the increasing penetration of private-label products. At the same time, specialist retailers and convenience stores are capturing demand for premium products and impulse purchases, respectively.
Geography Analysis
North America accounted for 33.56% of the projected 2025 revenue, driven by two decades of category development and regulatory clarity following the United States Food and Drug Administration's (FDA) 2023 guidance permitting the use of the term "milk" on plant-based labels. However, signs of market saturation are becoming evident. The United States remains the largest single-country market, but growth is shifting toward Canada and Mexico, where household penetration is below 25%, compared to 40% in the United States. Mexico's growing middle class and proximity to United States supply chains make it an attractive target for brands seeking volume growth without the margin pressures seen in more mature markets.
The Asia-Pacific region is projected to grow at an annual rate of 13.00% through 2031, making it the fastest-growing regional market. This growth is fueled by China's expanding middle class, Japan's aging population, and India's high lactose-intolerance rate, which exceeds 60%. China's plant-based food market benefits from government dietary guidelines promoting reduced animal-protein consumption for environmental reasons. In Japan, the Ministry of Health, Labour and Welfare updated school lunch standards in 2024 to include non-dairy options. India presents a unique scenario where high lactose intolerance coexists with a strong cultural preference for dairy, leading to demand for lactose-free cow's milk that competes with plant-based alternatives. Starbucks China's nationwide oat milk rollout in 2024 has integrated non-dairy options into daily routines for urban consumers, effectively bypassing ideological barriers.
In Europe, regulatory frameworks present challenges for branding strategies. The European Court of Justice's 2017 ruling prohibits plant-based products from using dairy-related terms, requiring companies to use descriptors like "oat drink," which can reduce consumer recognition. Germany, the United Kingdom, and the Netherlands lead in household penetration, while Southern Europe, including Italy, Spain, and Portugal, lags due to stronger dairy traditions and lower lactose-intolerance rates. The European Union's Carbon Border Adjustment Mechanism, set to take effect in 2026, will impose tariffs on dairy imports based on embedded emissions, potentially creating a cost advantage for domestically produced plant-based alternatives.

Competitive Landscape
The market demonstrates moderate fragmentation, characterized by the absence of a dominant player and the presence of regional specialists alongside multinational companies. Danone, Nestlé, and Oatly hold significant shelf space in Western markets, leaving opportunities for emerging players like Ripple Foods, whose pea-protein formulation offers dairy-equivalent protein density at a lower cost. Califia Farms' 2024 Initial Public Offering (IPO) filing reflects confidence in long-term demand despite short-term volatility, while Oatly's restructuring efforts, including facility closures and debt refinancing, highlight the margin pressures faced by brands that scaled rapidly without achieving cost parity with dairy. Vertical integration is emerging as a competitive advantage, with companies like Blue Diamond controlling almond orchards and processing operations, thereby shielding themselves from commodity price fluctuations that impact competitors' margins. Patent activity is concentrated in areas such as emulsification and fortification technologies, with Oatly defending its beta-glucan processing methods and Nestlé filing for pea-protein texturization patents in 2024.
Opportunities for growth are concentrated in three key areas: on-trade foodservice standardization, where hotel chains and quick-service restaurants are incorporating plant-based milk as default options; hemp and hazelnut product development, which remain underutilized despite their superior nutritional profiles; and cold-chain expansion in emerging markets, particularly in Southeast Asia and South America, where ambient-stable formats can address infrastructure limitations. Private-label penetration in European grocery markets signals a risk of commoditization for undifferentiated brands, while flavored and protein-enhanced segments maintain premium pricing through continuous innovation. The strategic focus for companies is clear: they must either achieve cost leadership through vertical integration and scaling or focus on functional and sensory differentiation to justify premium pricing and counter private-label competition.
White-space opportunities are evident in areas such as on-trade foodservice, where plant-based milk is becoming a standard option in hotels and quick-service restaurants. Additionally, hemp and hazelnut products, which offer superior nutritional benefits, remain under-distributed. In emerging markets like Southeast Asia and South America, expanding cold-chain infrastructure can help address distribution challenges, particularly with ambient-stable formats. Companies must prioritize either achieving cost leadership through vertical integration and scale or focusing on differentiation in functionality and sensory attributes to sustain premium pricing and mitigate the risks posed by private-label penetration, which is growing in European grocery markets.
Non-Dairy Milk Industry Leaders
Danone SA
Oatly Group AB
Blue Diamond Growers
Nestlé SA
Vitasoy International Holdings Ltd
- *Disclaimer: Major Players sorted in no particular order

Recent Industry Developments
- January 2026: Ripple Foods introduced its Organic Plant-Based Milk in Original and Vanilla variants, offering 5% of protein per serving derived from pea protein. Formulated with five or fewer simple, allergen-free ingredients and free from gums or oils, the product addresses the increasing demand for nutritious, clean-label dairy alternatives and is available at select retailers in the United States.
- April 2025: Danone introduced Silk Protein, a high-protein plant-based milk alternative containing 13 grams of complete protein per serving. This product offers 50% more protein than dairy milk while containing 50% less sugar, aiming to address a market gap and renew interest in plant-based dairy products.
- May 2024: Lactalis Canada has launched Enjoy, a high‑protein, unsweetened plant-based milk range produced at its newly converted Sudbury vegan facility, strengthening its dairy-alternative portfolio, supporting ESG and climate goals, and capitalising on Canada’s fast-growing plant-based beverage market.


Global Non-Dairy Milk Market Report Scope
The non-dairy milk market comprises plant-based alternatives to traditional dairy milk, made from sources such as soy, almond, oat, coconut, rice, and pea. These beverages are designed to replicate the texture and nutritional profile of milk, driven by factors such as the growing adoption of veganism, lactose intolerance, sustainability concerns, and health-focused consumer preferences. The market is segmented by product type, including Oat Milk, Hemp Milk, Hazelnut Milk, Soy Milk, Almond Milk, Coconut Milk, and Cashew Milk; by flavor, categorized as Flavored and Unflavored; by packaging type, including Polyethylene Terephthalate (PET) Bottles, Cans, Cartons, and Others; by distribution channel, divided into On-Trade and Off-Trade, with Off-Trade further segmented into Convenience Stores, Specialist Retailers, Supermarkets and Hypermarkets, Online Retail, and Others; and by geography, covering North America, Europe, Asia-Pacific, South America, and the Middle East and Africa.The market sizing has been done in value terms in USD and volume in liters for all the abovementioned segments.
| Oat Milk |
| Hemp Milk |
| Hazelnut Milk |
| Soy Milk |
| Almond Milk |
| Coconut Milk |
| Cashew Milk |
| Flavoured |
| Un-flavoured |
| PET Bottles |
| Cans |
| Cartons |
| Others |
| On-Trade | |
| Off-Trade | Convenience Stores |
| Specialist Retailers | |
| Supermarkets and Hypermarkets | |
| On-line Retail | |
| Others |
| North America | United States |
| Canada | |
| Mexico | |
| Rest of North America | |
| Europe | Germany |
| United Kingdom | |
| Italy | |
| France | |
| Spain | |
| Netherlands | |
| Poland | |
| Belgium | |
| Sweden | |
| Rest of Europe | |
| Asia-Pacific | China |
| India | |
| Japan | |
| Australia | |
| Indonesia | |
| South Korea | |
| Thailand | |
| Singapore | |
| Rest of Asia-Pacific | |
| South America | Brazil |
| Argentina | |
| Colombia | |
| Chile | |
| Peru | |
| Rest of South America | |
| Middle East and Africa | South Africa |
| Saudi Arabia | |
| United Arab Emirates | |
| Nigeria | |
| Egypt | |
| Morocco | |
| Turkey | |
| Rest of Middle East and Africa |
| By Product Type | Oat Milk | |
| Hemp Milk | ||
| Hazelnut Milk | ||
| Soy Milk | ||
| Almond Milk | ||
| Coconut Milk | ||
| Cashew Milk | ||
| By Flavour | Flavoured | |
| Un-flavoured | ||
| By Packaging Type | PET Bottles | |
| Cans | ||
| Cartons | ||
| Others | ||
| By Distribution Channel | On-Trade | |
| Off-Trade | Convenience Stores | |
| Specialist Retailers | ||
| Supermarkets and Hypermarkets | ||
| On-line Retail | ||
| Others | ||
| By Geography | North America | United States |
| Canada | ||
| Mexico | ||
| Rest of North America | ||
| Europe | Germany | |
| United Kingdom | ||
| Italy | ||
| France | ||
| Spain | ||
| Netherlands | ||
| Poland | ||
| Belgium | ||
| Sweden | ||
| Rest of Europe | ||
| Asia-Pacific | China | |
| India | ||
| Japan | ||
| Australia | ||
| Indonesia | ||
| South Korea | ||
| Thailand | ||
| Singapore | ||
| Rest of Asia-Pacific | ||
| South America | Brazil | |
| Argentina | ||
| Colombia | ||
| Chile | ||
| Peru | ||
| Rest of South America | ||
| Middle East and Africa | South Africa | |
| Saudi Arabia | ||
| United Arab Emirates | ||
| Nigeria | ||
| Egypt | ||
| Morocco | ||
| Turkey | ||
| Rest of Middle East and Africa | ||


Market Definition
- Dairy Alternatives - Dairy alternatives are foods that are made from plant-based milk/oils instead of their usual animal products, such as cheese, butter, milk, ice cream, yogurt, etc. Plant-based or non-dairy milk alternative is the fast-growing segment in the newer food product development category of functional and specialty beverage across the globe.
- Non-Dairy Butter - Non dairy butter is a vegan butter alternative that is made from a mixture of plant oils. With an increase in alternative diets like vegetarianism, veganism, and gluten intolerance, plant butter is a healthy non-dairy substitute for normal butter.
- Non-Dairy Ice Cream - Plant based ice cream is a growing category. Non-dairy ice cream is a type of dessert made without any animal ingredients. This is typically considered a substitute for regular ice cream for those who cannot or do not eat animal or animal-derived products, including eggs, milk, cream, or honey.
- Plant-Based Milk - Plant based milks are milk substitutes that are made from nuts (e.g., hazelnuts, hemp seeds), seeds (e.g., sesame, walnuts, coconuts, cashews, almonds, rice, oats, etc.) or legumes (e.g., soy). Plant-based milk such as soy milk and almond milk have been popular in East Asia and the Middle East for centuries.
| Keyword | Definition |
|---|---|
| Cultured Butter | Cultured butter is prepared by having the raw butter go through chemical processing and has been added with certain emulsifiers and foreign ingredients. |
| Uncultured Butter | This type of butter is one which has not been processed in any way |
| Natural Cheese | The type of cheese in its most natural form. It is made from natural and simple products and ingredients, including fresh and natural salts, natural colors, enzymes, and high-quality milk. |
| Processed Cheese | Processed cheese undergoes the same processes as natural cheese; however, it requires more steps and many different forms of ingredients. Making processed cheese involves melting natural cheese, emulsifying it, and adding preservatives and other artificial ingredients or colorings. |
| Single Cream | Single cream contains around 18% fat. It’s a single layer of cream that appears over boiled milk. |
| Double Cream | Double cream contains 48% fat, more than double the amount of fat of single cream. It’s heavier and thicker than single cream |
| Whipping Cream | This has a much higher fat percentage than single cream (36%). Used to top cakes, pies, and puddings and as a thickener for sauces, soups, and fillings. |
| Frozen Desserts | Desserts that are meant to be eaten in frozen condition. E.g., sherbets, sorbets, frozen yogurts |
| UHT Milk (Ultra-high temperature milk) | Milk heated at a very high temperature. Ultra-high-temperature processing (UHT) of milk involves heating for 1–8 sec at 135–154°C. which kills the spore-forming pathogenic microorganism, resulting in a product with a shelf-life of several months. |
| Non-dairy butter/Plant-based butter | Butter made from plant-derived oil such as coconut, palm, etc. |
| Non-dairy Yogurt | Yogurt made from typically made from nuts, like almonds, cashews, coconuts, and even other foods like soybeans, plantains, oats, and peas |
| On-trade | It refers to restaurants, QSRs, and bars. |
| Off-trade | It refers to supermarkets, hypermarkets, on-line channels, etc. |
| Neufchatel cheese | One of the oldest kinds of cheese in France. It is a soft, slightly crumbly, mold-ripened, bloomy-rind cheese made in the Neufchâtel-en-Bray region of Normandy. |
| Flexitarian | It refers to a consumer preferring a semi-vegetarian diet, that is centered on plant foods with limited or occasional inclusion of meat. |
| Lactose Intolerance | Lactose intolerance is a reaction in digestive system to lactose, the sugar in milk. It causes uncomfortable symptoms in response to the consumption of dairy products. |
| Cream Cheese | Cream cheese is a soft and creamy fresh cheese with a tangy taste made from milk and cream. |
| Sorbets | Sorbet is a frozen dessert made using ice combined with fruit juice, fruit purée, or other ingredients, such as wine, liqueur, or honey. |
| Sherbet | Sherbet is a sweetened frozen dessert made with fruit and some sort of dairy product such as milk or cream. |
| Shelf stable | Foods that can be safely stored at room temperature, or "on the shelf," for at least one year and do not have to be cooked or refrigerated to eat safely. |
| DSD | Direct Store Delivery is the process in supply chain management wherein the product is delivered from manufacturing plant directly to the retailer. |
| OU Kosher | Orthodox Union Kosher is a kosher certification agency based in New York City. |
| Gelato | Gelato is a frozen creamy dessert made with milk, heavy cream and sugar. |
| Grass-fed Cows | Grass-fed cows are allowed to graze in pastures, where they eat a variety of grasses and clover. |


Research Methodology
Mordor Intelligence follows a four-step methodology in all our reports.
- Step-1: Identify Key Variables: In order to build a robust forecasting methodology, the variables and factors identified in Step 1 are tested against available historical market numbers. Through an iterative process, the variables required for market forecast are set, and the model is built on the basis of these variables.
- Step-2: Build a Market Model: Market-size estimations for the forecast years are in nominal terms. Inflation is not a part of the pricing, and the average selling price (ASP) is kept constant throughout the forecast period for each country.
- Step-3: Validate and Finalize: In this important step, all market numbers, variables, and analyst calls are validated through an extensive network of primary research experts from the market studied. The respondents are selected across levels and functions to generate a holistic picture of the market studied.
- Step-4: Research Outputs: Syndicated Reports, Custom Consulting Assignments, Databases & Subscription Platforms


