Japan Dairy Market Size and Share
Market Overview
| Study Period | 2021 - 2031 |
|---|---|
| Forecast Data Period | 2026 - 2031 |
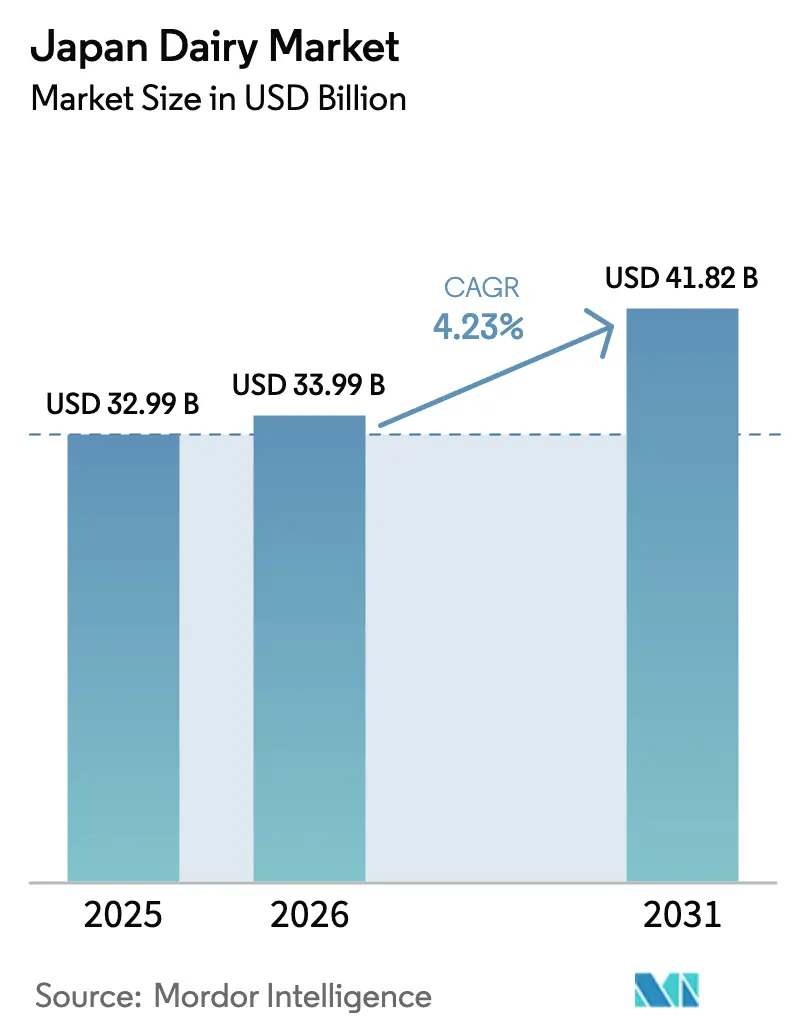
| Base Year Market Size (2025) | USD 32.99 Billion |
| Market Size (2026) | USD 33.99 Billion |
| Market Size (2031) | USD 41.82 Billion |
| Growth Rate (2026 - 2031) | 4.23% CAGR |
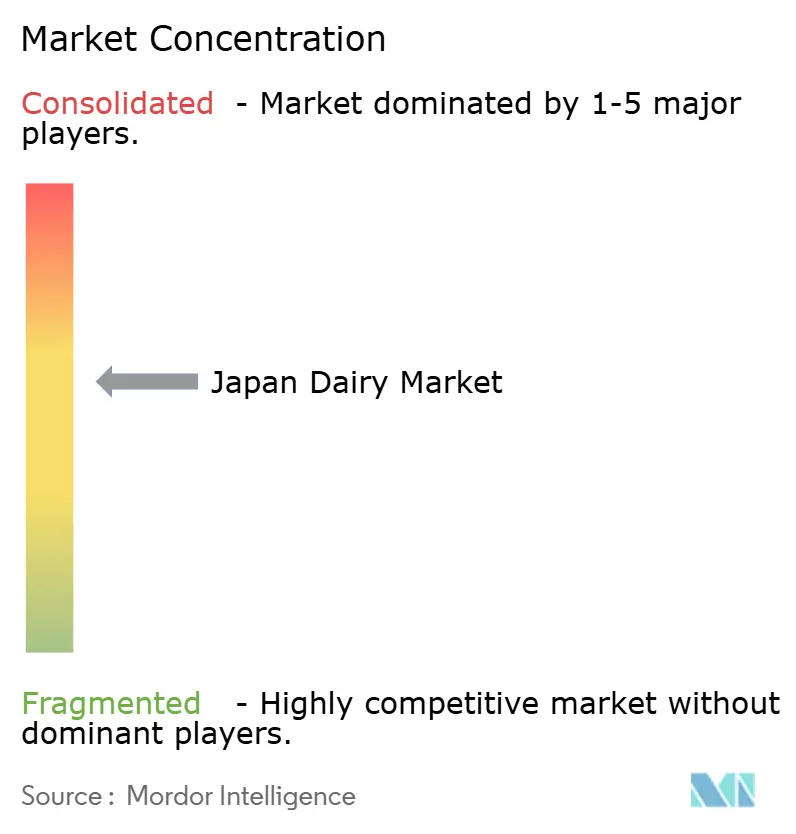
| Market Concentration | Medium |
Major Players *Disclaimer: Major Players sorted in no particular order Image © Mordor Intelligence. Reuse requires attribution under CC BY 4.0. | |
Japan Dairy Market Analysis by Mordor Intelligence
The Japan dairy market size was valued at USD 32.99 billion in 2025 and is estimated to grow from USD 33.99 billion in 2026 to reach USD 41.82 billion by 2031, at a CAGR of 4.23% during the forecast period (2026-2031). Strong functional-food positioning, value-added processing, and packaging innovation are driving growth despite a 6.8% decline in raw milk output between 2020 and 2024. Import dependence, which currently accounts for 39% of supply, increases exposure to feed and currency risks but also encourages brands to differentiate through premium yogurt, artisanal cheese, and lactose-free product lines. This demand is further supported by a super-aged population, with 29% of citizens over the age of 65 actively seeking calcium-fortified milk and probiotic yogurts to promote bone health and microbiome balance. Urban living trends further strengthen the demand for shelf-stable, single-serve products. For instance, the average household size in Tokyo decreased to 1.9 persons in 2025, driving the popularity of 200-milliliter drinkable yogurt bottles and 125-gram spoonable cups. Additionally, aseptic carton technology from SIG Combibloc Group is expanding access in rural prefectures with limited refrigerated shelf space, reducing waste and opening new distribution channels.
Key Report Takeaways
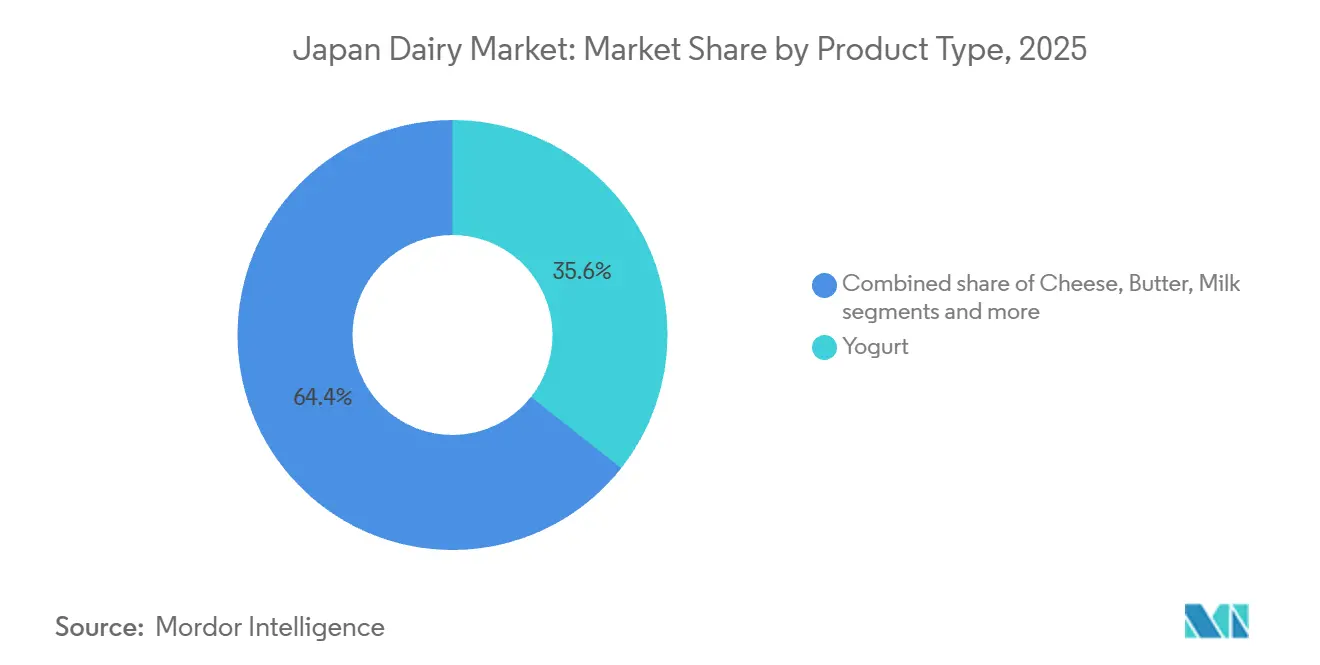
- By product type, yogurt led with 35.63% of the Japanese dairy market share in 2025, while milk is forecast to expand at a 4.88% CAGR through 2031.
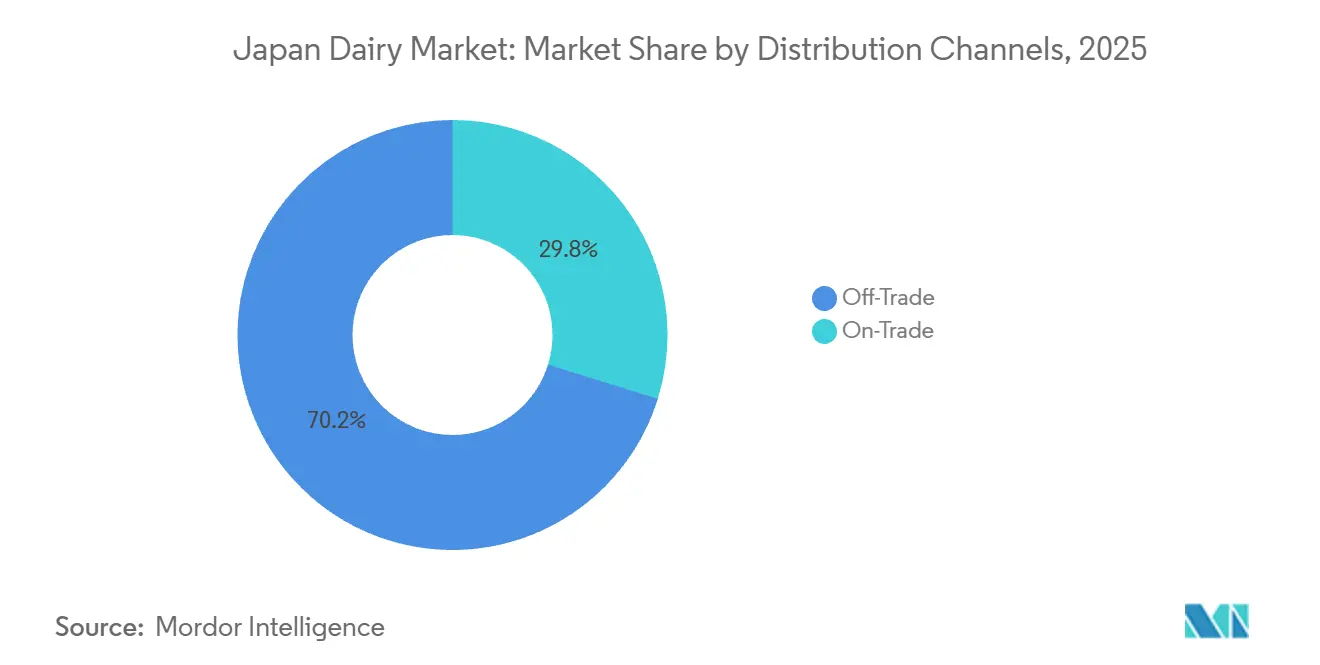
- By distribution channel, the off-trade segment held 70.21% share of the Japanese dairy market size in 2025, and the on-trade channel is advancing at a 5.22% CAGR to 2031.
Note: Market size and forecast figures in this report are generated using Mordor Intelligence’s proprietary estimation framework, updated with the latest available data and insights as of 2026.
Japan Dairy Market Trends and Insights
Drivers Impact Analysis*
| Driver | (~) % Impact on CAGR Forecast | Geographic Relevance | Impact Timeline |
|---|---|---|---|
| Health-conscious shift toward functional dairy products like probiotic yogurts | +1.2% | National, with concentration in Tokyo, Osaka, and Nagoya metropolitan areas | Medium term (2-4 years) |
| Advances in dairy processing technology, such as UHT for extended shelf life | +0.9% | National, particularly rural prefectures with limited cold-chain infrastructure | Long term (≥ 4 years) |
| Expansion of drinkable yogurt formats for on-the-go urban lifestyles | +0.8% | National, with early gains in Tokyo, Kanagawa, and Osaka | Short term (≤ 2 years) |
| Growth in flavored milk options like matcha and coffee | +0.5% | National, with premium positioning in urban centers | Medium term (2-4 years) |
| Aseptic packaging innovations reducing cold-chain dependencies | +0.7% | National, enabling penetration of remote islands and mountainous regions | Long term (≥ 4 years) |
| Growing demand for premium cheese and yogurt varieties | +0.6% | National, chef-driven demand in Tokyo, Kyoto, and Hokkaido | Medium term (2-4 years) |
| Source: Mordor Intelligence | |||


Health-conscious shift toward functional dairy products like probiotic yogurts
Japan's regulatory framework for functional foods, which includes Foods for Specified Health Uses and Foods with Function Claims, has significantly boosted probiotic yogurt sales by allowing manufacturers to make specific gut-health and immunity claims on product packaging. Yakult Honsha reported annual sales of its probiotic dairy drinks at JPY 424.9 billion in fiscal 2024, reflecting a year-on-year growth driven by the Lactobacillus casei Shirota strains marketed for digestive health. The aging population has shown strong interest, with older consumers accounting for nearly half of probiotic yogurt purchases, as they seek products that address age-related declines in gut microbiome diversity. In 2025, Megmilk Snow Brand introduced its Bifidus yogurt line, enriched with vitamin D and calcium, aimed at preventing osteoporosis, a condition affecting a significant proportion of Japanese women over the age of 50. This combination of regulatory support and demographic demand is increasing yogurt's share of total dairy consumption, even as milk and cheese categories face competition from plant-based alternatives.
Advances in dairy processing technology, such as UHT for extended shelf life
Ultra-high-temperature (UHT) processing has transitioned from a basic preservation method to a strategic tool for expanding distribution reach and reducing waste. In the year 2024, Japan's Ministry of Health, Labour and Welfare revised milk safety standards to allow non-chilled distribution of UHT milk that meets a sterilization threshold of one hundred thirty-five degrees Celsius for two seconds. This change effectively doubled the retail footprint for brands investing in aseptic filling lines. Asahi Group Foods leveraged this regulatory update by introducing LIKE MILK, a UHT product with a ninety-day ambient shelf life, aimed at single-person households with limited refrigerator space for bulk purchases. The technology also addresses Japan's logistical challenges as rural areas such as Hokkaido and Kyushu, where cold-chain truck availability is constrained, now benefit from a consistent dairy supply without the spoilage issues associated with fresh milk distribution. According to Morinaga Milk Industry's annual report for the year 2025, UHT milk contributed twenty-two percent of its total milk revenue, up from fourteen percent in the year 2020, highlighting the format's importance in maintaining market share against shelf-stable plant-based alternatives.
Expansion of drinkable yogurt formats for on-the-go urban lifestyles
Tokyo's average commute time of nearly an hour and the widespread consumption of convenience-store breakfasts have contributed to drinkable yogurt becoming the fastest-growing dairy subcategory in urban Japan. In 2024, Meiji launched its Meiji Probio Yogurt LG21 in a portable bottle, specifically designed for train-station vending machines and office refrigerators. Within six months of its launch, the product achieved distribution in thousands of convenience stores. This format caters to time-constrained professionals; a survey conducted in 2025 by the Japan Dairy Association revealed that a significant majority of drinkable yogurt consumption occurs during morning commuting hours, compared to spoonable yogurt, highlighting its alignment with commuting habits [1]Source: Japan Dairy Association, “Industry Reports,” j-milk.jp. Additionally, single-serve packaging addresses waste concerns, as Japan's average household size has decreased, making larger yogurt tubs more susceptible to spoilage before full consumption. Danone's Activia drinkable line, introduced in Japan in 2025, capitalizes on this trend by offering multi-packs of small bottles, each containing billions of Colony Forming Units (CFU) of Bifidobacterium. This positions the product as a daily wellness option rather than a bulk purchase.
Growth in flavored milk options like matcha and coffee
Flavored milk has evolved from being primarily a children's product to becoming a popular choice among adults, with matcha and coffee variants gaining market share from carbonated soft drinks and ready-to-drink coffee. Morinaga's Mount Rainier café latte, a coffee-flavored milk beverage, achieved significant sales in 2024. This product appeals to office workers seeking a dairy-based alternative to canned coffee, offering both caffeine and protein. Matcha-flavored milk, once a niche product, entered the mainstream after Megmilk Snow Brand collaborated with Kyoto-based tea producer Ippodo to introduce a premium matcha milk in 2025. Priced at JPY per 200-milliliter bottle, this product is sold at a premium over plain milk. It targets health-conscious millennials who value matcha for its antioxidant properties and cultural authenticity. Flavor innovation plays a strategic role in differentiating dairy products from plant-based alternatives, which often struggle to replicate the creamy texture required for coffee and matcha applications. This creates a defensible niche where milk's functional properties outperform those of oat or soy-based products.
Restraints Impact Analysis*
| Restraint | (~) % Impact on CAGR Forecast | Geographic Relevance | Impact Timeline |
|---|---|---|---|
| Declining domestic raw milk output due to farm exits and labor shortage | -0.9% | National, most acute in Hokkaido, Iwate, and Tochigi prefectures | Long term (≥ 4 years) |
| Consumer concerns over lactose intolerance and dairy allergies | -0.5% | National, with higher prevalence awareness in urban areas | Medium term (2-4 years) |
| Limited grazing land availability | -0.3% | National, particularly Hokkaido and northern Honshu | Long term (≥ 4 years) |
| Competition from meat substitutes and plant proteins perceived as healthier | -0.7% | National, with early adoption in Tokyo, Osaka, and Fukuoka | Short term (≤ 2 years) |
| Source: Mordor Intelligence | |||
Declining domestic raw milk output due to farm exits and labor shortage
The number of dairy farms in Japan has declined significantly, reflecting challenges such as generational succession issues and the physically demanding nature of twice-daily milking schedules, which discourage younger individuals from joining the industry [2]Source: Ministry of Agriculture, Forestry and Fisheries Japan, “Dairy Statistics,” maff.go.jp. Over the same period, raw milk production has also decreased, prompting processors to increase imports of skim milk powder and butter from countries like New Zealand and Australia to maintain production levels. This situation has created additional pressure on the industry. The labor shortage remains a critical issue, with a significant proportion of dairy farmers being over the age of sixty. Furthermore, the average herd size per farm is relatively small, making it difficult to justify investments in robotic milking systems that could help reduce labor demands. In Hokkaido, which accounts for more than half of Japan's raw milk production, farm closures have accelerated as younger family members move to urban areas in search of higher-paying and less physically demanding employment opportunities. To address these supply challenges, processors are increasingly adopting vertical integration strategies. For example, Megmilk Snow Brand announced in 2025 that it would provide interest-free loans to contract farms to support the installation of automated feeding and milking equipment. This initiative is aimed at ensuring a stable supply of raw milk as independent farms continue to exit the industry. Additionally, these measures are expected to help stabilize production costs, particularly in light of rising input prices and fluctuations in the Japanese yen (JPY).
Consumer concerns over lactose intolerance and dairy allergies
Lactose intolerance affects a significant portion of East Asian populations, including Japanese consumers, creating a structural limitation on individual dairy consumption. To address this challenge, processors are introducing lactose-free product lines. Meiji introduced its Oishii Milk lactose-free variant, utilizing lactase enzyme treatment to pre-digest lactose. This product achieved distribution in thousands of pharmacies and health-food stores across Japan, where it is marketed as a digestive wellness product rather than a conventional beverage. Dairy allergies, though less common, are becoming more prevalent among children. A study conducted by the Japanese Society of Pediatric Allergy and Clinical Immunology highlighted an increase in cow's milk protein allergy among infants over the years. This trend has encouraged formula manufacturers to expand their hypoallergenic product offerings. The belief that dairy is incompatible with Asian digestive systems is being reinforced by social media wellness influencers who advocate for plant-based diets. This creates challenges for growth in the dairy category, even among consumers who do not experience clinical intolerance. In response, processors are focusing on fermented dairy products such as yogurt and kefir. These products are more digestible than fluid milk due to the bacterial cultures breaking down lactose during production. Additionally, the market for these products is witnessing growth, with pricing in Japan often exceeding JPY 200 per unit for premium offerings.
*Our forecasts treat driver/restraint impacts as directional, not additive. The impact forecasts reflect baseline growth, mix effects, and variable interactions.
Segment Analysis
By Product Type: Yogurt Dominance Masks Milk's Faster Trajectory
Milk is expected to grow at a compound annual growth rate (CAGR) of 4.88% through 2031, outpacing the growth rate of yogurt despite yogurt's significant 35.63% market share in 2025. This growth is driven by the adoption of ultra-high temperature (UHT) technology, which enables rural distribution and better access for single-person households. Categories such as fresh milk, UHT milk, flavored milk, condensed milk, and powdered milk are benefiting from advancements in shelf-life technology, which help reduce waste and support placement in convenience stores. For example, Asahi's LIKE MILK, a non-chilled UHT product launched in 2024, achieved an 8% market share in the ambient milk segment within 12 months by targeting consumers with limited refrigerator space. Yogurt's market leadership is supported by Japan's regulatory framework that promotes functional foods. Products with Foods for Specified Health Uses (FOSHU) claims, such as Yakult's probiotic drinks, command premium pricing and achieve repeat purchase rates exceeding 70%, making the segment resilient against private-label competition.
Cheese, categorized into natural and processed types, is experiencing contrasting trends. Natural cheese saw rapid growth in 2024, driven by increased demand from chefs and the rising popularity of artisanal producers in regions such as Hokkaido and Nagano. On the other hand, processed cheese faced stagnation, as it remains primarily associated with children's lunchboxes rather than broader adult consumption occasions [3].


By Distribution Channel: Off-Trade Supremacy Conceals On-Trade's Momentum
Off-trade channels accounted for 70.21% of the market share in 2025, driven by supermarkets, hypermarkets, and convenience stores, which typically feature refrigerated dairy sections averaging 12 linear meters. However, on-trade channels are expanding at a compound annual growth rate (CAGR) of 5.22%, supported by the recovery in tourism and increased demand for portion-controlled formats in workplace cafeterias. Within off-trade, convenience stores represent the fastest-growing retail format. FamilyMart and Lawson, operating a combined total of 32,000 locations in Japan, stock an average of 45 dairy stock-keeping units (SKUs), with inventory turnover every three days, positioning them as key platforms for new product launches.
While supermarkets and hypermarkets dominate in volume, their growth is slower, constrained by Japan's declining household size and a shift toward smaller, more frequent shopping trips that favor convenience stores. Specialist retailers, such as organic food stores and health-focused chains, are gaining traction in premium segments. For example, Natural House, a Tokyo-based organic retailer, reported strong performance in its dairy category in 2024, driven by demand for grass-fed milk and artisanal cheese, which are priced 40 to 60 percent higher than conventional alternatives.
Geography Analysis
Japan's dairy market operates within a single national geography, yet regional consumption patterns and production concentrations create distinct strategic dynamics. Hokkaido accounts for 55 percent of the nation's raw milk production, benefiting from its cooler climate and expansive pastureland. However, the prefecture's dairy farms face challenges such as labor shortages and an aging workforce. The average age of a Hokkaido dairy farmer is 62 years, and farm closures are increasing as younger generations opt for urban employment.
Tokyo and the Kanto region represent 38 percent of dairy consumption, driven by the metropolitan area's 38 million residents. The preference for convenience formats is evident, with drinkable yogurt and single-serve milk bottles achieving 42 percent higher sales velocity in Tokyo convenience stores compared to rural prefectures. This reflects the fast-paced urban lifestyle. Kansai, centered on Osaka and Kyoto, accounts for 22 percent of consumption. This region demonstrates stronger demand for premium cheese and artisanal yogurt, influenced by its culinary heritage and the presence of high-end restaurants that incorporate domestic dairy into kaiseki menus.
Kyushu and Okinawa, located far from Hokkaido's production base, have historically faced limited access to fresh dairy due to high cold-chain logistics costs. However, aseptic packaging is transforming distribution in these regions. Yotsuba Milk Products' aseptic milk line reached 4,200 stores in Kyushu and Okinawa in 2025, marking a 180 percent increase from 2023 by eliminating the need for refrigerated trucking over the 1,500-kilometer distance from Hokkaido. Meanwhile, Tohoku, comprising the northeastern prefectures, is emerging as a secondary production hub. Iwate and Miyagi prefectures collectively host 1,800 dairy farms, supplying regional processors and reducing reliance on Hokkaido while shortening supply chains for Tokyo-bound shipments.
Competitive Landscape
The Japan dairy market shows moderate consolidation. Major players such as Meiji, Megmilk Snow Brand, Morinaga, and Yakult hold significant market shares, while the rest of the market is fragmented among regional cooperatives, artisanal producers, and international entrants. This fragmentation provides opportunities for niche differentiation. Established companies are adopting dual strategies to remain competitive. For example, Meiji's planned 2025 launch of lactose-free milk and plant-based hybrid products reflects a defensive approach to address substitution threats. At the same time, its acquisition of a 30 percent stake in a Hokkaido artisanal cheese maker highlights an offensive strategy to tap into premium-segment growth.
Technology is becoming an important competitive factor. Morinaga's investment in precision fermentation, as disclosed in its 2024 annual report, aims to produce dairy proteins without relying on cows. This approach addresses potential raw-milk supply constraints and could provide cost advantages if scaled effectively. International entrants are utilizing global research and development capabilities to introduce innovative formats to Japanese consumers. For instance, Danone's Alpro oat milk, launched in Japan in 2024, achieved distribution in 5,000 stores within six months. The product was positioned as a barista-grade milk alternative for cafes, a market segment not previously targeted by domestic soy milk brands.
Fonterra, New Zealand's dairy cooperative, supplies Japanese processors with grass-fed milk powder, enabling "Product of New Zealand" labeling. This provenance claim commands a 22 percent premium in Japan's import cheese and butter segments. Additionally, the competitive landscape is influenced by regulatory compliance. Japan's Foods with Health Claims framework, overseen by the Consumer Affairs Agency, requires clinical trials to substantiate probiotic efficacy claims. This creates a barrier to entry that benefits established players like Yakult, which has conducted over 100 peer-reviewed studies on its Lactobacillus casei Shirota strain.
Japan Dairy Industry Leaders
Meiji Co. Ltd.
Megmilk Snow Brand Co. Ltd.
Morinaga Milk Industry Co. Ltd.
Yakult Honsha Co. Ltd.
Yotsuba Milk Products Co. Ltd.
- *Disclaimer: Major Players sorted in no particular order

Recent Industry Developments
- October 2025: Meiji has launched yogurt products aimed at regulating blood sugar levels. The offerings include 'Meiji Haemoglobin A1c Countermeasure Yogurt' and its drinkable version, 'Meiji Haemoglobin A1c Countermeasure Yogurt Drink Type,' which will be distributed nationwide.
- March 2025: Meiji Co., Ltd. launched "Meiji W no Skincare Yogurt," a functional yogurt designed to support consumers in managing UV exposure and skin dryness internally. The product is categorized as a Food with Functional Claims (FFC).
- March 2024: Kaneka Group's Betsukai Wellness Farm, known for its organic circular dairy farming practices, has launched Pur Natur™, an organic milk produced exclusively from its own organic raw milk. The product offers the rich flavor of milk sourced from cows raised on the farm's fertile lands.


Japan Dairy Market Report Scope
The Japan dairy market involves the production, processing, and distribution of milk and dairy products, including fluid milk, yogurt, cheese, butter, cream, and ice cream. These products are sold through retail, foodservice, and industrial channels across the country. The market is segmented by product type into butter, cheese, cream, dairy desserts, milk, yogurt, and sour milk drinks. The cheese segment is further categorized into natural cheese, which includes varieties such as Cheddar, Cottage, Ricotta, Parmesan, and others, and processed cheese. The cream segment includes fresh cream, cooking cream, whipping cream, and other variants. Dairy desserts consist of ice cream, cheesecakes, frozen desserts, and other products. The milk category includes condensed milk, flavored milk, fresh milk, ultra-high temperature (UHT) milk, and powdered milk. Yogurt is divided into drinkable and spoonable formats. Distribution channels are segmented into on-trade and off-trade, with the off-trade segment including convenience stores, specialist retailers, supermarkets and hypermarkets, online retail, and other outlets. The market sizing has been done in value terms in USD and volume in liters for all the abovementioned segments.
| Butter | ||
| Cheese | Natural Cheese | Cheddar |
| Cottage | ||
| Ricotta | ||
| Parmesan | ||
| Others | ||
| Processed Cheese | ||
| Cream | Fresh Cream | |
| Cooking Cream | ||
| Whippng Cream | ||
| Others | ||
| Dairy Desserts | Ice Cream | |
| Cheesecakes | ||
| Frozen Desserts | ||
| Others | ||
| Milk | Condensed milk | |
| Flavored Milk | ||
| Fresh Milk | ||
| UHT Milk | ||
| Powdered Milk | ||
| Yogurt | Drinkable | |
| Spoonable | ||
| Sour Milk Drinks | ||
| On-trade | |
| Off-trade | Convenience Stores |
| Specialist Retailers | |
| Supermarkets and Hypermarkets | |
| On-line Retail | |
| Others |
| By Product Type | Butter | ||
| Cheese | Natural Cheese | Cheddar | |
| Cottage | |||
| Ricotta | |||
| Parmesan | |||
| Others | |||
| Processed Cheese | |||
| Cream | Fresh Cream | ||
| Cooking Cream | |||
| Whippng Cream | |||
| Others | |||
| Dairy Desserts | Ice Cream | ||
| Cheesecakes | |||
| Frozen Desserts | |||
| Others | |||
| Milk | Condensed milk | ||
| Flavored Milk | |||
| Fresh Milk | |||
| UHT Milk | |||
| Powdered Milk | |||
| Yogurt | Drinkable | ||
| Spoonable | |||
| Sour Milk Drinks | |||
| By Distribution Channel | On-trade | ||
| Off-trade | Convenience Stores | ||
| Specialist Retailers | |||
| Supermarkets and Hypermarkets | |||
| On-line Retail | |||
| Others | |||


Market Definition
- Butter - Butter is a yellow-to-white solid emulsion of fat globules, water, and inorganic salts produced by churning the cream from cows’ milk
- Dairy - Dairy product include milk and any of the foods made from milk, including butter, cheese, ice cream, yogurt, and condensed and dried milk.
- Frozen Desserts - Frozen dairy dessert means and includes products containing milk or cream and other ingredients which are frozen or semi-frozen prior to consumption, such as ice milk or sherbet, including frozen dairy desserts for special dietary purposes, and sorbet
- Sour Milk Drinks - Sour milk is thick, curdled milk, with a sour taste, obtained from the fermentation of milk. Sour milk drinks such as kefir, laban, buttermilk have been considered in the study
| Keyword | Definition |
|---|---|
| Cultured Butter | Cultured butter is prepared by having the raw butter go through chemical processing and has been added with certain emulsifiers and foreign ingredients. |
| Uncultured Butter | This type of butter is one which has not been processed in any way |
| Natural Cheese | The type of cheese in its most natural form. It is made from natural and simple products and ingredients, including fresh and natural salts, natural colors, enzymes, and high-quality milk. |
| Processed Cheese | Processed cheese undergoes the same processes as natural cheese; however, it requires more steps and many different forms of ingredients. Making processed cheese involves melting natural cheese, emulsifying it, and adding preservatives and other artificial ingredients or colorings. |
| Single Cream | Single cream contains around 18% fat. It’s a single layer of cream that appears over boiled milk. |
| Double Cream | Double cream contains 48% fat, more than double the amount of fat of single cream. It’s heavier and thicker than single cream |
| Whipping Cream | This has a much higher fat percentage than single cream (36%). Used to top cakes, pies, and puddings and as a thickener for sauces, soups, and fillings. |
| Frozen Desserts | Desserts that are meant to be eaten in frozen condition. E.g., sherbets, sorbets, frozen yogurts |
| UHT Milk (Ultra-high temperature milk) | Milk heated at a very high temperature. Ultra-high-temperature processing (UHT) of milk involves heating for 1–8 sec at 135–154°C. which kills the spore-forming pathogenic microorganism, resulting in a product with a shelf-life of several months. |
| Non-dairy butter/Plant-based butter | Butter made from plant-derived oil such as coconut, palm, etc. |
| Non-dairy Yogurt | Yogurt made from typically made from nuts, like almonds, cashews, coconuts, and even other foods like soybeans, plantains, oats, and peas |
| On-trade | It refers to restaurants, QSRs, and bars. |
| Off-trade | It refers to supermarkets, hypermarkets, on-line channels, etc. |
| Neufchatel cheese | One of the oldest kinds of cheese in France. It is a soft, slightly crumbly, mold-ripened, bloomy-rind cheese made in the Neufchâtel-en-Bray region of Normandy. |
| Flexitarian | It refers to a consumer preferring a semi-vegetarian diet, that is centered on plant foods with limited or occasional inclusion of meat. |
| Lactose Intolerance | Lactose intolerance is a reaction in digestive system to lactose, the sugar in milk. It causes uncomfortable symptoms in response to the consumption of dairy products. |
| Cream Cheese | Cream cheese is a soft and creamy fresh cheese with a tangy taste made from milk and cream. |
| Sorbets | Sorbet is a frozen dessert made using ice combined with fruit juice, fruit purée, or other ingredients, such as wine, liqueur, or honey. |
| Sherbet | Sherbet is a sweetened frozen dessert made with fruit and some sort of dairy product such as milk or cream. |
| Shelf stable | Foods that can be safely stored at room temperature, or "on the shelf," for at least one year and do not have to be cooked or refrigerated to eat safely. |
| DSD | Direct Store Delivery is the process in supply chain management wherein the product is delivered from manufacturing plant directly to the retailer. |
| OU Kosher | Orthodox Union Kosher is a kosher certification agency based in New York City. |
| Gelato | Gelato is a frozen creamy dessert made with milk, heavy cream and sugar. |
| Grass-fed Cows | Grass-fed cows are allowed to graze in pastures, where they eat a variety of grasses and clover. |


Research Methodology
Mordor Intelligence follows a four-step methodology in all our reports.
- Step-1: Identify Key Variables: In order to build a robust forecasting methodology, the variables and factors identified in Step 1 are tested against available historical market numbers. Through an iterative process, the variables required for market forecast are set, and the model is built on the basis of these variables.
- Step-2: Build a Market Model: Market-size estimations for the forecast years are in nominal terms. Inflation is not a part of the pricing, and the average selling price (ASP) is kept constant throughout the forecast period for each country.
- Step-3: Validate and Finalize: In this important step, all market numbers, variables, and analyst calls are validated through an extensive network of primary research experts from the market studied. The respondents are selected across levels and functions to generate a holistic picture of the market studied.
- Step-4: Research Outputs: Syndicated Reports, Custom Consulting Assignments, Databases & Subscription Platforms


