Australia Non-Dairy Milk Market Size and Share
Market Overview
| Study Period | 2021 - 2031 |
|---|---|
| Forecast Data Period | 2026 - 2031 |
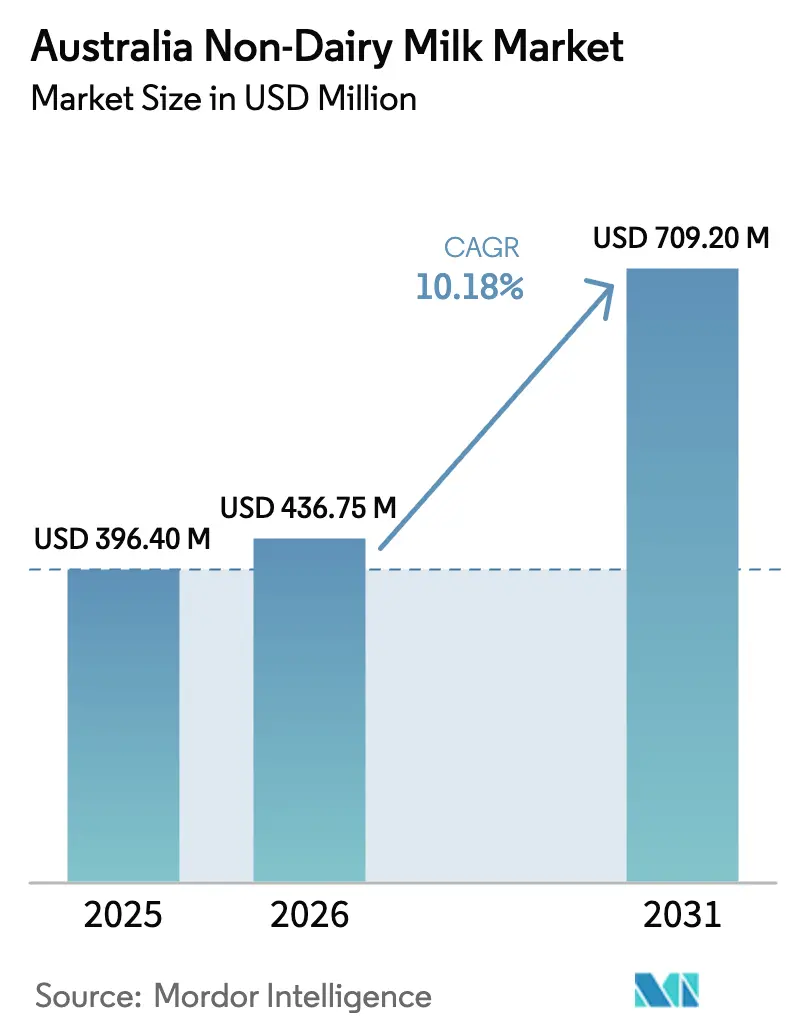
| Base Year Market Size (2025) | USD 396.40 Million |
| Market Size (2026) | USD 436.75 Million |
| Market Size (2031) | USD 709.2 Million |
| Growth Rate (2026 - 2031) | 10.18% CAGR |
| Market Concentration | Medium |
Major Players
*Disclaimer: Major Players sorted in no particular order Image © Mordor Intelligence. Reuse requires attribution under CC BY 4.0. |
|
Australia Non-Dairy Milk Market Analysis by Mordor Intelligence
Australia non-dairy milk market size in 2026 is estimated at USD 436.75 million, growing from 2025 value of USD 396.40 million with 2031 projections showing USD 709.2 million, growing at 10.18% CAGR over 2026-2031. This growth is primarily driven by a significant shift in consumer preferences away from traditional bovine dairy. Contributing factors include increased health awareness, greater scrutiny of the environmental impact of livestock production, and a surge in product innovations addressing previous taste and functionality gaps. Soy milk remains the market leader due to its dairy-like protein profile and established household familiarity. However, the growing popularity of hemp milk highlights a shift toward crops offering complete proteins and perceived as more sustainable due to their lower input requirements. The market's expansion is further supported by diversified product offerings, such as fortified beverages with added vitamins and minerals, and increased penetration in foodservice channels like cafes and restaurants. Additionally, regional growth beyond urban centers is driven by rising health consciousness and the availability of plant-based options in smaller markets. The competitive landscape is moderately to highly intense. However, the market faces challenges, including potential ACCC restrictions on using the term “milk” for plant-based products, domestic almond supply volatility caused by drought, and consumer resistance to ultra-processed additives. On the upside, farmgate dairy prices have been declining since late 2024, narrowing historical cost gaps and creating opportunities for volume growth in Australia's non-dairy milk sector.
Key Report Takeaways
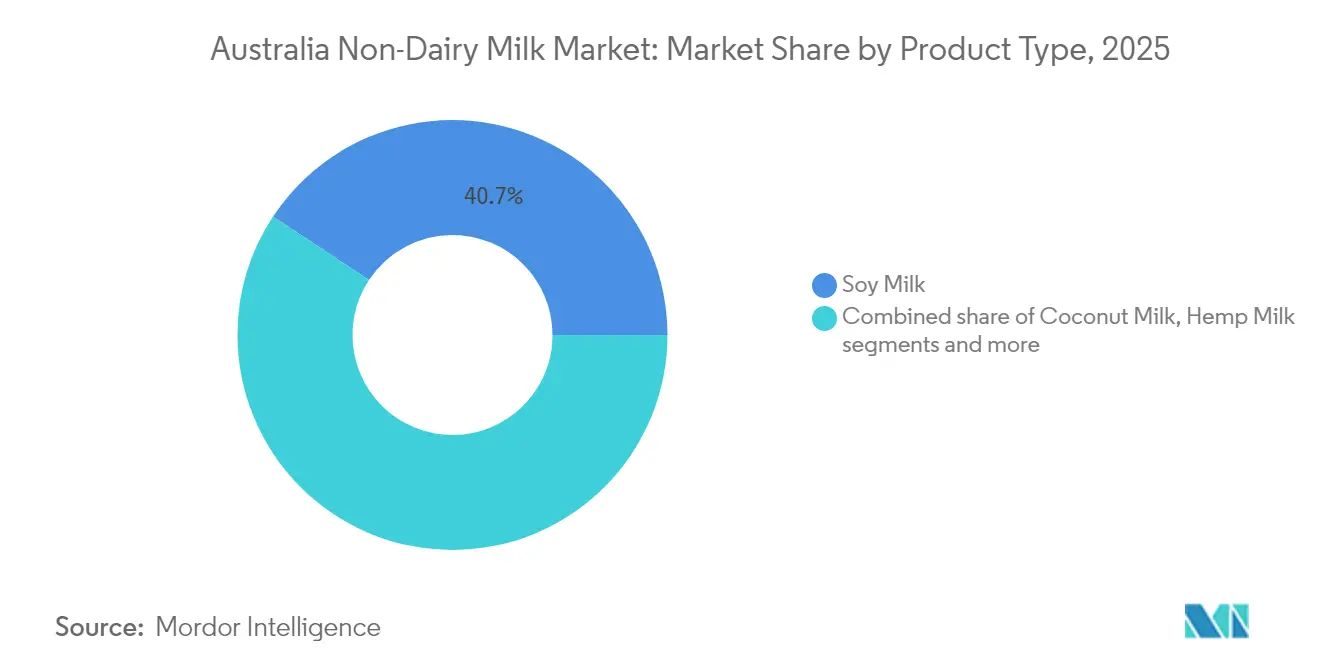
- By product type, soy captured 40.72% of the Australia non-dairy milk market share in 2025. Hemp milk is projected to expand at a 12.03% CAGR through 2031, the fastest among all product categories.
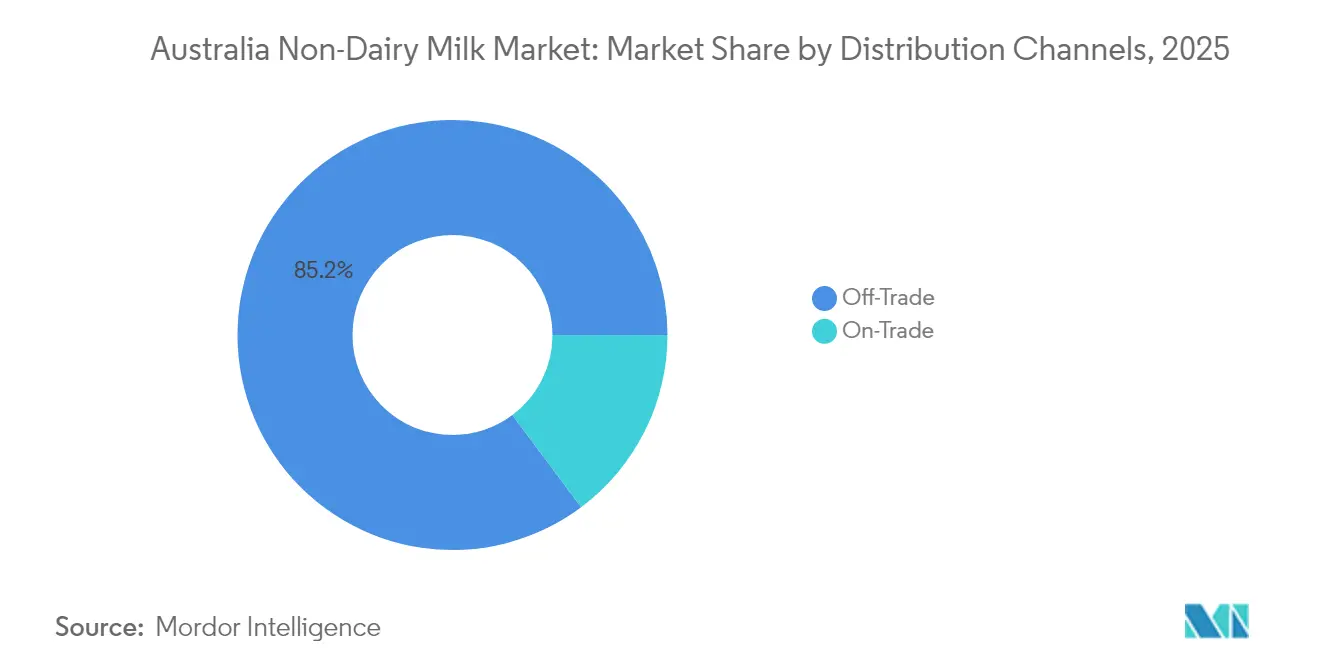
- By distribution channel, off-trade accounted for 85.21% of the Australia non-dairy milk market size in 2025 and is advancing at a 11.86% CAGR through 2031.
Note: Market size and forecast figures in this report are generated using Mordor Intelligence’s proprietary estimation framework, updated with the latest available data and insights as of 2026.
Australia Non-Dairy Milk Market Trends and Insights
Drivers Impact Analysis*
| Driver | (~) % Impact on CAGR Forecast | Geographic Relevance | Impact Timeline |
|---|---|---|---|
| Rising Plant-Based Lifestyle Trends | +2.8% | National, with stronger penetration in metropolitan areas | Medium term (2-4 years) |
| Influence of Food Movements and Social Media | +1.9% | National, concentrated among 18-34 demographics | Short term (≤ 2 years) |
| Rising lactose-intolerance and dairy-allergy prevalence | +1.5% | National, with higher prevalence in urban populations | Long term (≥ 4 years) |
| Rapid product innovation and barista functionality | +2.1% | National, with foodservice concentration in major cities | Medium term (2-4 years) |
| Retail private-label expansion driving penetration | +1.7% | National, led by Woolworths and Coles networks | Short term (≤ 2 years) |
| Australia-specific carbon-labelling mandates | +0.8% | National, with early implementation in packaged goods | Long term (≥ 4 years) |
| Source: Mordor Intelligence | |||


Rising plant-based lifestyle trends
Plant-based adoption accelerates beyond dietary restrictions toward lifestyle identity formation. Among people 15 years and over, one in twenty (5.3%) people were vegetarian or vegan in 2023, according to the Australian Bureau of Statistics[1]Source: Australian Bureau of Statistics, "Dieting and food avoidance", www.abs.gov.au . This demographic shift highlights a significant change in consumer behavior, driven by younger generations who are establishing purchasing habits that are likely to persist throughout their lives. Social media platforms, particularly those focused on visual content, have played a pivotal role in amplifying plant-based messaging. These platforms often showcase visually appealing coffee preparations, which not only attract initial interest but also encourage repeat purchases. Additionally, the growing popularity of cold coffee among young Australians has created new opportunities for increased non-dairy milk consumption in both cafe and home settings. While health considerations initially spurred the adoption of plant-based diets, the trend has evolved to include broader motivations such as environmental sustainability and ethical values. These diverse and interconnected drivers not only sustain the momentum of plant-based adoption but also enable consumers to accept premium pricing for these products.
Influence of food movements and social media
Digital food movements are significantly influencing consumer perceptions by leveraging authentic storytelling to position plant-based choices as both forward-thinking and environmentally sustainable. When it comes to reducing dairy consumption, environmental citizenship proves to be a more compelling motivator than health-related messaging. Consumers increasingly view their dietary decisions as tangible expressions of their commitment to environmental responsibility. According to the World Bank, 97% of individuals in Australia were internet users in 2023[2]Source: World Bank, "Individuals using the Internet", www.worldbank.org, reflecting a growing digital presence. Social media platforms have become essential tools for spreading awareness, enabling users to share insights on product functionality, adapt recipes, and compare brands, which collectively drive faster market penetration. Partnerships with influencers from coffee culture and wellness communities create aspirational connections, helping to address traditional challenges related to taste and texture. Furthermore, consumer behavior studies highlight a strong link between word-of-mouth recommendations and enthusiasm for plant-based milk, with passionate advocates playing a key role in encouraging others to try these products.
Rising lactose-intolerance and dairy-allergy prevalence
The increasing prevalence of lactose intolerance and dairy allergies in Australia is driving significant growth in the non-dairy milk market. Lactose-intolerant individuals, due to a lack of sufficient lactase enzyme, face challenges digesting lactose in dairy, often experiencing symptoms such as bloating, cramps, and diarrhea. This prompts many to avoid traditional dairy products. Consequently, the demand for lactose-free and plant-based milk alternatives, such as almond, oat, soy, and coconut milk, is rising. These alternatives not only help consumers avoid discomfort but also support their nutritional needs, particularly as lactose-intolerant individuals are often mindful of calcium deficiency risks. Moreover, growing awareness of dairy allergies, distinct from lactose intolerance, further contributes to market growth, as dairy-free products provide safe options for allergic consumers. Beyond health-related factors, the non-dairy milk market benefits from consumer preferences for sustainability, ethical consumption, and dietary diversity. The expanding coffee culture and increasing demand in the foodservice sector, where plant-based milks frequently replace dairy, are also driving innovation in the market. In conclusion, the rise in lactose intolerance and dairy allergies is a key factor influencing Australian consumers to shift towards non-dairy milk, supporting robust and sustained market growth.
Rapid product innovation and barista functionality
Barista-grade formulations are emerging as a key driver of innovation in the market, with products specifically designed for espresso-based applications witnessing significant acceptance among consumers and businesses alike. MILKLAB has established itself as a market leader by leveraging strategic manufacturing partnerships in Victoria and New South Wales, ensuring consistent product quality and availability. Similarly, Alternative Dairy Co has positioned its oat milk as the "NO.1 OAT MILK IN AUSSIE CAFÉS," highlighting its specialized formulations that cater to the unique requirements of specialty coffee preparation. Precision fermentation technologies are transforming the industry by enabling the production of dairy-identical proteins without the need for animal involvement. A notable example is Eden Brew, which has successfully secured USD 24.5 million in Series A funding to advance its casein micelle production, utilizing innovative technology developed by CSIRO. Additionally, the University of Southern Queensland is conducting research to optimize hemp milk processing, addressing critical challenges related to stability and emulsification that have previously hindered its commercial viability. Nourish Ingredients is also making strides in the market by developing specialty lipids through precision fermentation. These lipids are designed to deliver authentic dairy-like creaminess at minimal inclusion rates, with the company initially targeting the Southeast Asian and European markets for its products.
Restraints Impact Analysis*
| Restraint | (~) % Impact on CAGR Forecast | Geographic Relevance | Impact Timeline |
|---|---|---|---|
| Price premium vs dairy milk | -2.3% | National, with higher impact in price-sensitive demographics | Short term (≤ 2 years) |
| Domestic almond-supply volatility (rain-risk) | -1.1% | National, with supply concentration in irrigation regions | Medium term (2-4 years) |
| ACCC crackdown on "milk" nomenclature (2025 draft) | -0.9% | National, affecting product marketing and positioning | Short term (≤ 2 years) |
| Ultra-processing perception & additive backlash | -1.4% | National, concentrated among health-conscious consumers | Medium term (2-4 years) |
| Source: Mordor Intelligence | |||
Price premium vs dairy milk
Non-dairy alternatives, which are priced 35-58% higher than conventional dairy milk, present significant affordability challenges, particularly for price-sensitive consumer segments. In cafes, customers typically pay an additional AUD 0.50 to AUD 1.00 for alternative milk options. Operators justify these surcharges by citing input costs that can be nearly double those of traditional dairy milk. However, the gap in pricing is gradually narrowing due to declining dairy farmgate prices and advancements in the economics of plant-based milk production. Promotional campaigns by major supermarket retailers occasionally create temporary price parity, which encourages consumers to experiment with non-dairy alternatives. Additionally, the expansion of private-label offerings enables retailers to provide competitive pricing while safeguarding their profit margins. However, this strategy exerts pressure on branded manufacturers, potentially limiting their ability to invest in innovation and product development.
ACCC crackdown on "Milk" nomenclature
Regulatory restrictions on the use of the term "milk" present significant marketing and positioning challenges, potentially limiting consumer recognition and slowing the growth of the category. The ACCC's food labeling guidelines, which prioritize truthfulness in advertising and emphasize country-of-origin requirements, may directly impact how plant-based products communicate their similarities to dairy products. Precedents from Europe and North America illustrate that such labeling restrictions can lead to consumer confusion, thereby delaying the adoption of the category. Despite these challenges, established brands often adapt by employing alternative terminology to comply with regulations while maintaining consumer appeal. However, the costs associated with compliance, including relabeling and updating marketing materials, disproportionately affect smaller manufacturers. This financial strain could accelerate market consolidation, favoring larger players who possess the resources to navigate regulatory complexities effectively.
*Our forecasts treat driver/restraint impacts as directional, not additive. The impact forecasts reflect baseline growth, mix effects, and variable interactions.
Segment Analysis
By Product Type: Soy Dominance Faces Hemp Disruption
Soy milk holds a dominant 40.72% market share in 2025, driven by its established consumer acceptance and a nutritional profile similar to dairy milk. The consistent availability of raw materials further supports its growth. According to the Grain Research and Development Corporation, Australia produced approximately 35,000 tonnes of soybeans annually in 2024. Hemp milk is the fastest-growing segment, with a projected CAGR of 12.03% through 2031, fueled by its complete amino acid profile and environmentally sustainable image that appeals to eco-conscious consumers. Oat milk is gaining significant traction in the foodservice sector due to its barista-grade formulations, while coconut milk caters to niche applications requiring tropical flavor profiles. Almond milk, despite challenges from domestic supply fluctuations and criticisms over its water-intensive production, maintains its market presence through strong brand recognition.
Research from the University of Southern Queensland underscores hemp milk's nutritional advantages, highlighting its balanced omega-3 and omega-6 fatty acids. Processing optimizations have also addressed its historical stability issues. Cashew and hazelnut milk occupy premium market segments with limited volume penetration, while rice milk serves allergen-free applications. The industry is increasingly focusing on product innovations, particularly blended formulations that combine the nutritional benefits of multiple plant sources. For instance, almond-rice combinations are showing promising results in consumer sensory evaluations. Additionally, regulatory frameworks from Food Standards Australia New Zealand provide clear guidelines on nutritional fortification and labeling requirements, supporting the category's expansion.


By Distribution Channel: Off-Trade Consolidation Intensifies
Off-trade channels hold a significant 85.21% market share in 2025, and are expected to grow at a strong 11.86% CAGR through 2031. This growth is primarily driven by the expansion of supermarket private labels and increasing e-commerce penetration. Woolworths and Coles utilize their procurement scale to secure advantageous supplier terms while creating 'phantom brands' that directly compete with national manufacturers. Additionally, Amazon, with a notable 27% penetration in non-fresh grocery ranges, applies dynamic pricing pressure through algorithmic price matching, which compresses margins across the category.
Conversely, on-trade foodservice channels face operational challenges. The variety of milk types offered can slow service and increase costs. However, premium barista formulations command higher wholesale prices. Specialty retailers and health food stores act as discovery platforms for emerging brands and innovative formulations. Convenience stores, meanwhile, effectively capture impulse purchase occasions. Online retail is experiencing accelerated growth, fueled by subscription services and bulk purchasing options that appeal to committed plant-based consumers. Nonetheless, distribution consolidation creates obstacles for smaller manufacturers while enabling scale economies that enhance price competitiveness against dairy alternatives.
Geography Analysis
Australia's national market demonstrates a unified structure, with metropolitan areas driving adoption trends while rural regions follow with a time lag. Population growth continues to support the expansion of overall demand; however, a decline in per-capita dairy consumption is creating opportunities for plant-based alternatives to gain traction. Sydney and Melbourne, as key urban centers, lead market penetration due to their higher concentrations of health-conscious consumers and a well-established specialty coffee culture, which fosters the adoption of barista-grade plant-based products. These cities also act as trendsetters, influencing consumer behavior in other parts of the country.
Regional differences in market dynamics are closely tied to agricultural production patterns. For example, almond-growing regions in Victoria and South Australia benefit from supply chain efficiencies that enable local processing. These regions leverage their proximity to raw materials, reducing transportation costs and ensuring fresher inputs for production. However, climate variability significantly impacts domestic ingredient sourcing. Water-intensive crops like almonds are particularly vulnerable to production volatility caused by recurring drought conditions, which pose challenges to consistent supply and may lead to increased reliance on imports during periods of low domestic yield.
Government sustainability initiatives, coupled with carbon labeling mandates, are creating a regulatory environment that supports the positioning of plant-based products. These measures not only encourage manufacturers to adopt sustainable practices but also enhance consumer awareness of the environmental impact of their choices. Food Standards Australia New Zealand provides a cohesive national framework that facilitates product development and marketing efforts, ensuring consistency and compliance across the industry. Furthermore, state-level health promotion programs are increasingly recognizing plant-based diets as both environmentally sustainable and aligned with public health objectives, further driving their adoption across the country. These programs often include educational campaigns and incentives that highlight the benefits of plant-based eating, contributing to a gradual shift in consumer preferences.
Competitive Landscape
Australia's non-dairy milk market is moderately fragmented, with established food manufacturers competing against specialized plant-based entrants and the growing influence of precision fermentation technologies. Sanitarium leverages its century-long legacy and strong distribution networks, while Noumi (operating brands like MILKLAB and Australia's Own) focuses on barista-grade innovations that command premium prices in foodservice channels. At the same time, Woolworths and Coles intensify competition through private-label expansions, offering phantom brands that replicate national formulations at lower price points.
Leading players in the Australian non-dairy milk market include Blue Diamond Growers, Oatly Group AB, Sanitarium Health and Wellbeing Company, Vitasoy International Holdings Ltd, and Noumi Ltd. These companies are prioritizing product innovation and strategic growth to maintain their competitive edge. A key trend is the frequent introduction of new plant-based milk variants, particularly in premium and specialized segments. Demonstrating operational flexibility, these companies are building robust supply chain networks and partnering with local farmers for ingredient sourcing. Their strategies also involve significant investments in research and development to create innovative formulations and improve product features.
Precision fermentation is emerging as a disruptive trend. For example, Eden Brew has secured USD 24.5 million in Series A funding to develop animal-free casein using CSIRO technology. Similarly, Wide Open Agriculture is patenting proprietary lupin protein formulations for global commercialization. Technological advancements are increasingly focused on replicating dairy-like functionality, with companies like Nourish Ingredients working on protein engineering and specialty lipid development to achieve cost-effective low-inclusion rates. Additionally, regulatory frameworks under Food Standards Australia New Zealand create challenges for international players while protecting domestic manufacturers through established approval processes and labeling requirements.
Australia Non-Dairy Milk Industry Leaders
-
Blue Diamond Growers
-
Oatly Group AB
-
Sanitarium Health and Wellbeing Company
-
Vitasoy International Holdings Ltd
-
Noumi Ltd
- *Disclaimer: Major Players sorted in no particular order


Recent Industry Developments
- February 2025: Kikkoman launched its global site for Kikkoman Soymilk. The company began by introducing its original soymilk in Australia and has since expanded its availability to more countries while diversifying its product lineup.
- August 2024: Noumi followed its successful retail launch of the 250mL Milklab Minis with the introduction of a 1-litre version of the product.
- July 2024: Sanitarium introduced its Plantwell superfood plant milk range in Australia, highlighting health benefits to distinguish its products from standard commodity alternatives.
- July 2024: The Australian Walnut Company has introduced its Vitality Walnut Milk in Melbourne, now available at IGA, local health food stores, and independent and specialty grocers. This dairy-free milk alternative features a creamy texture and nutty flavor, making it an excellent addition to coffee, tea, and smoothies.


Australia Non-Dairy Milk Market Report Scope
Almond Milk, Cashew Milk, Coconut Milk, Hazelnut Milk, Oat Milk, Soy Milk are covered as segments by Product Type. Off-Trade, On-Trade are covered as segments by Distribution Channel.| Almond Milk |
| Cashew Milk |
| Coconut Milk |
| Hazelnut Milk |
| Hemp Milk |
| Oat Milk |
| Soy Milk |
| Others |
| Off-Trade | Supermarkets/ Hypermarkets |
| Convenience Stores | |
| Online Retail | |
| Specialist Retailers | |
| Other Distribution Channels | |
| On-Trade (HoReCa) |
| By Product Type | Almond Milk | |
| Cashew Milk | ||
| Coconut Milk | ||
| Hazelnut Milk | ||
| Hemp Milk | ||
| Oat Milk | ||
| Soy Milk | ||
| Others | ||
| By Distribution Channel | Off-Trade | Supermarkets/ Hypermarkets |
| Convenience Stores | ||
| Online Retail | ||
| Specialist Retailers | ||
| Other Distribution Channels | ||
| On-Trade (HoReCa) | ||


Market Definition
- Dairy Alternatives - Dairy alternatives are foods that are made from plant-based milk/oils instead of their usual animal products, such as cheese, butter, milk, ice cream, yogurt, etc. Plant-based or non-dairy milk alternative is the fast-growing segment in the newer food product development category of functional and specialty beverage across the globe.
- Non-Dairy Butter - Non dairy butter is a vegan butter alternative that is made from a mixture of plant oils. With an increase in alternative diets like vegetarianism, veganism, and gluten intolerance, plant butter is a healthy non-dairy substitute for normal butter.
- Non-Dairy Ice Cream - Plant based ice cream is a growing category. Non-dairy ice cream is a type of dessert made without any animal ingredients. This is typically considered a substitute for regular ice cream for those who cannot or do not eat animal or animal-derived products, including eggs, milk, cream, or honey.
- Plant-Based Milk - Plant based milks are milk substitutes that are made from nuts (e.g., hazelnuts, hemp seeds), seeds (e.g., sesame, walnuts, coconuts, cashews, almonds, rice, oats, etc.) or legumes (e.g., soy). Plant-based milk such as soy milk and almond milk have been popular in East Asia and the Middle East for centuries.
| Keyword | Definition |
|---|---|
| Cultured Butter | Cultured butter is prepared by having the raw butter go through chemical processing and has been added with certain emulsifiers and foreign ingredients. |
| Uncultured Butter | This type of butter is one which has not been processed in any way |
| Natural Cheese | The type of cheese in its most natural form. It is made from natural and simple products and ingredients, including fresh and natural salts, natural colors, enzymes, and high-quality milk. |
| Processed Cheese | Processed cheese undergoes the same processes as natural cheese; however, it requires more steps and many different forms of ingredients. Making processed cheese involves melting natural cheese, emulsifying it, and adding preservatives and other artificial ingredients or colorings. |
| Single Cream | Single cream contains around 18% fat. It’s a single layer of cream that appears over boiled milk. |
| Double Cream | Double cream contains 48% fat, more than double the amount of fat of single cream. It’s heavier and thicker than single cream |
| Whipping Cream | This has a much higher fat percentage than single cream (36%). Used to top cakes, pies, and puddings and as a thickener for sauces, soups, and fillings. |
| Frozen Desserts | Desserts that are meant to be eaten in frozen condition. E.g., sherbets, sorbets, frozen yogurts |
| UHT Milk (Ultra-high temperature milk) | Milk heated at a very high temperature. Ultra-high-temperature processing (UHT) of milk involves heating for 1–8 sec at 135–154°C. which kills the spore-forming pathogenic microorganism, resulting in a product with a shelf-life of several months. |
| Non-dairy butter/Plant-based butter | Butter made from plant-derived oil such as coconut, palm, etc. |
| Non-dairy Yogurt | Yogurt made from typically made from nuts, like almonds, cashews, coconuts, and even other foods like soybeans, plantains, oats, and peas |
| On-trade | It refers to restaurants, QSRs, and bars. |
| Off-trade | It refers to supermarkets, hypermarkets, on-line channels, etc. |
| Neufchatel cheese | One of the oldest kinds of cheese in France. It is a soft, slightly crumbly, mold-ripened, bloomy-rind cheese made in the Neufchâtel-en-Bray region of Normandy. |
| Flexitarian | It refers to a consumer preferring a semi-vegetarian diet, that is centered on plant foods with limited or occasional inclusion of meat. |
| Lactose Intolerance | Lactose intolerance is a reaction in digestive system to lactose, the sugar in milk. It causes uncomfortable symptoms in response to the consumption of dairy products. |
| Cream Cheese | Cream cheese is a soft and creamy fresh cheese with a tangy taste made from milk and cream. |
| Sorbets | Sorbet is a frozen dessert made using ice combined with fruit juice, fruit purée, or other ingredients, such as wine, liqueur, or honey. |
| Sherbet | Sherbet is a sweetened frozen dessert made with fruit and some sort of dairy product such as milk or cream. |
| Shelf stable | Foods that can be safely stored at room temperature, or "on the shelf," for at least one year and do not have to be cooked or refrigerated to eat safely. |
| DSD | Direct Store Delivery is the process in supply chain management wherein the product is delivered from manufacturing plant directly to the retailer. |
| OU Kosher | Orthodox Union Kosher is a kosher certification agency based in New York City. |
| Gelato | Gelato is a frozen creamy dessert made with milk, heavy cream and sugar. |
| Grass-fed Cows | Grass-fed cows are allowed to graze in pastures, where they eat a variety of grasses and clover. |


Research Methodology
Mordor Intelligence follows a four-step methodology in all our reports.
- Step-1: Identify Key Variables: In order to build a robust forecasting methodology, the variables and factors identified in Step 1 are tested against available historical market numbers. Through an iterative process, the variables required for market forecast are set, and the model is built on the basis of these variables.
- Step-2: Build a Market Model: Market-size estimations for the forecast years are in nominal terms. Inflation is not a part of the pricing, and the average selling price (ASP) is kept constant throughout the forecast period for each country.
- Step-3: Validate and Finalize: In this important step, all market numbers, variables, and analyst calls are validated through an extensive network of primary research experts from the market studied. The respondents are selected across levels and functions to generate a holistic picture of the market studied.
- Step-4: Research Outputs: Syndicated Reports, Custom Consulting Assignments, Databases & Subscription Platforms


