United States Casino Tourism Market Size and Share
Market Overview
| Study Period | 2021 - 2031 |
|---|---|
| Forecast Data Period | 2026 - 2031 |
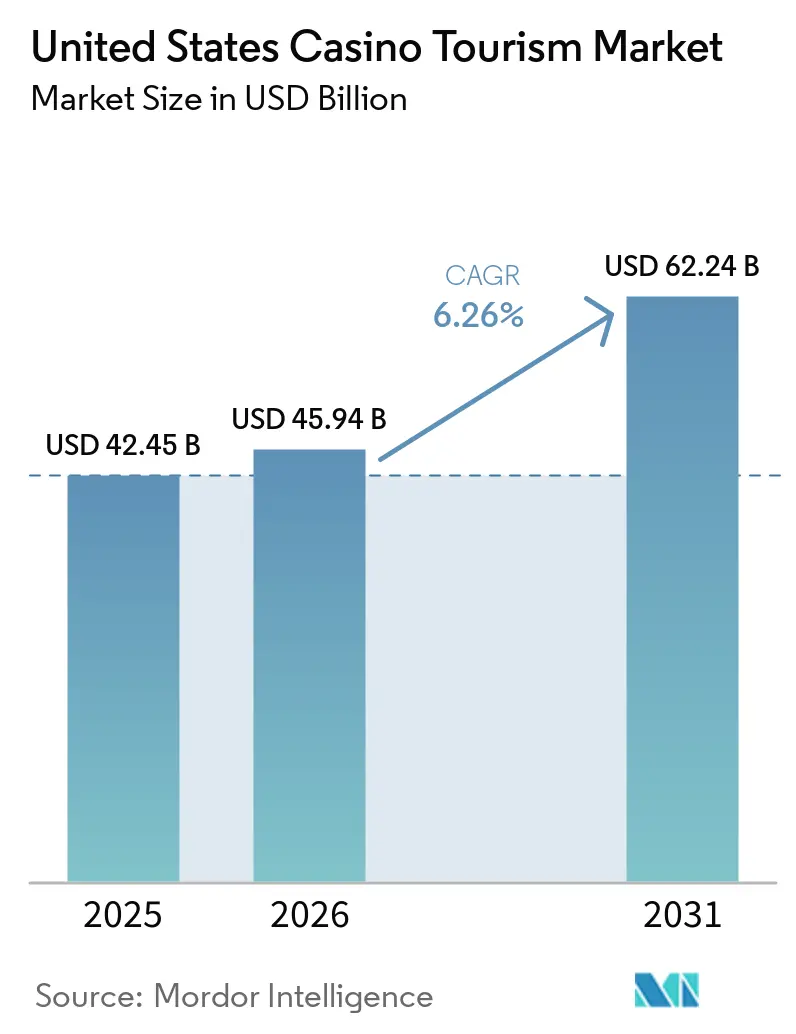
| Base Year Market Size (2025) | USD 42.45 Billion |
| Market Size (2026) | USD 45.94 Billion |
| Market Size (2031) | USD 62.24 Billion |
| Growth Rate (2026 - 2031) | 6.26% CAGR |
| Market Concentration | Low |
Major Players *Disclaimer: Major Players sorted in no particular order Image © Mordor Intelligence. Reuse requires attribution under CC BY 4.0. | |
United States Casino Tourism Market Analysis by Mordor Intelligence
The United States Casino Tourism Market was valued at USD 42.45 billion in 2025 and is estimated to grow from USD 45.94 billion in 2026 to reach USD 62.4 billion by 2031, at a CAGR of 6.26% during the forecast period (2026–2031). Recovery from macroeconomic challenges in 2025 occurred despite a 7.5% decline in Las Vegas visitors to 38.5 million and reduced international demand[1]Las Vegas Convention and Visitors Authority, “LVCVA Executive Summary of Southern Nevada Tourism Indicators, Year-End Summary 2025,” Las Vegas Convention and Visitors Authority, lvcva.com. The American Gaming Association reported USD 78.7 billion in United States commercial gross gaming revenue for 2025, with traditional in-person gaming contributing USD 50.9 billion, reflecting the resilience of travel-linked gaming demand. Average gambling budgets for Las Vegas visitors rose 3.5% to USD 848.95 in 2025, indicating sustained spending by high-value travelers. Growth is driven by convention demand, resort reinvestments, tribal destination expansions, and integration of digital gaming accounts with resort loyalty systems. The competitive landscape remains diverse, with national resort brands, regional operators, and tribal networks expanding across the country, attracting investments and meeting local demand.
Key Report Takeaways
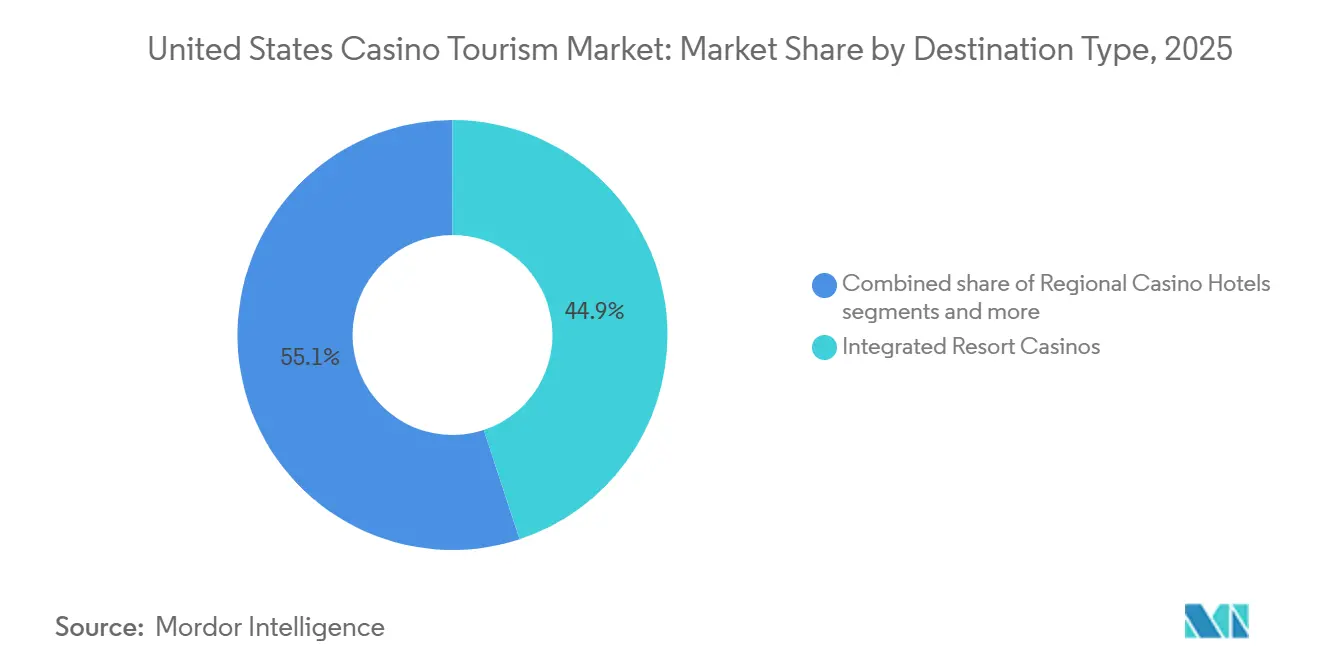
- By destination type, integrated resort casinos held 44.93% share of the United States Casino Tourism Market in 2025, while the same segment is forecast to grow at a CAGR of 6.92% through 2031.
- By ownership model, commercial casino resorts held 63.81% share of the United States Casino Tourism Market in 2025, while tribal casino resorts are projected to record the fastest CAGR at 7.24% through 2031.
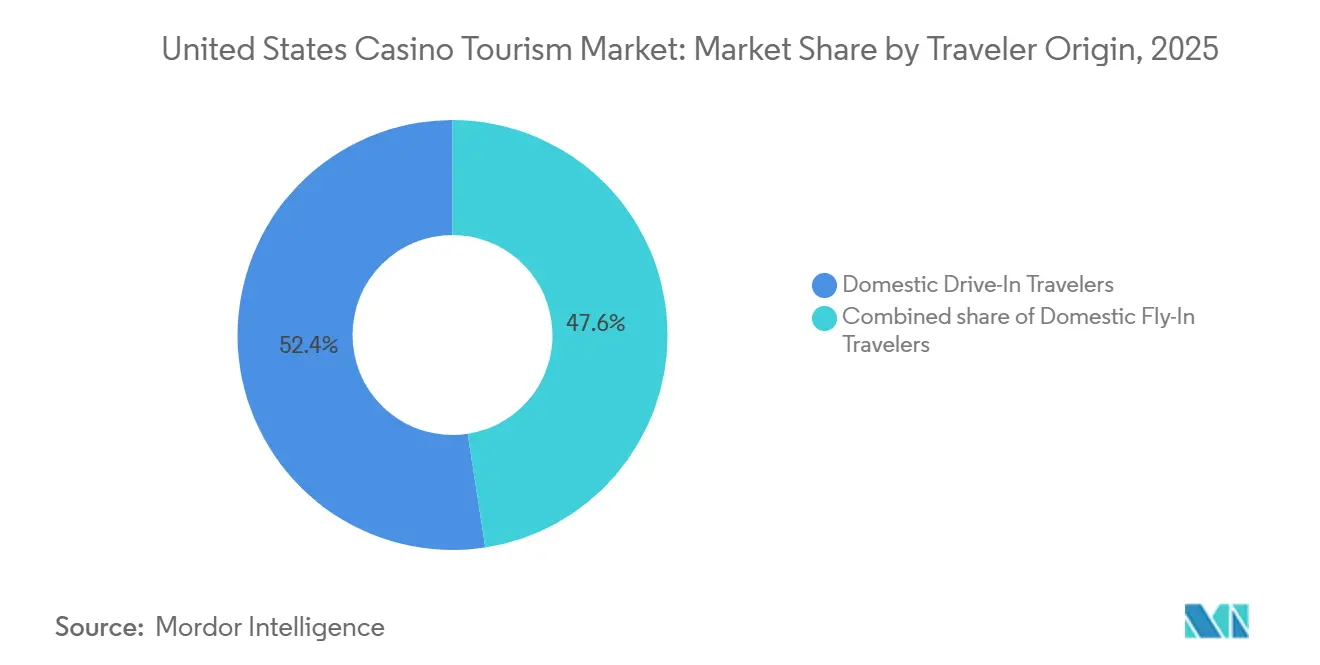
- By traveler origin, domestic drive-in travelers accounted for 52.43% share of the United States Casino Tourism Market in 2025, while domestic fly-in travelers are forecast to expand at a CAGR of 7.95% through 2031.
- By booking channel, direct digital channels represented 52.54% share of the United States Casino Tourism Market in 2025, while casino host and VIP programs are projected to grow at a CAGR of 7.09% through 2031.
- By geography, Nevada led with 34.74% share of the United States Casino Tourism Market in 2025, while Pennsylvania is forecast to grow at a CAGR of 7.64% through 2031.
Note: Market size and forecast figures in this report are generated using Mordor Intelligence’s proprietary estimation framework, updated with the latest available data and insights as of January 2026.
United States Casino Tourism Market Trends and Insights
Drivers Impact Analysis*
| Drivers | (~) % Impact on CAGR Forecast | Geographic Relevance | Impact Timeline |
|---|---|---|---|
| Convention and bleisure demand intensification | +1.6% | National, concentrated in Las Vegas, Chicago, and Atlantic City | Short term (≤ 2 years) |
| Resort reinvestment and amenity expansion | +1.4% | Nevada, New Jersey, Florida, Pennsylvania | Medium term (2-4 years) |
| Tribal resort expansion and destination diversification | +1.1% | California, Oklahoma, Mississippi, Connecticut, New York | Medium term (2-4 years) |
| Multi-vertical gaming ecosystem cross-sell | +0.9% | National, early leadership in Pennsylvania, New Jersey, and Nevada | Long term (≥ 4 years) |
| Trade-show attendance uplift in casino destinations | +0.5% | Nevada primarily, Atlantic City secondary | Short term (≤ 2 years) |
| Premium traveler mix shift | +0.3% | Las Vegas Strip, Boston, and premium regional corridors | Medium term (2-4 years) |
| Source: Mordor Intelligence | |||
Convention and bleisure demand intensification
Convention demand is stabilizing the United States casino tourism market. Las Vegas anticipates growth in tradeshow attendance by 2026, boosting hotel occupancy and midweek resort demand. Corporate travelers increasingly extend trips for dining, gaming, and entertainment, and driving beyond room bookings[2]RX and American Gaming Association, “RX & AGA Celebrate 25 Years of Global Gaming Expo,” TSNN, tsnn.com. The Global Gaming Expo drew thousands of professionals to Las Vegas in 2025, with the 2026 event planned at The Venetian, reinforcing the city’s role as a key business events hub for the gaming sector. Events such as WrestleMania, Formula One, and travel tied to the FIFA World Cup offer operators opportunities to convert business travel into leisure stays. This trend helps integrated resorts fill rooms during shoulder periods, reducing reliance on weekend leisure traffic.
Resort reinvestment and amenity expansion
Large capital programs are transforming property positioning in the United States casino tourism market. Hard Rock International marked a milestone with the topping off its 42-story Guitar Hotel on the former Mirage site, set to add significant room, gaming, and meeting space capacity. Red Rock Resorts began Phase III construction at Durango Casino and Resort, enhancing gaming, entertainment, and leisure offerings to support longer stays[3]Hard Rock International, “Hard Rock Las Vegas Celebrates Milestone With Guitar Tower Topping Off Ceremony,” Fox 5 Vegas, fox5vegas.com. Ocean Casino Resort invested in its multi-year transformation program, reflecting Atlantic City operators’ focus on reinvestment to maintain market share. The market increasingly relies on room quality, meeting spaces, dining, and entertainment rather than gaming floors alone. Enhancing these elements helps operators protect room rates and boost non-gaming guest spending without requiring a rise in visitor numbers.
Tribal resort expansion and destination diversification
Tribal resorts are transforming the United States casino tourism market by expanding beyond traditional hubs. Tribal operators are converting properties previously reliant on day trips into overnight resorts with larger hotels, diverse dining options, and enhanced entertainment. The Oneida Indian Nation announced in late 2025 that its Turning Stone Evolution expansion was progressing ahead of schedule, with the Crescent Hotel set to open in mid-2026, followed by the Grand Expo later that year. California remains a key player in this trend, as tribal operators continue to develop large resort projects, increasing the state's appeal in casino tourism. Similar developments are occurring in the Southeast and Gulf South, where tribal operators are adding rooms and amenities to encourage longer guest stays. This shift increases competition for Las Vegas and Atlantic City while expanding the national tourism base of the United States casino tourism market.
Multi-vertical gaming ecosystem cross-sell
Digital wagering has become integral to resort strategies in the United States casino tourism market. Significant growth in iGaming and sports betting revenues in 2025 reflected the rapid expansion of digital platforms within the casino business. Operators with both digital and land-based operations are using these platforms to promote resort credits, enhance host outreach, and offer loyalty incentives, reducing hotel guest acquisition costs. PENN Entertainment, in its Q1 2026 report, observed increased visitation and higher spending per visit across its properties, indicating that cross-selling supports physical locations rather than replacing them. Casino Host and VIP Programs are now the fastest-growing booking channels in the market. Digital engagement is also providing operators with valuable data to identify customers who are likely to engage with on-property offerings.
Restraints Impact Analysis*
| Restraints | (~) % Impact on CAGR Forecast | Geographic Relevance | Impact Timeline |
|---|---|---|---|
| Price-value erosion at destination resorts | -0.9% | Las Vegas Strip, Atlantic City | Short term (≤ 2 years) |
| Mature in-person gaming growth plateau | -0.7% | National, markets with high gaming penetration such as Nevada and New Jersey | Medium term (2-4 years) |
| Demand concentration in higher-income cohorts | -0.5% | National, with acute sensitivity in Las Vegas and Gulf Coast markets | Medium term (2-4 years) |
| Off-platform wagering substitution risk | -0.7% | National, amplified in iGaming legal states such as Pennsylvania, New Jersey, and Michigan | Long term (≥ 4 years) |
| Source: Mordor Intelligence | |||
Price-value erosion at destination resorts
The United States casino tourism market faces short-term price challenges in key destinations. In Las Vegas, average daily room rates and revenue per available room declined in 2025, while occupancy remained stable due to discounting efforts aimed at sustaining demand. However, frequent discounting risks undermining the positioning of large resorts, which rely on non-gaming revenue streams. A decline in international arrivals further compounds the issue, as these resorts depend on a mix of domestic and overseas visitors. If perceptions of value continue to erode, both room revenue and ancillary spending could face additional pressure.
Mature in-person gaming growth plateau
The core on-property gaming base of the United States casino tourism market is growing but at a slower pace compared to digital channels. Traditional in-person gaming revenue increased modestly in 2025, while sports betting and iGaming saw significant growth. Land-based slot and table games still account for a large share of visitor spending. However, in mature gaming states, some table game categories are losing momentum, limiting the growth of in-person spending. To sustain total trip revenue, operators must enhance offerings in areas like accommodations, dining, and entertainment. Without a broader resort value proposition, growth in regions with high gaming penetration may slow down.
*Our forecasts treat driver/restraint impacts as directional, not additive. The impact forecasts reflect baseline growth, mix effects, and variable interactions.
Segment Analysis
By Destination Type: Integrated Resorts Anchoring Per-Visitor Spend
Integrated Resort Casinos accounted for 44.93% of the United States casino tourism market in 2025 and are projected to grow at a 6.92% CAGR through 2031. Their success lies in combining gaming, lodging, dining, entertainment, and meeting facilities within a single property. This model appeals to convention travelers and leisure visitors who engage with multiple resort offerings. Operators are focusing on maximizing revenue from the entire visitor experience, emphasizing meeting spaces, upscale dining, live entertainment, and luxury accommodations in their capital plans.
Hard Rock Las Vegas illustrates this trend with its under-construction property featuring over 200,000 square feet of meeting space and 175,000 square feet of gaming space, highlighting the integration of convention and gaming demand. Boardwalk and Waterfront Casino Destinations remain relevant but face challenges due to reliance on aging customer bases and the need for continuous reinvestment. Ocean Casino Resort’s multi-year transformation program, with over USD 50 million allocated in 2025, demonstrates the investment required to stay competitive. Regional Casino Hotels and day-trip casinos continue to serve value-driven markets and contribute to overall industry volume[4]Ocean Casino Resort, “Ocean Casino Resort Announces $50 Million in 2025 Capital Property Investments,” Ocean Casino Resort, theoceanac.com. However, long-term demand in the United States casino tourism market is shifting toward integrated resorts that cater to both leisure and business travelers.


By Ownership / Operating Model: Tribal Resorts Gaining Scale Against Commercial Portfolios
Commercial casino resorts accounted for 63.81% of the United States casino tourism market size in 2025, reflecting the influence of Las Vegas Strip operators and large regional commercial portfolios. This segment remains central to the market due to its control over prominent destination assets, extensive marketing networks, loyalty systems, and expertise in managing large-scale rooms, events, and entertainment. However, tribal casino resorts are projected to grow at a faster 7.24% CAGR through 2031, driven by an increasing number of tribal projects transitioning from gaming halls to full resort models.
Tribal expansion is introducing new overnight destinations beyond traditional hubs like Las Vegas and Atlantic City. The Oneida Indian Nation’s Turning Stone Evolution project, including the Crescent Hotel and the Grand Expo, highlights tribal operators’ focus on room growth and event infrastructure over reliance on gaming. Similar investments in California and the Southeast are enabling tribal operators to attract longer stays. Racino-based venues remain part of the market but face limitations due to hybrid regulatory structures and narrower resort offerings, which constrain long-stay tourism. As a result, commercial resorts continue to lead the United States casino tourism market, but tribal properties are gaining ground through destination expansion and modernization.
By Traveler Origin: Fly-In Travelers Lifting Value Per Trip
Domestic Drive-In Travelers represented 52.43% of the United States casino tourism market in 2025, highlighting the importance of regional access. These travelers contributed to occupancy at regional casino hotels, racino venues, and Gulf Coast and Mid-Atlantic resorts. Their appeal stems from convenience, lower transport costs, and repeat visits, making them crucial to the weekly demand in the market. Domestic Fly-In Travelers are expected to grow at a 7.95% CAGR through 2031, reflecting a shift toward higher-value trips.
Las Vegas demonstrated this trend, with 81% of its visitors gambling in 2025 and an average gambling budget of USD 848.95, the highest in five years. Fly-in visitors tend to stay longer and spend more on food, beverages, and entertainment, increasing their importance to the market. International demand declined in 2025, but the 2026 event calendar is anticipated to improve overseas and long-haul domestic travel. These visitors typically generate the highest trip values. The traveler mix is becoming more polarized, with drive-in guests sustaining volume and fly-in travelers increasing revenue per stay.
By Booking Channel: Direct Digital Leadership with Faster VIP Growth
Direct digital channels accounted for 52.54% of bookings in the United States casino tourism market in 2025. This resulted from investments in proprietary websites, apps, loyalty programs, and direct rate management. Operators prefer this channel as it reduces reliance on intermediaries and provides greater control over customer data. In the United States casino tourism market, trip economics depend on total guest spending rather than just room bookings. Guests booking directly are easier to reprise, remarket, and transition into gaming or host-led programs.
Online travel agencies remain relevant for first-time and comparison-driven travelers, especially in fly-in and international segments, but they are less effective for managing repeat customers. Casino Host and VIP Programs are projected to grow at a 7.09% CAGR through 2031, making them the fastest-growing booking format in the United States casino tourism market. This reflects a shift toward higher-value guests who respond to tailored offers and direct relationship management. PENN Entertainment’s 2026 commentary highlights that digitally identified players convert into managed on-property guests more efficiently than anonymous bookings. Group and convention bookings also play a key role in providing room blocks and consistent midweek demand. As a result, direct digital channels remain the largest booking channel, while host-led engagement is becoming a significant driver of revenue growth in the United States casino tourism market.
Geography Analysis
Nevada accounted for 34.74% of the United States casino tourism market in 2025, maintaining its dominant position. Las Vegas drives this with its extensive room inventory, strong events calendar, and diverse gaming ecosystem. The Las Vegas Strip generated USD 8.8 billion in gaming revenue in 2025, despite a decline in visitation, reflecting strong spending levels. Nevada’s position is further supported by its convention infrastructure, with the 2026 calendar indicating growth in trade-show attendance. Continued resort investments on the Strip and in local markets highlight Nevada’s strategic importance in the casino tourism market.
Pennsylvania is projected to grow at a 7.64% CAGR through 2031, making it the fastest-growing state in the United States casino tourism market. Its growth is driven by population density, an established gaming base, and improved digital connectivity aiding cross-selling resort. The state benefits from a large Mid-Atlantic catchment area, combining drive-in traffic with short-break demand. New Jersey remains significant, with Atlantic City as a key destination outside Nevada. Property reinvestments, such as Ocean Casino Resort’s transformation, are helping operators maintain competitiveness in the market.
The Mississippi Gulf Coast and Chicagoland illustrate different regional trends. Mississippi attracts drive-in visitors from the Southeast, but growth is limited by value sensitivity and lower per-visit spending. Chicagoland is transitioning to an overnight destination, led by Bally’s Chicago casino project, which is on pace for a 2027 grand opening and includes a hotel, theater, and gaming floor. This development could position Chicago as a broader entertainment destination. Other regions, including the Baltimore-Washington corridor and emerging Southeast locations, compete through proximity, event-driven travel, and resort investments. The United States casino tourism market is expected to diversify further as more cities, and tribal territories develop multi-night resort capacities.
Competitive Landscape
The United States casino tourism market is fragmented, with no single operator dominating national revenue. Major companies, including MGM Resorts International, Caesars Entertainment, PENN Entertainment, Boyd Gaming, and Wynn Resorts, collectively held a modest share of the market in 2025. This reflects the influence of tribal resort networks and the geographic distribution of commercial assets across various destinations. Competition is shaped by property quality and local accessibility rather than national brand presence, allowing diverse operators to remain competitive.
MGM Resorts International has focused on expanding its destination offerings, achieving record performance in early 2026 while enhancing liquidity through asset sales. Boyd Gaming reallocated resources in 2025 by selling its stake in FanDuel, enabling debt reduction and future investments. PENN Entertainment continues to integrate digital and physical operations, with property expansions and efforts to connect online users to in-person visits. These strategies highlight the importance of financial flexibility, property upgrades, and customer retention in the market. Operators increasingly rely on integrating gaming, lodging, and loyalty programs to gain a competitive edge.
Hard Rock International is reshaping the Las Vegas Strip by redeveloping a prominent site, introducing new competition in a key gaming area. Tribal operators, such as Pechanga, Yaamava’, Mohegan, and Foxwoods, are enhancing their offerings with larger hotels, improved entertainment, and stronger positioning. The market operates as a network of destination clusters, where local operators maintain strong positions but face competition from other states, tribes, and resort formats. Success in the United States casino tourism market depends more on effective property-level execution than on national scale.
United States Casino Tourism Industry Leaders
MGM Resorts International
Caesars Entertainment
PENN Entertainment
Boyd Gaming
Wynn Resorts
- *Disclaimer: Major Players sorted in no particular order

Recent Industry Developments
- May 2026: Hard Rock International's Guitar Hotel, replacing the former Mirage on the Las Vegas Strip, topped off its 42-story, 700-foot tower. The USD 4-5 billion project will feature over 3,700 hotel rooms, 175,000 square feet of gaming, and 200,000 square feet of meeting space, targeting a late 2027 opening as a major Strip transformation.
- May 2026: Bally's Corporation marked a key milestone on May 1, 2026, for its permanent Chicago casino in River West. The USD 1.7 billion project includes a 500-room hotel, a 3,000-seat theater, and 3,300 slot machines, with a spring 2027 opening planned. This development introduces a full-scale overnight destination model to Chicago.
- April 2026: MGM Resorts sold MGM Northfield Park operations to Clairvest for USD 546 million. The next day, MGM reported a 4% rise in Q1 2026 net revenues to USD 4.5 billion, driven by a 9% increase at MGM China and a 43% growth in digital net revenues.
- January 2026: Red Rock Resorts has started Phase III construction at Durango Casino and Resort in southwest Las Vegas. The USD 385 million project will add 275,000 square feet, including 400 slot machines, a 36-lane bowling center, and luxury movie theaters. Completion is expected by summer 2027.


United States Casino Tourism Market Report Scope
| Integrated Resort Casinos |
| Boardwalk / Waterfront Casino Destinations |
| Regional Casino Hotels |
| Limited-Stay / Day-Trip Casinos |
| Commercial Casino Resorts |
| Tribal Casino Resorts |
| Racino-Based Gaming Venues |
| Domestic Drive-In Travelers |
| Domestic Fly-In Travelers |
| International Inbound Travelers |
| Direct Digital Channels |
| Online Travel Agencies (OTAs) |
| Casino Host / VIP Programs |
| Group & Convention Booking |
| Offline Travel Agents |
| Nevada |
| New Jersey |
| Mississippi Gulf Coast |
| Chicagoland |
| Baltimore-Washington Corridor |
| Pennsylvania |
| Other Regional Casino Markets |
| By Destination Type | Integrated Resort Casinos |
| Boardwalk / Waterfront Casino Destinations | |
| Regional Casino Hotels | |
| Limited-Stay / Day-Trip Casinos | |
| By Ownership / Operating Model | Commercial Casino Resorts |
| Tribal Casino Resorts | |
| Racino-Based Gaming Venues | |
| By Traveler Origin | Domestic Drive-In Travelers |
| Domestic Fly-In Travelers | |
| International Inbound Travelers | |
| By Booking Channel | Direct Digital Channels |
| Online Travel Agencies (OTAs) | |
| Casino Host / VIP Programs | |
| Group & Convention Booking | |
| Offline Travel Agents | |
| By Geography | Nevada |
| New Jersey | |
| Mississippi Gulf Coast | |
| Chicagoland | |
| Baltimore-Washington Corridor | |
| Pennsylvania | |
| Other Regional Casino Markets |


Key Questions Answered in the Report
What is the expected value of the United States casino tourism market by 2031?
The United States casino tourism market is forecast to reach USD 62.24 billion by 2031, rising from USD 45.94 billion in 2026 at a 6.26% CAGR.
Which destination type leads revenue generation in United States casino travel?
Integrated Resort Casinos led with 44.93% share in 2025 and are also the fastest-growing destination type through 2031.
Why does Nevada remain the largest state for casino tourism?
Nevada held 34.74% share in 2025 because Las Vegas combines the deepest hotel inventory, strong convention traffic, premium gaming demand, and a year-round event calendar.
Which traveler group is growing fastest in casino resort visits?
Domestic Fly-In Travelers are projected to grow fastest at 7.95% CAGR because they tend to spend more on rooms, gaming, dining, and entertainment.
How important are direct bookings in casino resort demand?
Direct Digital Channels accounted for 52.54% of bookings in 2025, showing that operators are relying heavily on apps, websites, and loyalty ecosystems to control demand.
What is the biggest long-term competitive challenge for casino resorts?
Off-platform wagering is a major long-term challenge because fast-growing iGaming and mobile betting can pull gaming spend away from resort visits unless operators link digital accounts to physical stays.
Page last updated on:


