Casino Gaming Equipment Market Size and Share
Market Overview
| Study Period | 2021 - 2031 |
|---|---|
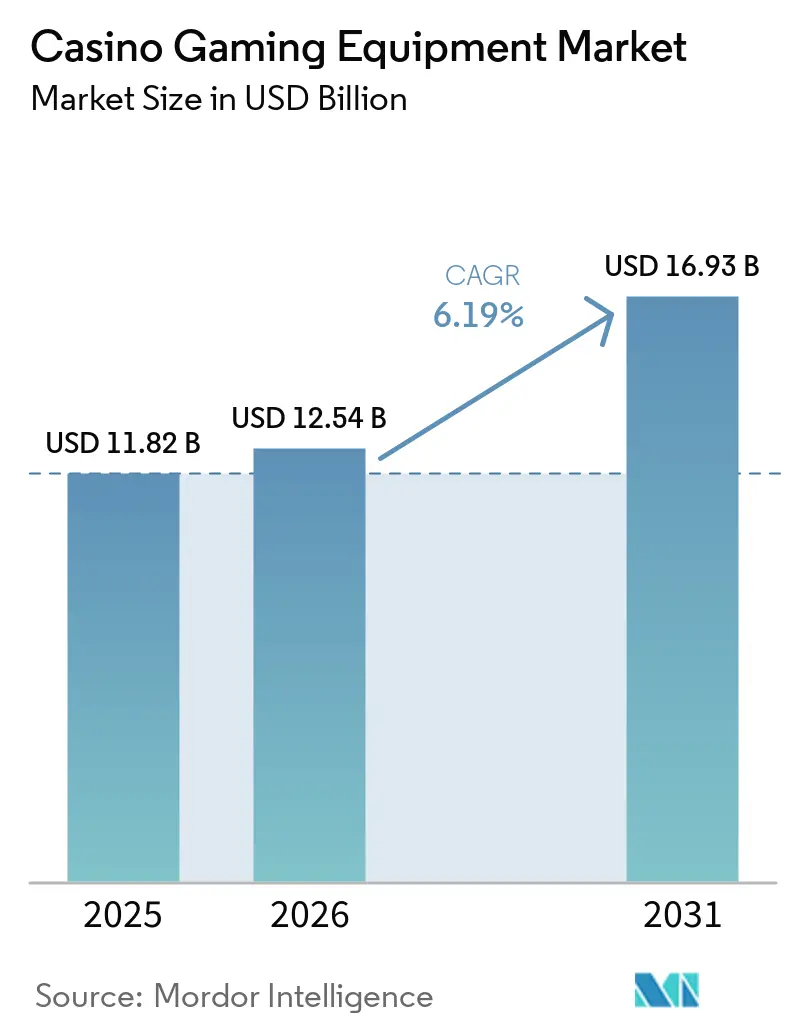
| Market Size (2026) | USD 12.54 Billion |
| Market Size (2031) | USD 16.93 Billion |
| Growth Rate (2026 - 2031) | 6.19% CAGR |
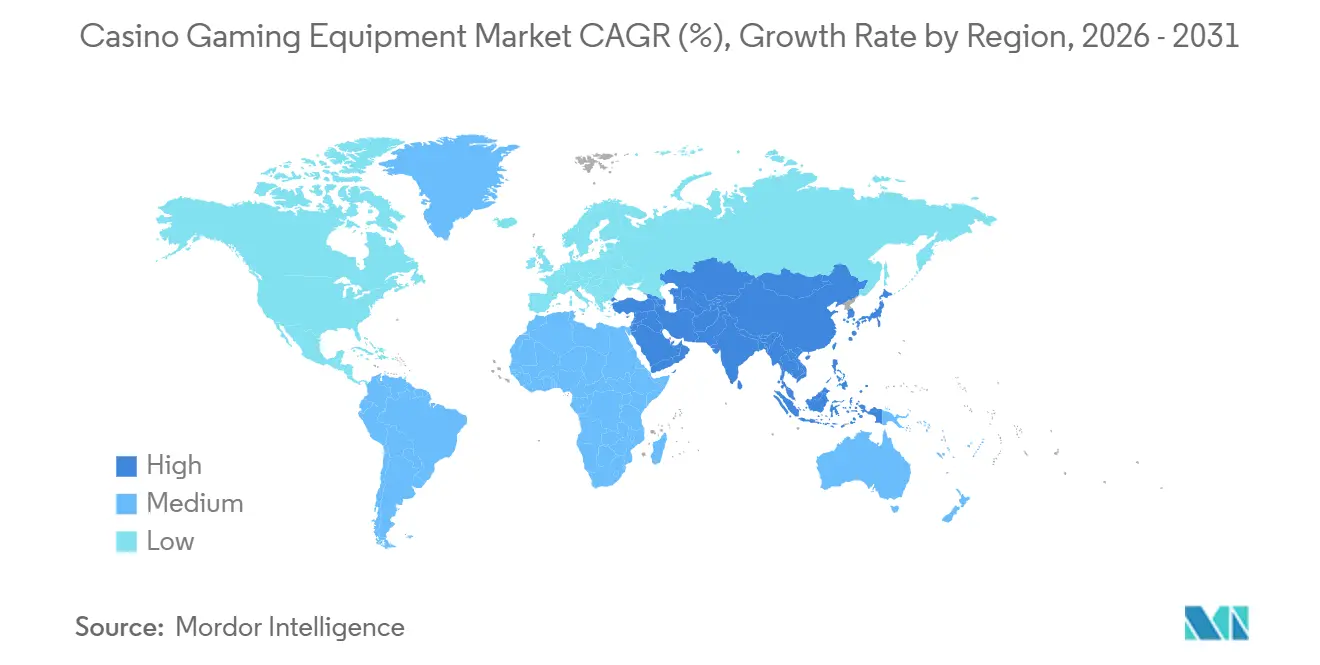
| Fastest Growing Market | Asia-Pacific |
| Largest Market | North America |
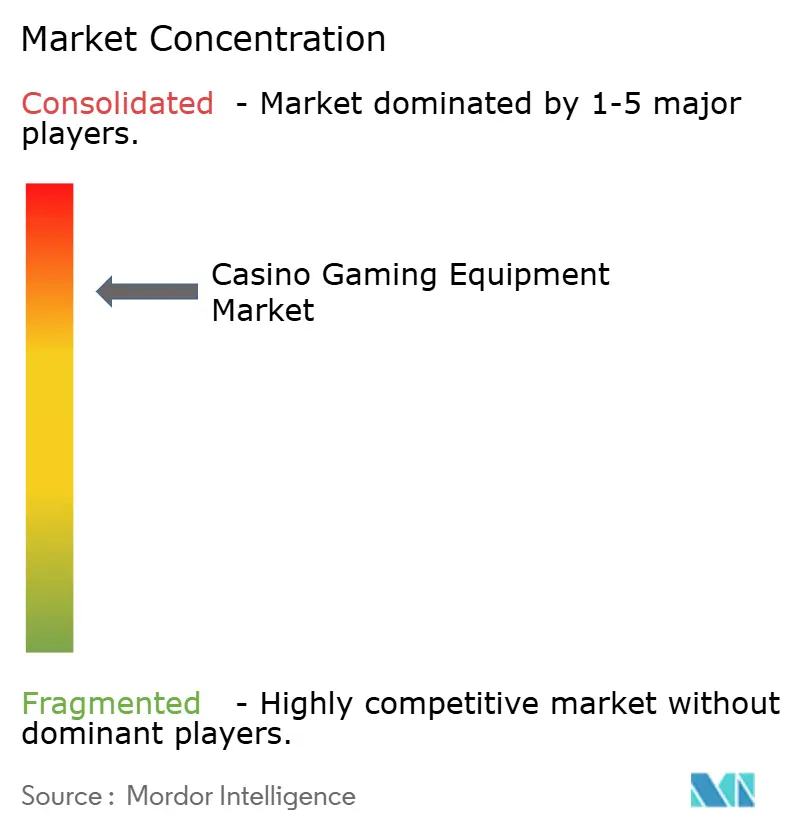
| Market Concentration | High |
Major Players *Disclaimer: Major Players sorted in no particular order Image © Mordor Intelligence. Reuse requires attribution under CC BY 4.0. | |
Casino Gaming Equipment Market Analysis by Mordor Intelligence
The Global Casino Gaming Equipment Market was valued at USD 11.82 billion in 2025 and estimated to grow from USD 12.54 billion in 2026 to reach USD 16.93 billion by 2031, at a CAGR of 6.19% during the forecast period (2026-2031). This market plays a critical role in modern casino tourism, driven by new resort developments, floor upgrades, and software modernization, all reliant on timely equipment procurement. Demand is supported by a surge in integrated resort construction, updates to aging slot floors in established regions, and a shift toward cloud-based casino management systems. The 2026 order book includes equipment deliveries for long-term Asia-Pacific projects, with procurement cycles of 18 to 36 months providing suppliers with extended demand visibility. Operators increasingly value suppliers offering integrated solutions, combining cabinets, payments, analytics, surveillance, and loyalty systems. This trend favors large global vendors and highlights a shift in procurement decisions toward long-term operational compatibility rather than standalone machine performance.
Key Report Takeaways
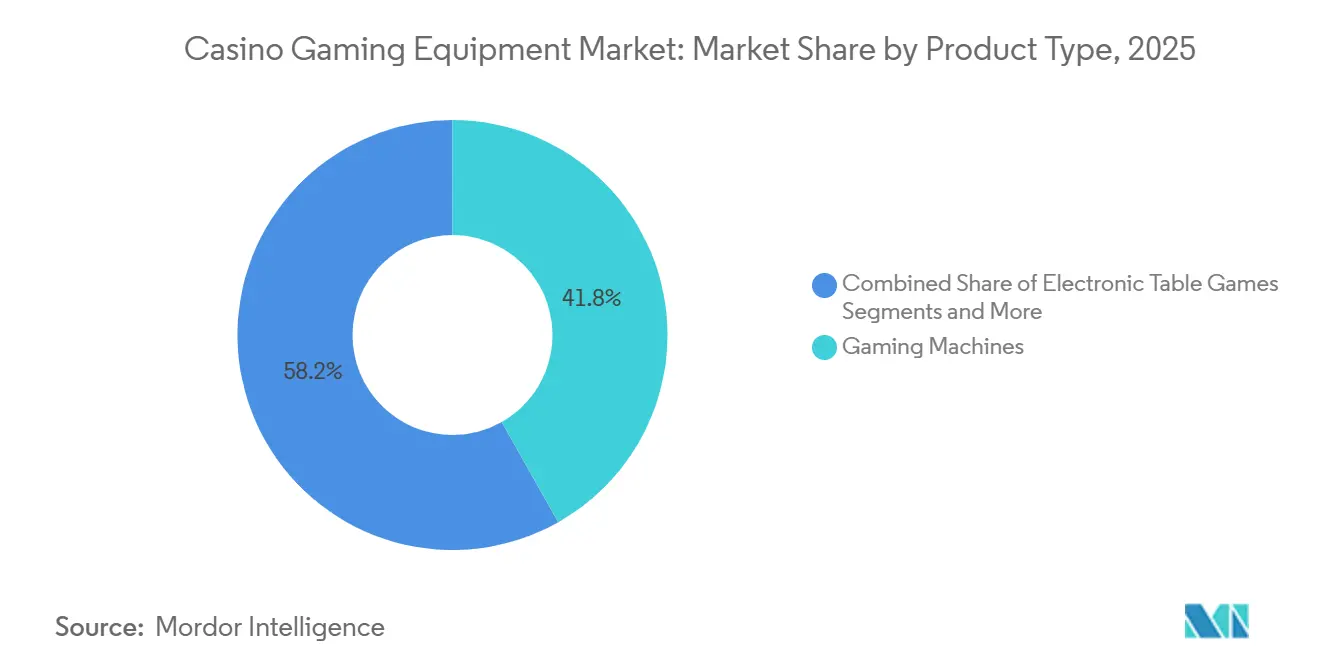
- By product type, gaming machines led with 41.82% share of the Global Casino Gaming Equipment Market in 2025, while casino management systems are forecast to expand at a 7.35% CAGR through 2031.
- By installation, inside-casino deployments held 85.91% share of the Global Casino Gaming Equipment Market in 2025, while outside-casino channels are projected to grow at a 6.47% CAGR through 2031.
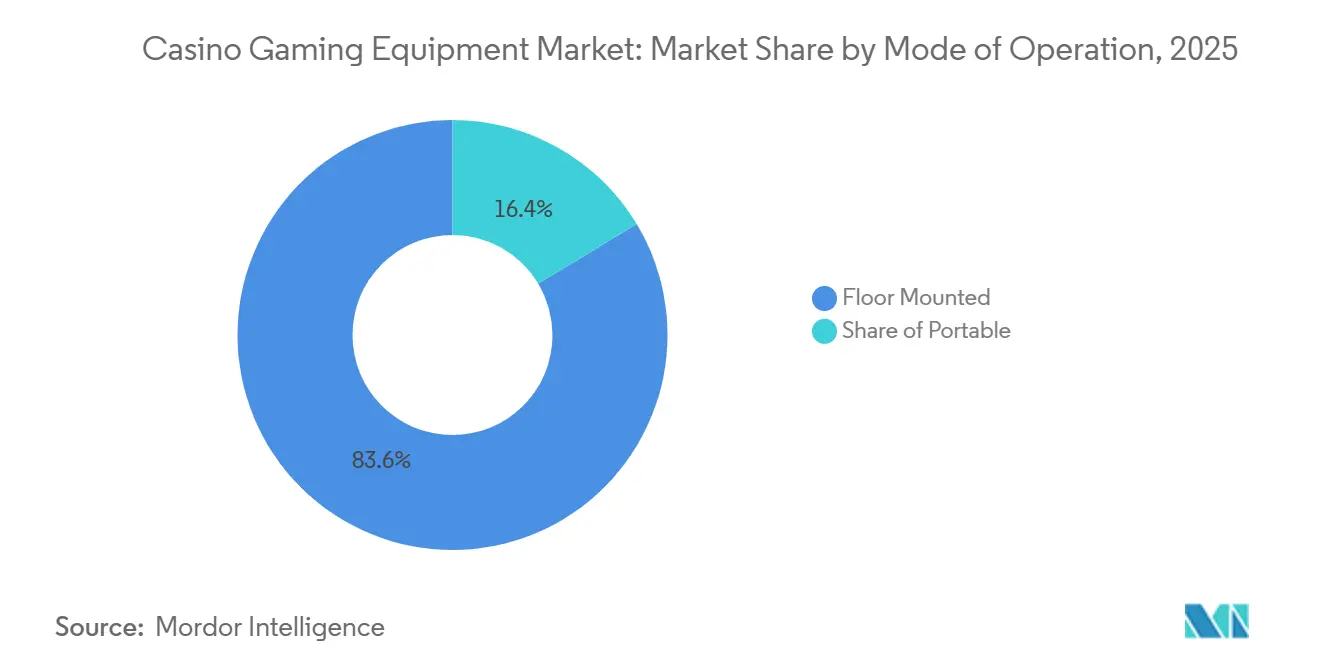
- By mode of operation, floor-mounted equipment accounted for 83.63% share of the Global Casino Gaming Equipment Market in 2025, while portable units are forecast to rise at a 6.93% CAGR through 2031.
- By end user, casinos represented 56.12% share of the Global Casino Gaming Equipment Market in 2025, while the cruise ship segment is expected to expand to a 7.64% CAGR through 2031.
- By geography, North America held 34.76% share of the Global Casino Gaming Equipment Market in 2025, while Asia-Pacific is forecast to grow at a 6.68% CAGR through 2031.
Note: Market size and forecast figures in this report are generated using Mordor Intelligence’s proprietary estimation framework, updated with the latest available data and insights as of January 2026.
Global Casino Gaming Equipment Market Trends and Insights
Drivers Impact Analysis*
| Drivers | (~) % Impact on CAGR Forecast | Geographic Relevance | Impact Timeline |
|---|---|---|---|
| Gambling legalization and integrated resort expansion | +2.1% | Global, with primary gains in Asia-Pacific, the Middle East, and South America | Long term (≥ 4 years) |
| Slot floor refresh and premium cabinet replacement | +1.5% | North America and Europe, with spillover to Oceania | Medium term (2-4 years) |
| Casino digitalization and cashless wallet enablement | +1.2% | North America and Australia, with rising adoption in Europe and Asia-Pacific | Medium term (2-4 years) |
| Surveillance, analytics, and casino management system modernization | +1.0% | Global, with early gains in the United States, Macau, South Korea, and Australia | Long term (≥ 4 years) |
| Faster Nevada device approval cycles | +0.4% | North America, with secondary influence on markets that reference Nevada standards | Short term (≤ 2 years) |
| Thailand integrated resort pipeline | +0.3% | Southeast Asia and broader Asia-Pacific | Long term (≥ 4 years) |
| Source: Mordor Intelligence | |||
Gambling legalization and integrated resort expansion
Integrated resort developments in Asia-Pacific and the Middle East are significantly supporting the casino gaming equipment market. Las Vegas Sands began expanding Marina Bay Sands IR2, with completion expected in 2031, ensuring sustained procurement activity[1]Las Vegas Sands, “Las Vegas Sands Breaks Ground on US$8 Billion Expansion at Marina Bay Sands,” Channel News Asia, channelnewsasia.com. MGM Osaka started construction with revised investment plans and aims to open by 2030, driving long-term equipment demand in Japan. Wynn Resorts is progressing with its Ras Al Khaimah property, targeting a 2027 opening, reinforcing the Gulf's potential as a key market for luxury gaming resort equipment. Integrated resorts typically require substantial investments in gaming equipment, including slot floors, electronic table games, live table infrastructure, and casino management systems. This extended procurement cycle enables suppliers to plan capacity, allocate resources, and strengthen partnerships within the casino gaming equipment sector. It also minimizes the irregular demand patterns often associated with shorter replacement cycles, ensuring a more stable and predictable market environment.
Slot floor refresh and premium cabinet replacement
In mature regions, the casino gaming equipment market is primarily driven by replacement demand for aging slot floors rather than new licenses. Light & Wonder introduced the LightWave cabinet at G2E 2025, featuring a portrait format and synchronized surround features to enhance visibility for operators[2]Light & Wonder, “Light & Wonder Unveils LightWave Cabinet and Four New Hardware Innovations at G2E 2025,” Tribal Gaming & Hospitality Magazine, tgandh.com. Konami reported that its Solstice 49C quickly became a top-performing cabinet in the Portrait Upright category, with strong performance at multiple casino sites. ZCG-backed Apex Hospitality initiated a phased slot modernization program across its properties in 2026, reflecting private operators' willingness to invest in improving floor productivity. Slot cabinets generally follow a replacement cycle of several years, and those installed during the 2019 to 2021 expansion period are now due for updates. This aligns with the current forecast period, providing a stable capital expenditure base for the casino gaming equipment market in North America and Europe. Replacement demand is influencing both shipment volumes and supplier revenue streams.
Casino digitalization and cashless wallet enablement
Cashless gaming is transforming the casino gaming equipment market. Digital payment adoption allows operators to recover revenue lost to cash-management inefficiencies while increasing player engagement. This shift requires upgrades such as new kiosks, ticket printers, bill validators, and enhanced integration with casino management systems. Win Systems demonstrated this trend by deploying its Wigos CMS at Casino City Center Rosario, connecting thousands of slot machines and introducing a QR-based cashless option through WinPay. Adoption is expanding across established and emerging gaming markets. Operators are focusing on faster funding, reduced cash handling, and stronger system integration, driving a new equipment cycle centered on payment infrastructure rather than content updates. This evolution is influencing purchasing decisions for cabinets, kiosks, and systems, particularly in locations where gaming supports broader tourism strategies. Payment modernization is now a critical factor shaping the casino gaming equipment market.
Surveillance, analytics, and casino management system modernization
The casino gaming equipment market is advancing with a shift from basic control systems to data-driven platforms. Konami and Xailient introduced SYNK Vision Tables at G2E Asia 2025, incorporating privacy-safe facial recognition into the SYNKROS CMS, enabling cardless identification for slots and tables. Aristocrat supported this trend in February 2026 by acquiring Gaming Analytics, a United States provider of AI tools for player analysis, slot optimization, and marketing automation. At ICE Barcelona 2026, Aristocrat highlighted its T-Connect CMS as a framework for connected casino floors, leveraging intelligent software and smart sensor inputs. Operators increasingly view these systems as essential revenue tools, integrating player tracking, payments, AML workflows, surveillance, and table management. This trend is driving software-focused suppliers ahead of traditional cabinet vendors in the market. Additionally, the growing importance of recurring software and service agreements is benefiting both new resort developments and upgrades to existing casino floors.
Restraints Impact Analysis*
| Restraints | (~) % Impact on CAGR Forecast | Geographic Relevance | Impact Timeline |
|---|---|---|---|
| Licensing complexity and jurisdiction-specific certification | -0.8% | Global, with the sharpest effect in Asia-Pacific, the European Union, and United States tribal markets | Long term (≥ 4 years) |
| High capex and replacement-cycle discipline | -0.5% | North America and Europe, with secondary effects in emerging regions | Medium term (2-4 years) |
| Cashless enrollment and systems-integration friction | -0.4% | North America, Europe, and Asia-Pacific | Medium term (2-4 years) |
| Facial-recognition compliance and player-privacy scrutiny | -0.3% | Australia, the European Union, and United States with privacy legislation | Long term (≥ 4 years) |
| Source: Mordor Intelligence | |||
Licensing complexity and jurisdiction-specific certification
Regulatory fragmentation remains one of the clearest restraints on the casino gaming equipment market. Even after Nevada accelerated approvals, suppliers still face separate certification requirements across tribal markets, European member states, and many Asia-Pacific jurisdictions. Those processes can stretch to 12 to 24 months and can cost USD 500,000 to USD 2 million per jurisdiction for a single product variant, which raises launch costs and slows rollout. The burden falls hardest on smaller suppliers that lack the legal, testing, and field-service scale needed to support repeated submissions. This keeps innovation moving more slowly than demand in some categories and reinforces the concentration already visible across the casino gaming equipment market. It also lengthens payback periods for research and development spending on new device formats.
High capex and replacement-cycle discipline
Equipment demand is capital intensive, and that creates a brake on the casino gaming equipment market when operators become more selective with floor spending. Premium cabinets, stadium electronic table games, and full management system upgrades require large upfront outlays, and those purchases compete with hotel, food, entertainment, and property renovation budgets inside integrated resorts. Replacement decisions therefore follow return thresholds rather than simple age thresholds, especially in mature North American and European properties. Pure hardware vendors are more exposed because cabinet features alone do not always justify faster swap-outs when margins are under pressure. This is one reason software-led suppliers are outperforming, while mid-tier hardware lines face rising commoditization and slower replacement timing. Operators remain selective because each replacement program must compete with wider property investment needs.
*Our forecasts treat driver/restraint impacts as directional, not additive. The impact forecasts reflect baseline growth, mix effects, and variable interactions.
Segment Analysis
By Product Type: Software Layers Are Rising, But Machines Still Anchor Spend
Gaming machines accounted for 41.82% of the casino gaming equipment market share in 2025, making them the largest product category by revenue. This position reflects the widespread installation of slot and video poker units across commercial casinos, tribal properties, and other licensed venues. Hardware advancements remain important, as updated cabinets improve visibility and usage rates. Examples include Light & Wonder's LightWave and Konami's Solstice 49C, which focus on enhancing visual impact and engagement. Video poker and Class II electronic bingo, though smaller segments, continue to play a role in United States tribal settings where regulations often favor these formats[3]Konami Gaming, “Konami Gaming Awarded Exclusive Agreement by the British Columbia Lottery Corporation for Next Generation BC Gold Wide Area Progressive Slots,” Konami Gaming, konamigaming.com.
Casino management systems (CMS) are expected to grow at a 7.35% CAGR through 2031, making them the fastest-growing segment in the casino gaming equipment market. Operators now use CMS platforms for functions such as player tracking, accounting, cashless integration, AML compliance, and marketing coordination, expanding beyond basic reporting. Aristocrat's acquisition of Gaming Analytics and TCSJOHNHUXLEY's T-Connect highlight the increasing importance of system software. Live table equipment remains steady, as operators value quality and reliability in wheels, shufflers, chips, and layouts. Cash handling and TITO systems face mixed prospects; while cashless adoption drives current replacement demand, it signals a potential long-term decline in cash usage. This shift indicates a growing emphasis on software within the casino gaming equipment market.


By Installation: Core Casino Floors Remain Dominant While Distributed Venues Expand
Inside-casino deployments accounted for 85.91% of the casino gaming equipment market revenue in 2025, establishing their dominance. Licensed casino floors, which generate the highest revenue per unit, consistently adopt the latest cabinets, casino management systems, live table technology, and payment infrastructure. Large resort environments in Las Vegas, Macau, and Singapore drive this trend, where visible hardware upgrades influence purchasing decisions for new developments. Suppliers prefer on-floor deployments due to predictable service economics, maintenance planning, and system integration within purpose-built venues. The market remains heavily reliant on capital expenditure decisions by casino operators and integrated resort developers.
Outside-casino channels are projected to grow at a 6.47% CAGR through 2031, surpassing the overall market growth rate. This segment includes gaming clubs, route operators, cruise environments, hotels, malls, and other non-casino placements, expanding the reach of gambling activities. Growth in these locations demonstrates that advanced content and connected equipment are no longer confined to flagship casino floors. Distributed gaming networks in several regions already represent a significant installed base, with venue modernization driving demand for updated linked products and operating systems. Regulatory frameworks remain a key factor influencing growth, as licensing structures and compliance rules vary by jurisdiction. Despite these challenges, the increasing use of gaming outside traditional casinos continues to expand the addressable installed base.
By Mode of Operation: Fixed Floors Lead Revenue While Portable Formats Create Flexibility
Floor-mounted units accounted for 83.63% of revenue in the casino gaming equipment market in 2025, securing a dominant position. These fixed machines integrate with surveillance grids, management systems, loyalty programs, and cashless infrastructures aligning with the needs of high-throughput casino floors. Their design ensures density, durability, and uptime, essential for 24-hour resort operations. The continued opening of integrated resorts in Asia-Pacific and the Middle East reinforces the preference for fixed floor layouts, ensuring floor-mounted equipment remains a key volume driver for suppliers during the forecast period.
Portable units are projected to grow at a 6.93% CAGR through 2031, reflecting increasing demand for flexibility in specific scenarios. This segment benefits from cruise ship demand, event-based gaming, and venues requiring adaptable layouts without permanent infrastructure. In March 2026, Jackpot Digital expanded its United States presence after receiving approval from the Louisiana Gaming Control Board for its dealer less electronic poker tables. Portable formats are ideal for properties adjusting capacity based on seasonality, guest demographics, or temporary luxury events tied to casino tourism[4]Jackpot Digital, “Jackpot Digital Secures Approval from Louisiana Gaming Control Board,” Nasdaq, nasdaq.com. Despite their growth, portable equipment complements rather than replaces fixed floors in the broader casino gaming equipment market. Its value lies in flexibility and space efficiency rather than dominating unit sales.
By End User: Casino Operators Still Dominate Procurement, But Cruise Lines Are the Fastest-Rising Buyer Group
Casinos held 56.12% of the casino gaming equipment market in 2025, reflecting their scale and diverse equipment requirements. Integrated resort operators are outpacing smaller regional properties by investing more in cashless tools, analytics, biometric loyalty systems, and advanced cabinets. This increases equipment usage per floor position and shifts revenue toward suppliers offering comprehensive solutions. Market concentration is also rising, as major operators prefer vendors capable of managing approvals, servicing, and integration across jurisdictions. Casino operators remain the primary demand drivers in the casino gaming equipment market.
Cruise ships are projected to grow at a 7.64% CAGR through 2031, making them the fastest-growing end-user segment. Growth is driven by new ship orders, expanded itineraries, and gaming's role as a significant onboard revenue source. Operators are moving from traditional slot layouts to linked progressives, dealerless tables, and improved payment systems, aligning with land-based standards. Jackpot Digital’s installations across cruise brands demonstrate the suitability of space-efficient, low-staff formats in this environment. The casino gaming equipment market remains closely tied to changes in luxury travel and onboard entertainment strategies. Cruise demand also provides suppliers with growth opportunities beyond traditional land-based replacement cycles.
Geography Analysis
North America accounted for 34.76% of the casino gaming equipment market share in 2025, driven by the extensive United States commercial and tribal casino base and replacement spending rather than new developments. The region continues to witness steady upgrades in gaming cabinets, systems, and payment technologies. Nevada's AB 58 expedited launch timelines and reduced inventory delays for suppliers. Canada also maintains stable demand through provincial procurement programs, while lottery-linked casino networks continue to support machine orders across the region.
Asia-Pacific is projected to grow at a 6.68% CAGR through 2031, making it the fastest-growing region in the casino gaming equipment market. The region combines a significant resort development pipeline with a complex regulatory environment, creating both opportunities and operational challenges. Japan’s Osaka project and Singapore’s Marina Bay Sands expansion are sustaining multi-year procurement activity, while Macau’s concessionaire expansions continue to drive system and gaming floor upgrades. Additional projects across the Philippines, Vietnam, and the United Arab Emirates further strengthen the region’s long-term demand outlook. Suppliers with strong localized compliance and service capabilities are well-positioned to capitalize on these opportunities.

Competitive Landscape
The casino gaming equipment market is highly concentrated, with a small group of suppliers dominating the market. Aristocrat Gaming, Light & Wonder, IGT, Konami Gaming, and Everi have maintained their position by effectively managing approvals, service networks, product roadmaps, and procurement cycles across various jurisdictions. This concentration provides an advantage, as larger suppliers collaborate with operators to support integrated systems rather than focusing solely on hardware sales. Vendors offering a combination of cabinets, software, analytics, cashless solutions, and compliance tools on a unified platform are becoming increasingly significant, benefiting companies with both scale and software expertise.
Apollo Global Management completed a major acquisition of IGT's Gaming and Digital business along with Everi Holdings, creating a combined enterprise centered on Gaming, Digital, and FinTech operations. This move underscored the growing importance of software, digital solutions, and payment systems in the competitive landscape. Aristocrat expanded its capabilities through agreements and acquisitions, extending its focus beyond cabinets to include digital engagement and operational intelligence. Everi, following the Apollo transaction, transitioned from an independent public company but retained relevance in specific payments and gaming areas. These developments highlight the increasing importance of ownership changes, software capabilities, and payment integration over hardware catalog breadth.
Competition below the top tier remains active but is concentrated in specific categories and regions. Konami has strengthened its position through strategic product execution and regional contracts, supported by agreements and product performance. Light & Wonder has focused on hardware innovation, while niche providers remain relevant in areas such as cruise lines, dealerless tables, and connected floors. Smaller entrants face challenges due to the capital and time required for device approvals, maintenance, and enterprise integration. The market structure continues to favor established players with broad portfolios and global reach, as service depth and regulatory approvals require significant time to develop.
Casino Gaming Equipment Industry Leaders
Aristocrat Gaming
Light & Wonder
International Game Technology (IGT)
Konami Gaming
Everi
- *Disclaimer: Major Players sorted in no particular order

Recent Industry Developments
- March 2026: Jackpot Digital has obtained manufacturer, and supplier permits from the Louisiana Gaming Control Board. This authorization enables the company to provide its Jackpot Blitz dealerless poker electronic table games (ETGs) to all licensed casinos in Louisiana, expanding its regulated presence in the United States market.
- February 2026: Aristocrat has acquired Gaming Analytics, a US-based provider of AI-powered player analytics and slot optimization, to strengthen its CMS and data platform capabilities for land-based casino operations, according to an Aristocrat press release.
- February 2026: Konami's Solstice 49C ranked first in the Portrait Upright category, achieving over double the average floor performance of nearby zones at multiple United States casinos shortly after its launch, according to a Konami Gaming press release.
- January 2026: Win Systems presented key updates to its Wigos CMS at ICE Barcelona 2026, featuring multi-vault cash management and enhanced bonusing functionality. These upgrades support its network of over 660 casinos globally.


Global Casino Gaming Equipment Market Report Scope
| Gaming Machines | Slot Machines |
| Video Poker Machines | |
| Class II / Electronic Bingo Machines | |
| Electronic Table Games | Electronic Roulette |
| Electronic Baccarat | |
| Electronic Sic Bo / Multi-game Terminals | |
| Live Table Gaming Equipment | Roulette Wheels |
| Shufflers and Deck Checkers | |
| Tables, Layouts, and Accessories | |
| Chips, Plaques, and Jetons | |
| Casino Management Systems | Player Tracking and Loyalty Systems |
| Slot and Table Management Systems | |
| Cash Handling and TITO Systems (Bill Validators,Ticket Printers, and Readers |
| Installed Inside Casino |
| Installed Outside Casino |
| Floor Mounted |
| Portable |
| Casinos |
| Malls |
| Cruise Ships |
| Hotels and Resorts |
| Gaming Clubs and Route Operators |
| North America | United States |
| Canada | |
| Mexico | |
| South America | Brazil |
| Peru | |
| Chile | |
| Argentina | |
| Rest of South America | |
| Europe | United Kingdom |
| Germany | |
| France | |
| Spain | |
| Italy | |
| BENELUX (Belgium, Netherlands, and Luxembourg) | |
| NORDICS (Denmark, Finland, Iceland, Norway, and Sweden) | |
| Rest of Europe | |
| Asia-Pacific | India |
| China | |
| Japan | |
| Australia | |
| South Korea | |
| South East Asia (Singapore, Malaysia, Thailand, Indonesia, Vietnam, and Philippines) | |
| Rest of Asia-Pacific | |
| Middle East And Africa | United Arab Emirates |
| Saudi Arabia | |
| South Africa | |
| Nigeria | |
| Rest of Middle East And Africa |
| By Product Type | Gaming Machines | Slot Machines |
| Video Poker Machines | ||
| Class II / Electronic Bingo Machines | ||
| Electronic Table Games | Electronic Roulette | |
| Electronic Baccarat | ||
| Electronic Sic Bo / Multi-game Terminals | ||
| Live Table Gaming Equipment | Roulette Wheels | |
| Shufflers and Deck Checkers | ||
| Tables, Layouts, and Accessories | ||
| Chips, Plaques, and Jetons | ||
| Casino Management Systems | Player Tracking and Loyalty Systems | |
| Slot and Table Management Systems | ||
| Cash Handling and TITO Systems (Bill Validators,Ticket Printers, and Readers | ||
| By Installation | Installed Inside Casino | |
| Installed Outside Casino | ||
| By Mode of Operation | Floor Mounted | |
| Portable | ||
| By End User | Casinos | |
| Malls | ||
| Cruise Ships | ||
| Hotels and Resorts | ||
| Gaming Clubs and Route Operators | ||
| By Geography | North America | United States |
| Canada | ||
| Mexico | ||
| South America | Brazil | |
| Peru | ||
| Chile | ||
| Argentina | ||
| Rest of South America | ||
| Europe | United Kingdom | |
| Germany | ||
| France | ||
| Spain | ||
| Italy | ||
| BENELUX (Belgium, Netherlands, and Luxembourg) | ||
| NORDICS (Denmark, Finland, Iceland, Norway, and Sweden) | ||
| Rest of Europe | ||
| Asia-Pacific | India | |
| China | ||
| Japan | ||
| Australia | ||
| South Korea | ||
| South East Asia (Singapore, Malaysia, Thailand, Indonesia, Vietnam, and Philippines) | ||
| Rest of Asia-Pacific | ||
| Middle East And Africa | United Arab Emirates | |
| Saudi Arabia | ||
| South Africa | ||
| Nigeria | ||
| Rest of Middle East And Africa | ||


Key Questions Answered in the Report
What is the size outlook for casino gaming equipment through 2031?
The Global Casino Gaming Equipment Market size stood at USD 11.82 billion in 2025, reached USD 12.54 billion in 2026, and is forecast to reach USD 16.93 billion by 2031 at a 6.2% CAGR.
Which product group is growing the fastest in this space?
Casino management systems are the fastest-growing product segment, with forecast growth of 7.35% CAGR through 2031, as operators invest more in analytics, payments, AML tools, and player tracking.
Why do integrated resorts matter so much for equipment demand?
Integrated resorts create large multi-year procurement cycles because each property may require USD 200 million to USD 400 million in gaming machines, ETGs, table infrastructure, and CMS deployment.
Which region leads current revenue and which one is growing the fastest?
North America led with 34.76% of revenue in 2025, while Asia-Pacific is forecast to grow the fastest at 6.68% CAGR through 2031.
How concentrated is supplier competition?
Supplier concentration is high because Aristocrat Gaming, Light & Wonder, IGT, Konami Gaming, and Everi together held 91.20% share in 2025.
What end-user group is expanding the fastest?
Cruise ships are the fastest-growing end-user segment with a projected 7.64% CAGR through 2031, supported by new ship orders and higher onboard gaming investment.
Page last updated on:


