Adventure Tourism Market Size and Share
Market Overview
| Study Period | 2022 - 2031 |
|---|---|
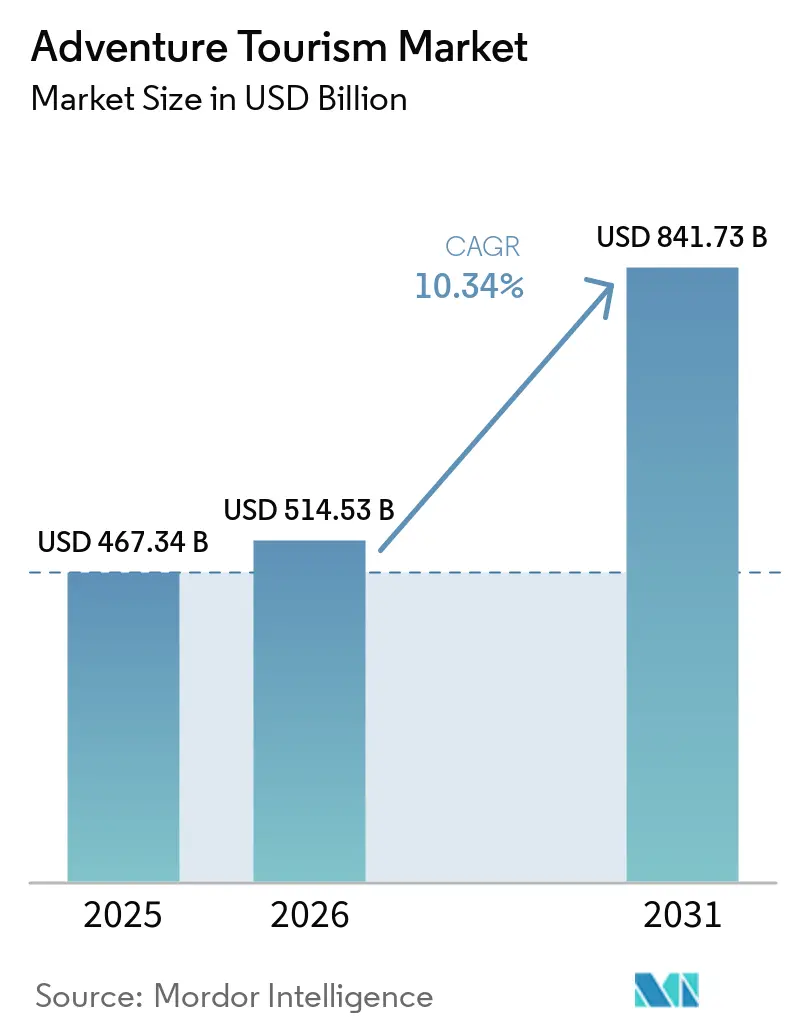
| Market Size (2026) | USD 514.53 Billion |
| Market Size (2031) | USD 841.73 Billion |
| Growth Rate (2026 - 2031) | 10.34% CAGR |
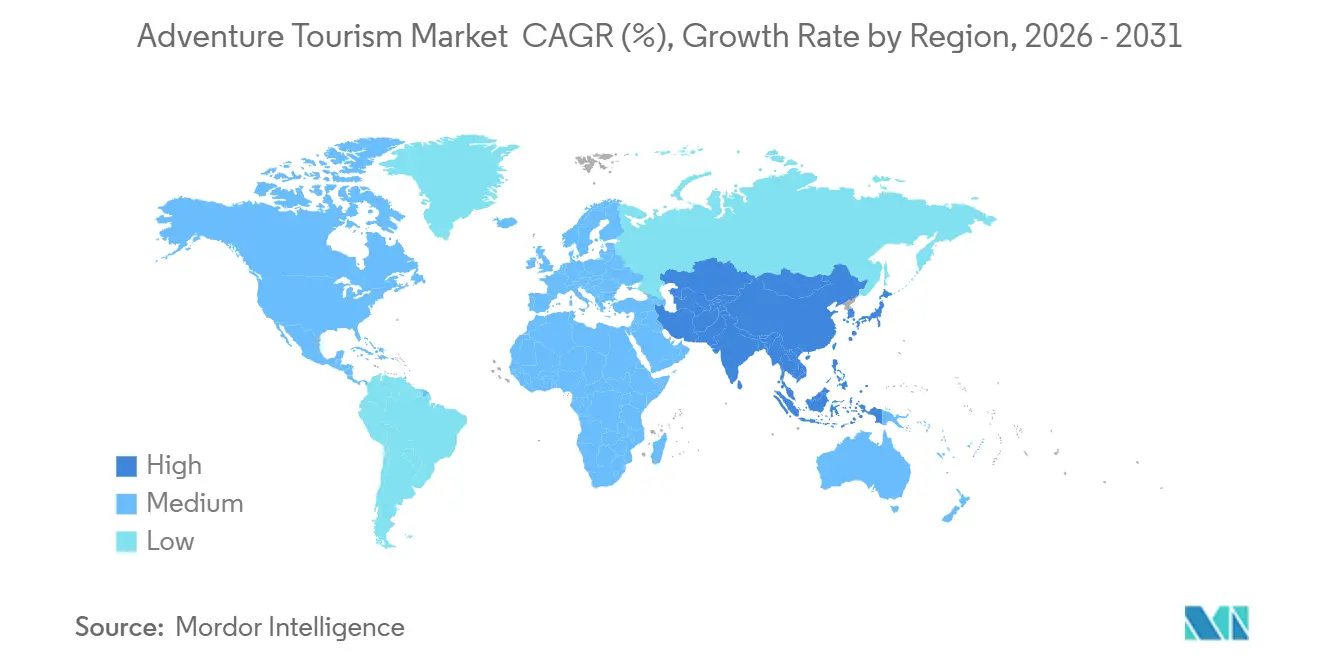
| Fastest Growing Market | Asia-Pacific |
| Largest Market | Europe |
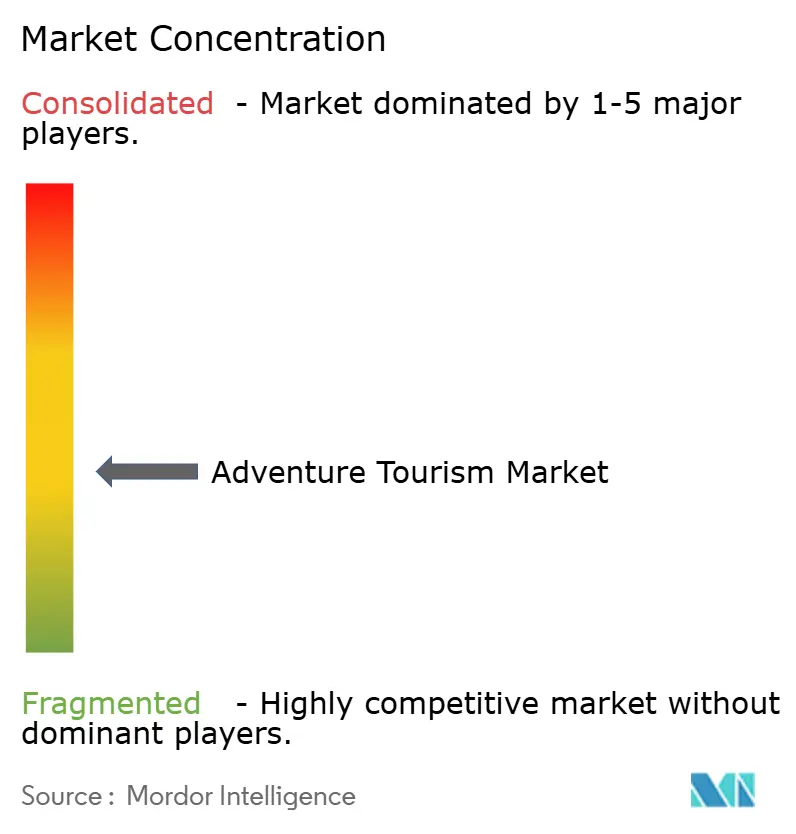
| Market Concentration | Medium |
Major Players *Disclaimer: Major Players sorted in no particular order Image © Mordor Intelligence. Reuse requires attribution under CC BY 4.0. | |
Adventure Tourism Market Analysis by Mordor Intelligence
The global adventure tourism market size stood at USD 514.53 billion in 2026, up from USD 467.34 billion, and is projected to reach USD 841.73 billion by 2031 at an 10.34% CAGR. The recovery backdrop remains favorable, with international tourist arrivals reaching 1.52 billion in 2025, up 4% from 2024, which confirms that cross-border travel demand had largely normalized by the start of 2026. ATTA also placed the broader adventure-oriented outbound opportunity at USD 1.16 trillion in 2024, indicating that a large share of adventure demand still flows through general tourism channels rather than solely through specialist operators. That gap supports current investment in direct distribution, curated itineraries, and integrated digital selling across the adventure tourism market, as operators seek to capture a larger share of travel spending previously fragmented across intermediaries. Product design is also shifting toward lower-impact, more experience-led itineraries that combine outdoor activities with food, culture, and wellness, broadening the addressable customer base across the adventure tourism market. Safety costs, climate disruption, and political risk still shape the operating environment. Yet, most operators entered 2026 expecting stronger profitability, suggesting the adventure tourism market is moving from pure volume recovery to more disciplined margin expansion.
Key Report Takeaways
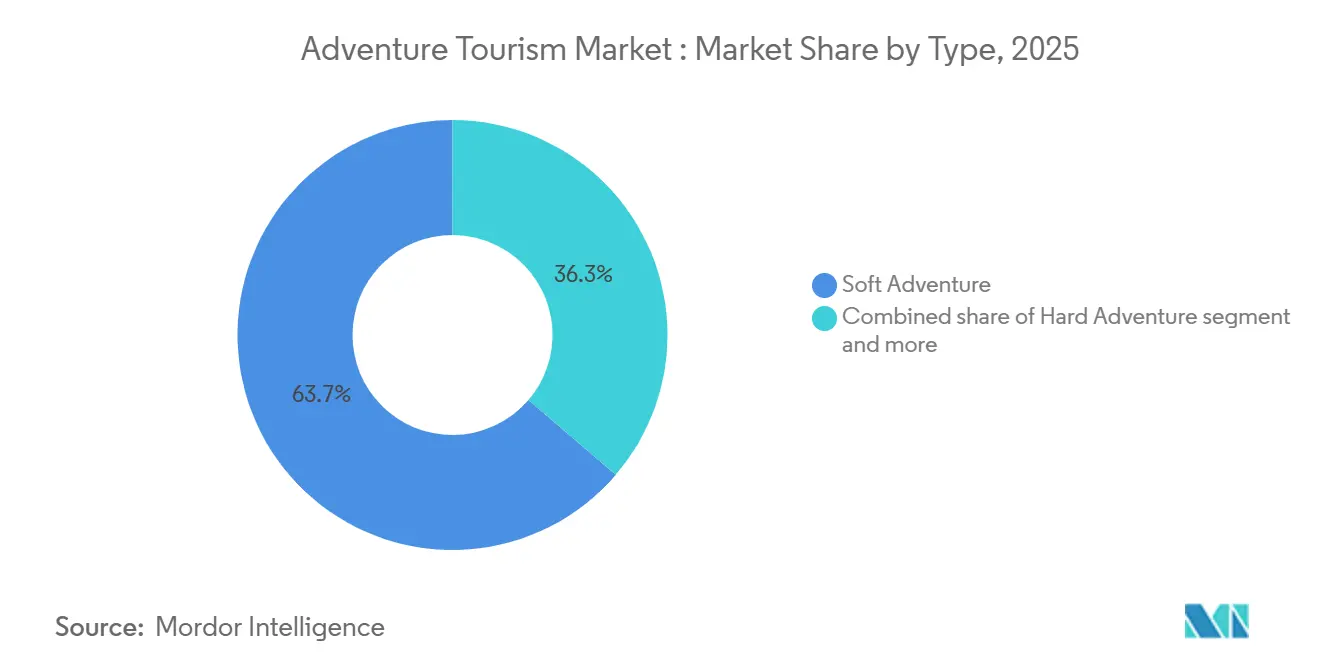
- By type, soft adventure held 63.7% of the adventure tourism market share in 2025, while hard adventure is projected to expand at a 10.9% CAGR through 2031.
- By activity, land-based activities accounted for 48.9% of the adventure tourism market in 2025, while air-based activities are forecast to grow at an 11.2% CAGR through 2031.
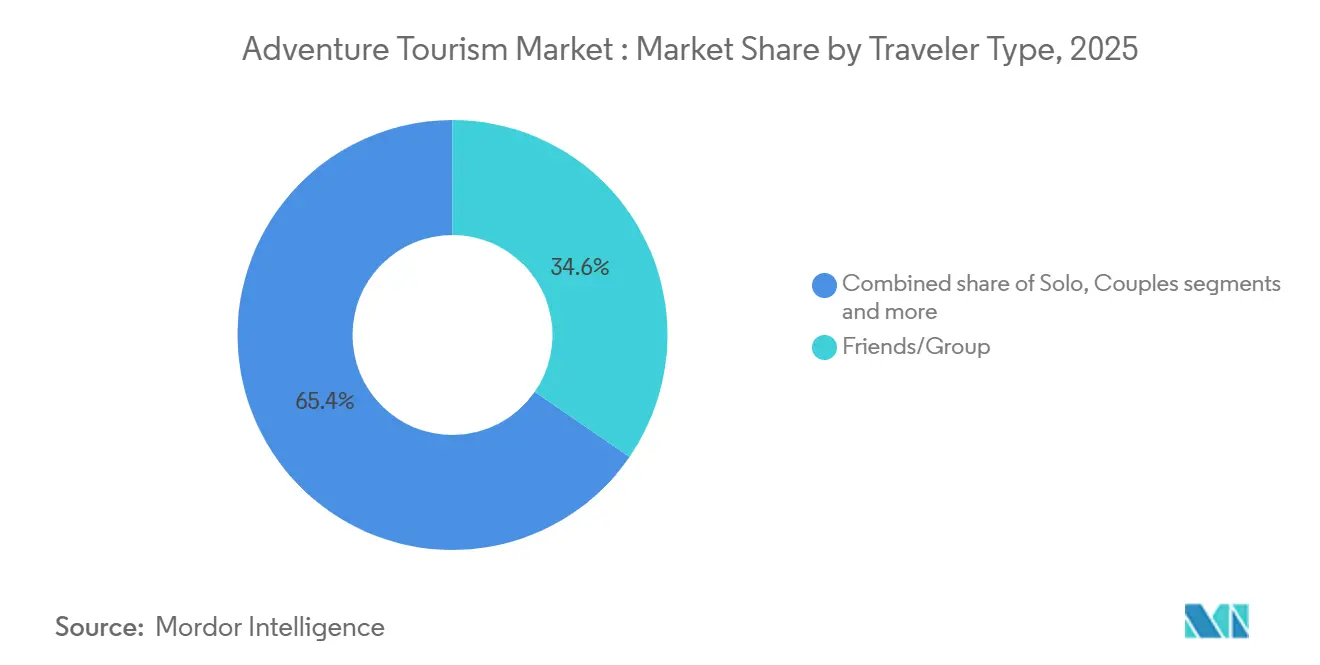
- By traveler type, friends or group travel held a 34.6% of the adventure tourism market in 2025, while solo travel is projected to record the highest CAGR at 11.9% through 2031.
- By booking mode, marketplace or OTA bookings led the adventure tourism market with 44.8% in 2025, while direct bookings are forecast to grow at a 11.6% CAGR through 2031.
- By geography, Europe led the adventure tourism market with 31.9% in 2025, while Asia-Pacific is projected to record the highest regional CAGR of 10.6% through 2031.
Note: Market size and forecast figures in this report are generated using Mordor Intelligence’s proprietary estimation framework, updated with the latest available data and insights as of January 2026.
Global Adventure Tourism Market Trends and Insights
Drivers Impact Analysis*
| Driver | (~) % Impact on CAGR Forecast | Geographic Relevance | Impact Timeline |
|---|---|---|---|
| Growing Preference for Adventure-Led and Experience-Centric Vacations | +2.5% | Global, strongest in North America, Europe, and Asia-Pacific | Medium term (2-4 years) |
| Increasing Popularity of Solo, Gen Z, And Millennial Travel | +1.8% | Global, with early gains in South and Southeast Asia | Medium term (2-4 years) |
| Expansion Of Adventure Infrastructure in Emerging Destinations | +1.5% | Asia-Pacific, MEA, South America, secondary in North America | Long term (≥ 4 years) |
| Rising Social Media Influence on Outdoor and Extreme Travel Trends | +1.2% | Global, concentrated in markets with high digital penetration | Short term (≤ 2 years) |
| Growth In Eco-Tourism and Nature-Based Exploration Activities | +1.0% | Europe, Africa, South America, Oceania | Long term (≥ 4 years) |
| Rapid Growth of Digital Booking Platforms and Customized Travel Planning | +1.3% | Global, with early gains in India, Southeast Asia, and North America | Short term (≤ 2 years) |
| Source: Mordor Intelligence | |||
Growing Preference for Adventure-Led and Experience-Centric Vacations
Experience-led travel continues to replace passive leisure as a core demand pattern across the adventure tourism market. ATTA consumer research found that 67% of international travelers were open to adventure, which shows that demand now extends far beyond traditional backpackers or extreme-sport travelers. ATTA also reported average spending of USD 3,000 per adventure trip and USD 265 per person per night, confirming that travelers are willing to spend meaningfully on guided, curated experiences. The same operator work found that 75% of trip revenue flows directly into local economies, which helps explain why destination authorities increasingly support trail access, visitor services, and nature-linked tourism development. Hiking, trekking, and walking remained the top activities globally. Yet, culinary experiences moved into second place, showing that the adventure tourism market is broadening into mixed itineraries rather than remaining limited to pure physical challenge. That pattern favors operators that combine outdoor movement with local food, culture, and place-based storytelling, because those products better align with a larger share of customer intent across the adventure tourism market.
Increasing Popularity of Solo, Gen Z, And Millennial Travel
Solo travel is the fastest-growing traveler segment in the adventure tourism market, with an 11.9% CAGR projected through 2031. The growth pattern is closely tied to younger travelers, especially Gen Z and millennials, who continue to prefer flexible, social, and experience-heavy travel formats. A peer-reviewed study in Sustainability found that Gen Z travelers consistently prioritized outdoor and adventure activities, including hiking, zip-lining, and extreme sports, while also placing strong importance on cultural experiences and social interaction[1]MDPI.COM https://www.mdpi.com/2071-1050/17/14/6601. That mix supports the current structure of the adventure tourism market, because many younger travelers do not separate activity, identity, and social experience in the way older travel models often assumed. It also explains why solo travel can grow quickly, even though friends and group travel still hold the largest cohort share, since many solo customers choose structured group departures rather than fully independent itineraries. Operators that build small-group products with strong community design, provide guided support, and offer local immersion are therefore better aligned with the strongest demand pocket in the adventure tourism market.
Expansion of Adventure Infrastructure in Emerging Destinations
The adventure tourism market is also supported by infrastructure investments in destinations that were previously difficult to commercialize at scale. Saudi Arabia’s Vision 2030 framework treats adventure tourism as a priority area and links it to destination access, conservation, experience quality, and private investment[2]VISION2030.AI https://vision2030.ai/sectors/tourism/adventure-tourism/. The same framework highlights new air access, mountain and desert product development, and protected marine assets, which together widen the activity base available to operators. This matters because the main barrier in many emerging destinations is not raw natural appeal, but the lack of last-mile roads, emergency response, communications coverage, trained guides, and standardized visitor services. Once those layers are added, destinations can support more reliable departures, higher-value itineraries, and a better safety profile, all of which improve commercial viability across the adventure tourism market. The long-term benefit is that infrastructure investment not only adds capacity but also opens new route combinations and secondary destinations, reducing pressure on already crowded corridors.
Rising Social Media Influence on Outdoor and Extreme Travel Trends
Social media now acts as a core demand engine across the adventure tourism market rather than as a simple promotional tool. Industry conference data from early 2026 showed that 38% of operators cited cycling and e-bike trips as in growth, up from 19% in 2025, which points to the speed at which visual formats can shift traveler attention[3]Restraint (~) % Impact on CAGR Forecast Geographic Relevance Impact Timeline Safety, liability, and insurance burden in high-risk activities -1.8% Global, most acute in high-altitude and water-based activity markets Medium term (2–4 years) Climate and seasonality disruptions to adventure destinations -0.9% Alpine Europe, high-altitude APAC, coastal MEA, and Oceania Long term (≥ 4 years) Seasonal dependency and weather-driven demand volatility -1.4% Mountainous regions in APAC and Europe; coastal regions globally Long term (≥ 4 years) High safety risks and accident-related concerns in extreme activities -0.7% Global, concentrated in aerial, high-altitude, and whitewater segments Medium term (2–4 years) . ATTA also found that word of mouth and social media were the most effective marketing channels for operators, and that these channels remained central to stable, growing marketing budgets in 2026. The effect is positive for discovery, but it is unevenly distributed: highly visible destinations absorb disproportionate demand, while lower-profile regions remain underrepresented. That concentration creates operational pressure in famous destinations and can narrow the perceived product map of the adventure tourism market, even as supply diversity grows in the background. Operators that invest in original destination content and early route storytelling are in a stronger position to steer demand toward lower-competition itineraries before pricing pressure builds.
Restraints Impact Analysis*
| Restraint | (~) % Impact on CAGR Forecast | Geographic Relevance | Impact Timeline |
|---|---|---|---|
| Safety, liability, and insurance burden in high-risk activities | -1.8% | Global, most acute in high-altitude and water-based activity markets | Medium term (2–4 years) |
| Climate and seasonality disruptions to adventure destinations | -0.9% | Alpine Europe, high-altitude Asia-Pacific, coastal MEA, and Oceania | Long term (≥ 4 years) |
| Seasonal dependency and weather-driven demand volatility | -1.4% | Mountainous regions in Asia-Pacific, and Europe; coastal regions globally | Long term (≥ 4 years) |
| High safety risks and accident-related concerns in extreme activities | -0.7% | Global, concentrated in aerial, high-altitude, and whitewater segments | Medium term (2–4 years) |
| Source: Mordor Intelligence | |||
Safety, Liability, and Insurance Burden in High-Risk Activities
Safety remains one of the clearest operating constraints in the adventure tourism market, especially in high-altitude, aerial, and water-based categories. The American Alpine Club recorded 49 climbing fatalities and 174 injuries in the United States in 2024, for a total of 190 accidents, indicating that rising participation in climbing continues to create a heavy incident-management burden even as risk-management practices improve. The United States Parachute Association reported 9 skydiving fatalities across 3.88 million jumps in 2024, yielding a fatality index of 0.23 per 100,000 skydives, underscoring how closely insurers and operators track even low-frequency but high-severity events[4]PARACHUTIST.COM https://parachutist.com/a-milestone-in-safetythe-2024-fatality-summary. The problem for the adventure tourism market is not limited to fatalities; broader participation also increases the number of rescues, claims, training needs, compliance checks, and equipment standards that operators must fund. Smaller operators are exposed more sharply when insurance products are shallow or inconsistent, particularly in emerging destinations where infrastructure is expanding faster than formal risk coverage. Markets that adopt stronger certification and operating frameworks may face higher upfront compliance costs, but they are better positioned to lower long-run liability exposure and build more durable trust.
Seasonal Dependency and Weather-Driven Demand Volatility
Weather volatility remains a structural restraint for the adventure tourism market because it changes the operating window of natural assets rather than just shifting demand between months. The European Travel Commission said that climate-related events and geopolitical tensions were major risks to the 2026 tourism outlook, even as Europe recorded a 5.6% rise in international arrivals in the early part of the year. In ski-linked destinations, event support in 2026 has helped attract attention and bookings, yet mixed snow conditions have limited how evenly that demand can be converted into activity volume. High-altitude trekking corridors also face shorter, less predictable operating windows when rainfall and temperature patterns shift, reducing the number of reliable departures operators can schedule in a season. ATTA’s 2026 operator survey showed that political instability and rising overhead were the top concerns among operators expecting weaker performance, and climate disruption sits inside that cost pressure because itinerary redesign and destination switching are both expensive. As a result, the adventure tourism market is steadily rewarding operators that can spread inventory across multiple climate zones and activity types.
*Our forecasts treat driver/restraint impacts as directional, not additive. The impact forecasts reflect baseline growth, mix effects, and variable interactions.
Segment Analysis
By Type: Soft Adventure Dominant, Hard Adventure Gaining Structural Momentum
Soft adventure held 63.7% of the adventure tourism market share in 2025, while hard adventure is projected to grow at a 10.9% CAGR through 2031. Soft adventure remains the larger category because it covers a wide base of low-to-moderate risk experiences such as trekking, camping, wildlife safaris, and guided cycling. That breadth gives the adventure tourism market a larger entry funnel, since many first-time or occasional travelers are willing to try nature-based and guided activities without committing to high-risk products. ATTA’s 2026 operator findings also pointed to stronger interest in expert-led and lower-impact itineraries, with customized trips and women-focused travel showing clear momentum inside the soft segment. The “others” category is also becoming more meaningful, because cultural immersion, culinary exploration, and wellness-linked travel are increasingly being sold alongside physical activity rather than as separate products.
Hard adventure is growing faster as consumer barriers are slowly easing due to better equipment, stronger guide standards, and broader awareness of structured, high-skill experiences. This part of the adventure tourism market also benefits from premium positioning, since customers in these categories often accept higher prices when safety, exclusivity, and guide quality are clear. Operators at the hard end are placing greater emphasis on certification, small-group execution, and specialized staffing, raising the quality threshold for participation. ATTA’s pricing discussion also suggested that median price declines were more pronounced in mass-market soft products in 2025, while premium and harder formats were more resilient, supporting the view that differentiated supply is protecting margins at the upper end of the adventure tourism market.


By Activity: Land-Based Activities Anchor Demand, Air-Based Activities Expand Fastest
Land-based activities accounted for 48.9% of the adventure tourism market in 2025, while air-based activities are forecast to grow at an 11.2% CAGR through 2031. Land-based activities sit at the center of the adventure tourism market because they include the most scalable and globally adaptable products, especially trekking, hiking, walking, cycling, and related guided routes. ATTA identified hiking, trekking, and walking as the leading global activities, reinforcing how deeply land-based formats shape both first-time participation and repeat travel demand. The category also benefits from a broad range of price points, which helps operators serve entry-level customers and premium private groups within the same general activity family. Growth in cycling and mountain biking adds to this strength, because it gives operators a way to refresh itineraries without moving away from the land-based base of the adventure tourism market.
Air-based products are expanding faster because paragliding, skydiving, and ballooning offer strong visual appeal and high perceived uniqueness, especially in destinations that are building premium experience portfolios. Industry data showing the jump in cycling visibility also illustrates the broader point that highly visual activities can gain traction quickly when content spreads well across digital channels. Water-based activities still play an important role in the adventure tourism market through rafting, kayaking, diving, and surfing, but they are more directly shaped by marine regulations, weather conditions, and site-specific safety requirements. Compliance frameworks such as adventure safety standards and protected-area rules increasingly determine how much inventory operators can sell in sensitive marine and river settings. The result is a three-part activity structure in which land-based products provide scale, air-based products provide growth and premium appeal, and water-based products provide distinct destination value but face tighter operating constraints.
By Traveler Type: Group Travel Leads, Solo Travel Accelerates Faster
Friends-and-group travel held a 34.6% share of the adventure tourism market in 2025, while solo travel is projected to grow at a 11.9% CAGR through 2031. Group demand remains strong because shared planning, shared cost, and built-in social comfort still matter in multi-day outdoor and guided trips. This pattern has supported the adventure tourism industry for years, particularly in destinations where logistics are complex and local guide knowledge is central to the experience. At the same time, solo travel is expanding quickly because younger travelers are increasingly comfortable booking on their own and then joining structured departures that provide social connection once the trip begins. The current traveler mix, therefore, does not show a simple shift away from groups; rather, it shows a shift toward group formats designed to feel more flexible, independent, and identity-driven.
The peer-reviewed Gen Z study in Sustainability supports this reading, as it found strong interest in outdoor activities, cultural experiences, and social immersion rather than in solo travel. Couples and family travelers remain smaller shares of the adventure tourism market. Yet, they are often higher-spend categories because they require more customization, stronger safety planning, and more flexible pacing. The adventure tourism industry is therefore moving toward more segmented product design, not less, since traveler identity now shapes itinerary structure more clearly than in older package models. Operators that create dedicated solo-group lines, women-focused departures, and premium family-adventure options are better positioned to convert demand without forcing different traveler types into the same product logic.
By Booking Mode: OTA Reach Stays Large, Direct Booking Gains Strategic Importance
Marketplace or OTA bookings held a 44.8% share in 2025, while direct bookings are forecast to grow at a 11.6% CAGR through 2031. OTAs remain important in the adventure tourism market because they aggregate search demand, simplify discovery, and extend visibility for operators that would struggle to reach international audiences on their own. This scale is especially useful for smaller brands that need immediate reach in multiple source markets. Even so, the strongest strategic push inside the adventure tourism market is now toward direct customer acquisition through owned websites, repeat-customer programs, and better digital merchandising. Operators want a higher share of direct demand because it improves margin control, strengthens data ownership, and reduces exposure to changing platform economics.
This shift does not mean OTAs are becoming irrelevant, because they still perform a major role in awareness and conversion for many travelers at the top of the funnel. It means that channel strategy in the adventure tourism industry is becoming more balanced, with companies using marketplaces for reach and their own digital assets for retention and repeat purchases. Travel agents also continue to matter, especially on higher-value itineraries, where personalized planning and liability support justify a more consultative sales approach. The most defensible players in the adventure tourism market are likely to be those that can combine marketplace visibility with clear brand identity, a stronger post-booking experience, and a credible direct-booking path that customers are willing to use again.
Geography Analysis
Europe accounted for 31.9% of the adventure tourism market in 2025, making it the largest regional contributor by value. International arrivals in Europe reached 793 million in 2025, up 4% from 2024, and early 2026 data showed a further 5.6% rise, which confirms that the region entered the year with strong travel momentum. ATTA estimated Europe’s outbound adventure opportunity at USD 464 billion, and 73% of travelers across the region’s 6 largest outbound markets were identified as open to adventure, underscoring the depth of the demand base in the adventure tourism market. Europe also benefits from dense transport networks, mature operator infrastructure, and a broad activity mix that ranges from walking and cycling to skiing-adjacent and alpine itineraries. That combination keeps Europe central to the adventure tourism market, both as a source and a destination region.
Asia-Pacific is the fastest-growing regional market for adventure tourism, with a projected CAGR of 10.6% through 2031. ATTA described Asia as the world’s largest adventure market and placed outbound open-to-adventure spending from the region at USD 424 billion, underscoring how large the addressable demand pool has become. International arrivals in the region reached 331 million in 2025, up 6%, and North-East Asia posted the strongest subregional rise at 13%. However, the region remained 9% below 2019 levels, leaving room for further structural recovery. The main implication for the adventure tourism market is that Asia-Pacific combines rising outbound demand with continued inbound normalization, providing operators with room to expand both source-market sales and regional destination supply.
North America remains a major demand center in the adventure tourism market, with ATTA estimating USD 188 billion in adventure-oriented outbound travel from the United States and Canada, where guided hiking, wildlife viewing, and culinary exploration rank among the top preferences. South America is smaller in scale but increasingly formalized, with ATTA placing the region’s open-to-adventure outbound segment at USD 39 billion, and trekking and wildlife routes continuing to anchor destination appeal. The Middle East and Africa show a split profile within the adventure tourism market, with Gulf states investing in purpose-built corridors. At the same time, safari and wildlife demand in sub-Saharan Africa remains strong but more infrastructure-dependent. Africa posted the strongest relative regional increase in 2025 at 8%, and North Africa rose 11%, suggesting that demand can shift quickly toward alternative destinations when travelers reassess geopolitical exposure. Across these regions, the adventure tourism market is becoming less concentrated around a few legacy destinations and more shaped by where access, safety, and product curation improve fastest.

Competitive Landscape
TUI Group, Expedia Group, Intrepid Travel, G Adventures, and REI Adventures all operate under different models, which means scale in this space does not come from a single format. Much of the remaining demand is dispersed across regional specialists and niche operators, so destination knowledge, brand trust, and sustainability positioning often matter as much as balance-sheet size. This structure keeps competitive barriers mixed across the adventure tourism market, because a broad consumer reach helps, but local execution still decides product quality and repeat purchase. It also means that global players and specialist brands often compete on different layers of the customer journey rather than on identical value propositions.
TUI Group’s FY2025 performance shows that larger travel groups are seeking to strengthen their position in the adventure tourism market through both financial scale and digital capabilities. The company reported EUR 24.2 billion in revenue, equal to USD 26.1 billion, and an underlying EBIT of EUR 1.46 billion, equal to USD 1.6 billion, while also highlighting AI-driven efforts to make travel content more discoverable and bookable across its ecosystem. That matters because large integrated players can spread acquisition cost across multiple travel categories and then cross-sell adventure products into a much broader customer base. At the same time, platform and brand boundaries are starting to blur, as shown by GoPro’s May 2026 launch of GoPro Escapes with Dive with Buddy, which moved the company directly into creator-led group travel booking rather than remaining only a hardware brand. Moves like this suggest that the adventure tourism market is attracting adjacent players that already own attention, communities, or strong niche identities.
Private capital is also entering specialized travel formats through targeted expansion rather than broad roll-up activity. In April 2026, Expedition: Earth announced a strategic investment in Iconic Adventures as part of a buy-and-build approach focused on high-end, bespoke experiential travel, underscoring continued interest in premium specialist inventory. The competitive outcome is that the adventure tourism market is likely to keep consolidating selectively around companies that pair direct demand access with destination-specific operating depth. White space remains meaningful in less saturated source markets and in underrepresented language corridors, so fragmentation is unlikely to disappear even as better-funded operators expand.
Adventure Tourism Industry Leaders
TUI Group
Expedia Group
Intrepid Travel
G Adventures
REI Adventures
- *Disclaimer: Major Players sorted in no particular order

Recent Industry Developments
- May 2026: GoPro partnered with Dive with Buddy to launch GoPro Escapes, a curated collection of creator-led group dive travel experiences bookable through the Buddy marketplace platform. The launch positions GoPro directly within the adventure travel distribution chain, extending its brand from hardware into experiential travel.
- April 2026: Expedition: Earth, a Texas-based multi-brand experiential travel operator, announced a strategic investment in Iconic Adventures (Steamboat Springs, CO), its second platform partnership in a buy-and-build strategy targeting high-end bespoke corporate and family adventure travel.
- January 2025: The ATTA released its 2025 Annual Adventure Travel Trends & Insights report, its 18th edition, documenting continued sector growth in 2024 at a moderated pace, with data collected from operators across 6 languages globally. The report identified hiking and trekking as the top activities, and flagged culinary experiences and wellness as the fastest-emerging supplementary activities.


Global Adventure Tourism Market Report Scope
| Soft Adventure |
| Hard Adventure |
| Others |
| Land-Based Activity | Trekking & Hiking |
| Camping | |
| Cycling & Mountain Biking | |
| Wildlife Safaris | |
| Rock Climbing & Mountaineering | |
| Water-Based Activity | Kayaking & Canoeing |
| Rafting | |
| Scuba Diving & Snorkeling | |
| Surfing | |
| Air-Based Activity | Paragliding & Skydiving |
| Hot-Air Ballooning | |
| Bungee Jumping |
| Solo |
| Couples |
| Family |
| Friends/Group |
| Direct Booking |
| Marketplace/OTA Booking |
| Travel Agents & Tour Operators |
| North America | United States |
| Canada | |
| Mexico | |
| South America | Brazil |
| Peru | |
| Chile | |
| Argentina | |
| Rest of South America | |
| Europe | United Kingdom |
| Germany | |
| France | |
| Spain | |
| Italy | |
| BENELUX (Belgium, Netherlands, and Luxembourg) | |
| NORDICS (Denmark, Finland, Iceland, Norway, and Sweden) | |
| Rest of Europe | |
| Asia-Pacific | India |
| China | |
| Japan | |
| Australia | |
| South Korea | |
| South East Asia (Singapore, Malaysia, Thailand, Indonesia, Vietnam, and Philippines) | |
| Rest of Asia-Pacific | |
| Middle East and Africa | United Arab Emirates |
| Saudi Arabia | |
| South Africa | |
| Nigeria | |
| Rest of the Middle East and Africa |
| By Type | Soft Adventure | |
| Hard Adventure | ||
| Others | ||
| By Activity | Land-Based Activity | Trekking & Hiking |
| Camping | ||
| Cycling & Mountain Biking | ||
| Wildlife Safaris | ||
| Rock Climbing & Mountaineering | ||
| Water-Based Activity | Kayaking & Canoeing | |
| Rafting | ||
| Scuba Diving & Snorkeling | ||
| Surfing | ||
| Air-Based Activity | Paragliding & Skydiving | |
| Hot-Air Ballooning | ||
| Bungee Jumping | ||
| By Traveler Type | Solo | |
| Couples | ||
| Family | ||
| Friends/Group | ||
| By Booking Mode | Direct Booking | |
| Marketplace/OTA Booking | ||
| Travel Agents & Tour Operators | ||
| By Geography | North America | United States |
| Canada | ||
| Mexico | ||
| South America | Brazil | |
| Peru | ||
| Chile | ||
| Argentina | ||
| Rest of South America | ||
| Europe | United Kingdom | |
| Germany | ||
| France | ||
| Spain | ||
| Italy | ||
| BENELUX (Belgium, Netherlands, and Luxembourg) | ||
| NORDICS (Denmark, Finland, Iceland, Norway, and Sweden) | ||
| Rest of Europe | ||
| Asia-Pacific | India | |
| China | ||
| Japan | ||
| Australia | ||
| South Korea | ||
| South East Asia (Singapore, Malaysia, Thailand, Indonesia, Vietnam, and Philippines) | ||
| Rest of Asia-Pacific | ||
| Middle East and Africa | United Arab Emirates | |
| Saudi Arabia | ||
| South Africa | ||
| Nigeria | ||
| Rest of the Middle East and Africa | ||


Key Questions Answered in the Report
What is the current size of the adventure tourism space in 2026?
The adventure tourism market is valued at USD 514.5 billion in 2026 and is forecast to reach USD 841.7 billion by 2031, with a 10.3% CAGR.
Which type of adventure travel is the largest today?
Soft adventure is the largest category, with a 63.7% share in 2025, supported by broad appeal across trekking, camping, cycling, and wildlife-linked trips.
Which activity format is growing fastest through 2031?
Air-based activities are projected to grow the fastest at an 11.2% CAGR, even though land-based activities still hold the largest share at 48.9%.
Why is solo travel rising so quickly in this space?
Solo travel is projected to grow at 11.9% CAGR because younger travelers increasingly want flexible, socially designed, experience-rich trips that still offer structure and safety.
Which region leads today, and which one is expanding fastest?
Europe held the largest share at 31.9% in 2025, while Asia-Pacific is forecast to be the fastest-growing region with a 10.6% CAGR through 2031.
What is changing competition among operators and platforms?
The space remains fragmented, with the top 5 players at 40% combined share, and competition is shifting toward direct digital reach, stronger curation, and selective specialist expansion.
Page last updated on:


