Mycorrhiza-Based Biofertilizer Market Size and Share
Market Overview
| Study Period | 2018 - 2031 |
|---|---|
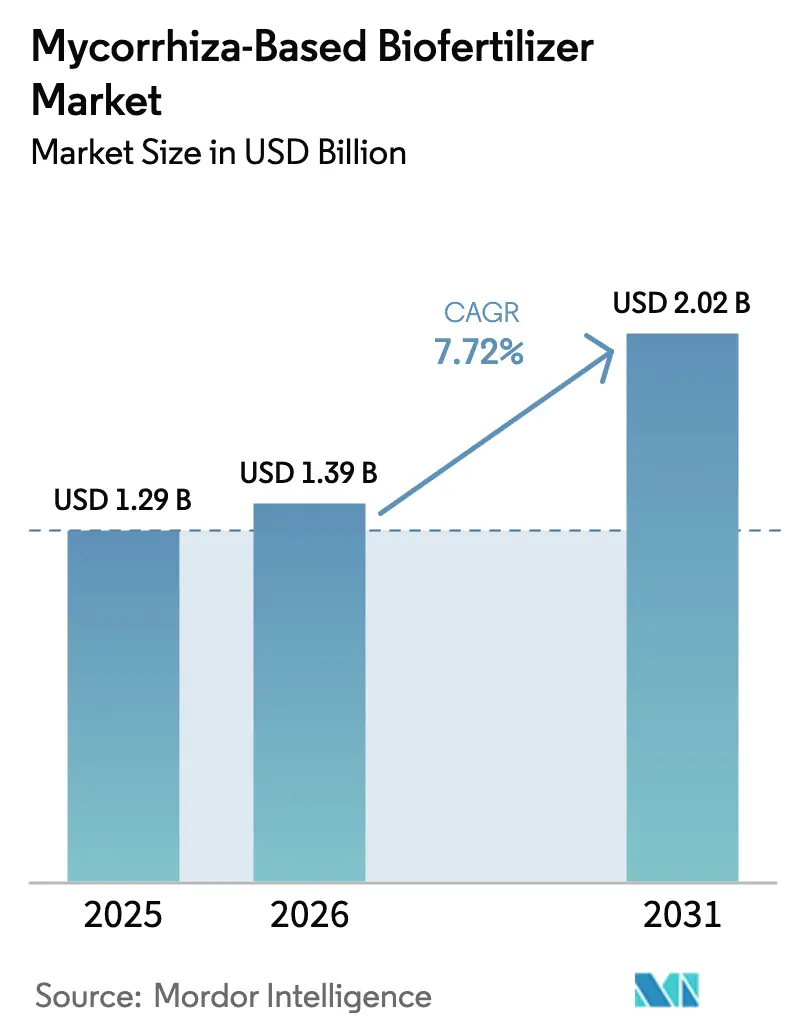
| Market Size (2026) | USD 1.39 Billion |
| Market Size (2031) | USD 2.02 Billion |
| Growth Rate (2026 - 2031) | 7.72% CAGR |
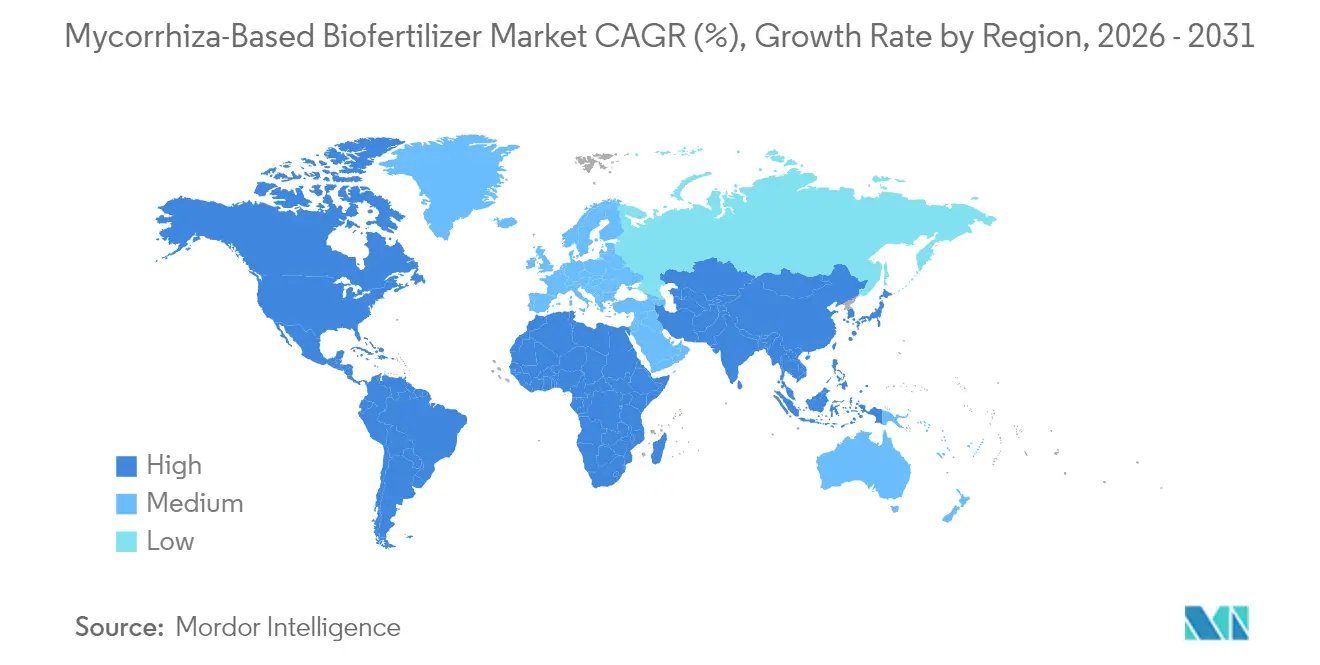
| Fastest Growing Market | North America |
| Largest Market | Europe |
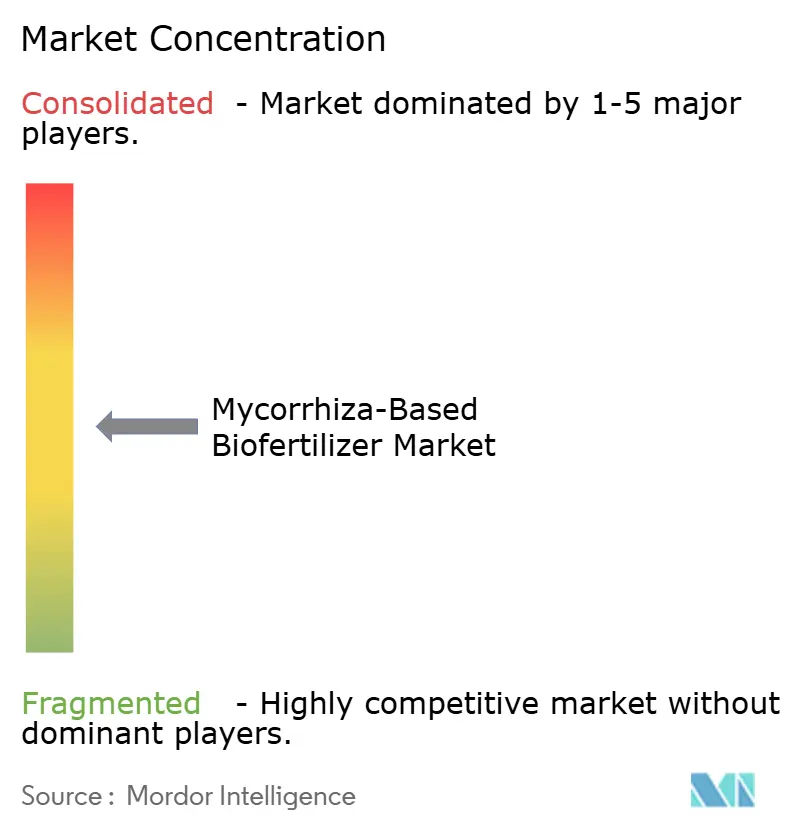
| Market Concentration | Medium |
Major Players *Disclaimer: Major Players sorted in no particular order Image © Mordor Intelligence. Reuse requires attribution under CC BY 4.0. | |
Mycorrhiza-Based Biofertilizer Market Analysis by Mordor Intelligence
The mycorrhiza-based biofertilizer market size was valued at USD 1.29 billion in 2025 and estimated to grow from USD 1.39 billion in 2026 to reach USD 2.02 billion by 2031, at a CAGR of 7.72% during the forecast period (2026-2031). Intensifying pressure to restore soil health, regulatory mandates that curb synthetic fertilizer use, and the tangible yield gains documented in phosphorus-deficient soils are sustaining demand momentum. Major row-crop growers deploy granular or seed-applied formulations to cut phosphorus input costs while maintaining productivity, and greenhouse horticulture operators credit mycorrhizal colonization for premium-grade produce that commands residue-free price premiums. Market leaders are adding encapsulation and seed-coating innovations that lengthen shelf life, facilitate large-acreage coverage, and dovetail with precision agriculture equipment. Investors also cite carbon-credit monetization frameworks, which recognize glomalin-driven soil-carbon sequestration, as a powerful long-term pull for large farming enterprises in Europe and North America. Competitive strategies increasingly revolve around multi-microbe consortia and local strain selection, a combination that addresses field-performance variance while helping suppliers comply with new European Union spore-viability labeling rules.
Key Report Takeaways
- By crop type, row crops held 75.40% of the mycorrhiza-based biofertilizer market share in 2025, while horticultural crops are projected to expand at an 8.27% CAGR through 2031.
- By geography, Europe accounted for 54.85% of the mycorrhiza-based biofertilizer market size in 2025, and North America is advancing at an 8.22% CAGR to 2031.
Note: Market size and forecast figures in this report are generated using Mordor Intelligence’s proprietary estimation framework, updated with the latest available data and insights as of 2026.
Global Mycorrhiza-Based Biofertilizer Market Trends and Insights
Drivers Impact Analysis*
| Driver | (~) % Impact on CAGR Forecast | Geographic Relevance | Impact Timeline |
|---|---|---|---|
| Surge in Organic-Farming Acreage | +2.1% | North America and Europe | Medium term (2–4 years) |
| Regulatory Push to Cut Synthetic Fertilizers | +1.8% | North America and Europe | Long term (≥ 4 years) |
| Proven Yield Uplift in P-Deficient Soils | +1.5% | Global, especially Asia-Pacific, Middle East, and Africa | Short term (≤ 2 years) |
| Rising Demand for Residue-Free Produce | +1.3% | North America and Europe | Medium term (2–4 years) |
| Carbon-Credit Monetization via Soil-C Sequestration | +0.9% | Europe, North America, and Brazil | Long term (≥ 4 years) |
| Precision Seed-Coating Synergies Accelerate Uptake | +0.5% | North America and Europe | Medium term (2–4 years) |
| Source: Mordor Intelligence | |||


Surge in Organic-Farming Acreage
Global certified-organic farmland rose to 76.4 million ha in 2024, a 12.8% increase over 2023 [1]IFOAM, “The World of Organic Agriculture 2025,” ifoam.org. European Union Regulation 2018/848 obliges organic growers to document soil-biodiversity enhancement, effectively positioning mycorrhizal inoculants as a default input. Verified field trials show 8-15% yield lifts in organic cereals under phosphorus-limiting conditions, and the 25-40% price premium fetched by certified produce offsets inoculation costs.
Regulatory Push to Cut Synthetic Fertilizers
The European Union Farm-to-Fork Strategy targets a 20% cut in mineral-fertilizer use by 2030, and the United States Department of Agriculture (USDA) Climate-Smart Commodities program channels cost-share grants toward biological inputs [2]European Commission, “Farm to Fork Strategy Targets,” ec.europa.eu. Similarly, regulatory initiatives are gaining traction in North America. For instance, the United States Department of Agriculture (USDA) National Organic Program recently revised standards for mushroom and pet food production, aligning with broader policy efforts to promote biological inputs. Mycorrhizal fungi, which can meet up to 80% of a plant's phosphorus requirements, offer growers a viable solution to maintain compliance without compromising yields.
Proven Yield Uplift in P-Deficient Soils
Meta-analyses of mycorrhizal field trials indicate that optimal yield responses are achieved at soil phosphorus levels of 15-25 kg P per hectare. These conditions are found in approximately 40% of global cropland, particularly in tropical and semi-arid regions. Recent field studies in phosphorus-deficient soils reveal that mycorrhizal inoculation enhances phosphorus use efficiency by 78% in legumes and 45% in cereals, resulting in yield increases of 15-25% under low-input conditions. The economic impact is especially notable in regions such as sub-Saharan Africa and parts of Asia, where phosphorus fertilizer costs account for 30-40% of total input expenses. This makes biological alternatives economically viable, even at higher price points. Advanced soil testing protocols now facilitate precision application based on mycorrhizal responsiveness indices, enabling farmers to focus inoculation efforts on fields with the highest potential for benefit.
Rising Demand for Residue-Free Produce
Consumer surveys report a 23% annual increase in the willingness to pay premiums for residue-free fruits and vegetables. Studies on greenhouse tomatoes in Spain demonstrated a 90% reduction in Tuta absoluta incidence and a 13% increase in yield following mycorrhizal treatment. This approach enables growers to achieve zero-residue certification standards. Retailers such as Whole Foods and Carrefour now mandate zero-residue certification for premium produce categories, driving market demand and supporting the 15-20% cost premium associated with mycorrhizal inoculants. The resistance mechanism induced by mycorrhiza functions through systemic acquired resistance pathways, offering broad-spectrum protection against fungal pathogens and insect pests without leaving detectable residues.
Restraints Impact Analysis*
| Restraint | (~) % Impact on CAGR Forecast | Geographic Relevance | Impact Timeline |
|---|---|---|---|
| Short Shelf Life and Cold-Chain Needs | -1.2% | Global, acute in tropics | Short term (≤ 2 years) |
| Farmer Awareness Gap and Field-Performance Variance | -0.9% | Asia-Pacific, Middle East, and Africa | Medium term (2–4 years) |
| Invasive-Strain Eco-Risks Spurring Scrutiny | -0.6% | North America and Europe | Long term (≥ 4 years) |
| European Union Spore-Viability Labeling to Lift Compliance Cost | -0.4% | Europe | Medium term (2–4 years) |
| Source: Mordor Intelligence | |||
Short Shelf Life and Cold-Chain Needs
Spore viability drops 15-25% per month at ambient temperatures, and refrigerated distribution raises landed costs by 30-40% [3]MDPI, “Shelf-Life Challenges in Mycorrhizal Products,” mdpi.com. Although alginate-chitosan encapsulation extends shelf life to 18 months, manufacturing costs rise 25-35%, limiting accessibility in price-sensitive regions. Limitations in distribution infrastructure within emerging markets lead to supply chain bottlenecks, as many regions lack sufficient cold storage facilities for biological products. Additionally, the European Food Safety Authority mandates spore viability testing at multiple stages of the product lifecycle, increasing compliance costs. These costs pose a greater challenge for smaller manufacturers that lack dedicated quality control laboratories.
Farmer Awareness Gap and Field-Performance Variance
Roughly 34% of published field studies report negligible yield benefits, eroding grower confidence. Performance depends on native fungal populations, soil pH, and crop genetics, factors that many farmers struggle to diagnose. Extension services in the Asia Pacific, Middle East, and Africa lack biological-input expertise, lengthening the adoption curve. Educational challenges are especially significant in developing regions, where extension services often lack sufficient expertise in biological inputs. This results in suboptimal application practices that diminish effectiveness. Economic analyses suggest that farmers typically need 2-3 successful growing seasons to build confidence in mycorrhizal products, contributing to a prolonged adoption curve and limiting market penetration rates. Additionally, the absence of standardized performance metrics for varying soil types and climatic conditions complicates outcome predictions, prompting cautious adoption even in areas where benefits have been demonstrated.
*Our forecasts treat driver/restraint impacts as directional, not additive. The impact forecasts reflect baseline growth, mix effects, and variable interactions.
Segment Analysis
By Crop Type: Row Crops Anchor Demand, Horticulture Accelerates Upside
Row crops delivered 75.40% of mycorrhiza-based biofertilizer market share in 2025, anchored by corn, soybean, and wheat acreage that values phosphorus-use efficiency and drought resilience. Corn growers documented 8-12% yield gains under phosphorus-limited conditions, while soybean fields benefit from the symbiosis between mycorrhiza and Bradyrhizobium. No-till wheat plots show higher colonization than conventionally tilled soils, underscoring conservation practices that favor fungi persistence. The mycorrhiza-based biofertilizer market size continues to expand as horticultural crops post the fastest 8.27% CAGR, driven by greenhouse peppers, strawberries, and tomatoes, where residue-free certification commands premium pricing and mycorrhizal colonization boosts flavor-linked phytochemical concentrations. Dutch and Spanish greenhouse operators increasingly bundle mycorrhiza with biological pest solutions to meet retailer residue-zero policies.Row-crop suppliers focus on cost-optimized granular carriers and seed-treatment packages that align with precision planters. In greenhouse horticulture, wettable powders and liquid suspensions dominate because they integrate with fertigation systems and allow practitioners to adjust inoculum density in tandem with crop cycles. Cash-crop segments such as cotton and sugarcane expand steadily in Brazil and India, where phosphorus prices remain elevated and mycorrhizal input costs are amortized over multi-season benefits.


Geography Analysis
Europe retained a 54.85% share of the mycorrhiza-based biofertilizer market in 2025, underpinned by organic acreage exceeding 16.9 million ha and stringent fertilizer-reduction mandates. Germany, France, and Italy lead adoption through subsidy programs that reimburse up to 40% of biological-input costs. Eastern European nations increasingly deploy native strains to match continental ecological-risk guidelines.
North America is the fastest-growing region at an 8.22% CAGR, bolstered by robust on-farm trial networks such as GROWMARK MiField that validate economic returns across variable soil mosaics. United States Climate-Smart grant funding reimburses growers for biological-input expenditures, accelerating commercial experimentation. Canadian prairie growers leverage mycorrhizal inoculation to enhance oilseed drought tolerance, a critical trait as climate variability intensifies.
Asia-Pacific adoption gains pace in India, China, and Australia. India’s KRIBHCO-Novonesis alliance tailors formulations to red and lateritic soils, while Australian broad-acre wheat belts exploit fungal networks for moisture conservation.
South American hectares grow steadily, with Brazil’s 83 registered multi-microbe products covering 70 million ha, a testament to regulator openness and producer receptiveness. Middle East and African uptake pivots on arid-land trials that demonstrate water-use efficiency and salinity tolerance benefits.

Competitive Landscape
The mycorrhiza-based biofertilizer market demonstrates moderate concentration, with the top five players accounting for a significant share of the global revenue in 2024. Leading companies employ strategies such as partnerships, mergers, and acquisitions to expand their geographic presence and diversify product portfolios. For example, Novonesis Group, established in 2024 through the merger of Novozymes and Chr. Hansen has scaled inoculant production across four continents. Similarly, Koppert Biological Systems BV extended its market reach through a 2024 partnership with Amoéba to co-promote the AXPERA biofungicide, integrating it with mycorrhizal products to offer comprehensive biological crop care solutions. Other prominent players, such as Premier Tech Ltd and Valent BioSciences LLC, focus on discovering native strains and developing region-specific formulations to meet the growing demand for fungi adapted to local soil conditions.
Innovation in the mycorrhiza-based biofertilizer market is driven by advancements in multi-species consortia, encapsulation technologies, and compatibility with seed-treatment products. Patents filed during 2024–2025 highlight developments in shelf-life extension, spore-release kinetics, and precision delivery systems, which enable synchronization with crop germination and enhance field performance. Competition is intensifying around proprietary strain combinations, advanced delivery mechanisms, and integration with precision agriculture services, resulting in differentiated, high-value offerings.
Emerging players are leveraging localized production capabilities, contract fermentation, and composting hubs to reduce costs while adhering to national soil-biodiversity regulations. Distribution partnerships with major seed companies provide established players with embedded sales channels, reducing customer acquisition costs. The competitive landscape is increasingly shifting toward integrated biological solutions, where mycorrhizal inoculants are bundled with complementary microorganisms and digital agronomy tools to improve crop performance and sustainability outcomes.
Mycorrhiza-Based Biofertilizer Industry Leaders
Koppert Biological Systems BV
Novonesis Group
Atlantica Agricola
Biolchim S.P.A. (J.M. Huber Corporation)
Gujarat State Fertilizers & Chemicals Limited
- *Disclaimer: Major Players sorted in no particular order

Recent Industry Developments
- February 2025: Field trials in Southern Spain demonstrated mycorrhizal inoculation reduced Tuta absoluta pest incidence by 90 percent while increasing tomato yields by 13 percent under commercial greenhouse conditions, validating biological pest control applications for high-value crops
- September 2024: KRIBHCO partnered with Novonesis to commercialize KRIBHCO Rhizosuper mycorrhizal biofertilizer across India, leveraging Novonesis's proprietary LCO Promoter Technology and targeting the expanding Indian biologicals market with region-specific formulations priced at USD 6-7 per acre.
- June 2024: Brazilian research institutions documented the successful deployment of mycorrhizal consortia across 70 million hectares, with 83 multi-microbe products registered nationally, demonstrating large-scale commercial adoption and regulatory acceptance of biological inputs in major agricultural markets.


Global Mycorrhiza-Based Biofertilizer Market Report Scope
| Cash Crops |
| Horticultural Crops |
| Row Crops |
| Africa | By Country | Egypt |
| Nigeria | ||
| South Africa | ||
| Rest of Africa | ||
| Asia-Pacific | By Country | Australia |
| China | ||
| India | ||
| Indonesia | ||
| Japan | ||
| Philippines | ||
| Thailand | ||
| Vietnam | ||
| Rest of Asia-Pacific | ||
| Europe | By Country | France |
| Germany | ||
| Italy | ||
| Netherlands | ||
| Russia | ||
| Spain | ||
| Turkey | ||
| United Kingdom | ||
| Rest of Europe | ||
| Middle East | By Country | Iran |
| Saudi Arabia | ||
| Rest of Middle East | ||
| North America | By Country | Canada |
| Mexico | ||
| United States | ||
| Rest of North America | ||
| South America | By Country | Argentina |
| Brazil | ||
| Rest of South America |
| Crop Type | Cash Crops | ||
| Horticultural Crops | |||
| Row Crops | |||
| Geography | Africa | By Country | Egypt |
| Nigeria | |||
| South Africa | |||
| Rest of Africa | |||
| Asia-Pacific | By Country | Australia | |
| China | |||
| India | |||
| Indonesia | |||
| Japan | |||
| Philippines | |||
| Thailand | |||
| Vietnam | |||
| Rest of Asia-Pacific | |||
| Europe | By Country | France | |
| Germany | |||
| Italy | |||
| Netherlands | |||
| Russia | |||
| Spain | |||
| Turkey | |||
| United Kingdom | |||
| Rest of Europe | |||
| Middle East | By Country | Iran | |
| Saudi Arabia | |||
| Rest of Middle East | |||
| North America | By Country | Canada | |
| Mexico | |||
| United States | |||
| Rest of North America | |||
| South America | By Country | Argentina | |
| Brazil | |||
| Rest of South America | |||


Market Definition
- AVERAGE DOSAGE RATE - The average application rate is the average volume of Mycorrhiza applied per hectare of farmland in the respective region/country.
- CROP TYPE - Crop type includes Row crops (Cereals, Pulses, Oilseeds), Horticultural Crops (Fruits and vegetables) and Cash Crops (Plantation Crops, Fibre Crops and Other Industrial Crops)
- FUNCTION - The crop nutrition function of agricultural biological consists of various products that provide essential plant nutrients and enhance soil quality.
- TYPE - Mycorrhiza is a beneficial fungus that forms a symbiotic relationship with the crops to boost nutrition absorption and enhance soil quality.
| Keyword | Definition |
|---|---|
| Cash Crops | Cash crops are non-consumable crops sold as a whole or part of the crop to manufacture end-products to make a profit. |
| Integrated Pest Management (IPM) | IPM is an environment-friendly and sustainable approach to control pests in various crops. It involves a combination of methods, including biological controls, cultural practices, and selective use of pesticides. |
| Bacterial biocontrol agents | Bacteria used to control pests and diseases in crops. They work by producing toxins harmful to the target pests or competing with them for nutrients and space in the growing environment. Some examples of commonly used bacterial biocontrol agents include Bacillus thuringiensis (Bt), Pseudomonas fluorescens, and Streptomyces spp. |
| Plant Protection Product (PPP) | A plant protection product is a formulation applied to crops to protect from pests, such as weeds, diseases, or insects. They contain one or more active substances with other co-formulants such as solvents, carriers, inert material, wetting agents or adjuvants formulated to give optimum product efficacy. |
| Pathogen | A pathogen is an organism causing disease to its host, with the severity of the disease symptoms. |
| Parasitoids | Parasitoids are insects that lay their eggs on or within the host insect, with their larvae feeding on the host insect. In agriculture, parasitoids can be used as a form of biological pest control, as they help to control pest damage to crops and decrease the need for chemical pesticides. |
| Entomopathogenic Nematodes (EPN) | Entomopathogenic nematodes are parasitic roundworms that infect and kill pests by releasing bacteria from their gut. Entomopathogenic nematodes are a form of biocontrol agents used in agriculture. |
| Vesicular-arbuscular mycorrhiza (VAM) | VAM fungi are mycorrhizal species of fungus. They live in the roots of different higher-order plants. They develop a symbiotic relationship with the plants in the roots of these plants. |
| Fungal biocontrol agents | Fungal biocontrol agents are the beneficial fungi that control plant pests and diseases. They are an alternative to chemical pesticides. They infect and kill the pests or compete with pathogenic fungi for nutrients and space. |
| Biofertilizers | Biofertilizers contain beneficial microorganisms that enhance soil fertility and promote plant growth. |
| Biopesticides | Biopesticides are natural/bio-based compounds used to manage agricultural pests using specific biological effects. |
| Predators | Predators in agriculture are the organisms that feed on pests and help control pest damage to the crops. Some common predator species used in agriculture include ladybugs, lacewings, and predatory mites. |
| Biocontrol agents | Biocontrol agents are living organisms used to control pests and diseases in agriculture. They are alternatives to chemical pesticides and are known for their lesser impact on the environment and human health. |
| Organic Fertilizers | Organic fertilizer is composed of animal or vegetable matter used alone or in combination with one or more non-synthetically derived elements or compounds used for soil fertility and plant growth. |
| Protein hydrolysates (PHs) | Protein hydrolysate-based biostimulants contain free amino acids, oligopeptides, and polypeptides produced by enzymatic or chemical hydrolysis of proteins, primarily from vegetal or animal sources. |
| Biostimulants/Plant Growth Regulators (PGR) | Biostimulants/Plant Growth Regulators (PGR) are substances derived from natural resources to enhance plant growth and health by stimulating plant processes (metabolism). |
| Soil Amendments | Soil Amendments are substances applied to soil that improve soil health, such as soil fertility and soil structure. |
| Seaweed Extract | Seaweed extracts are rich in micro and macronutrients, proteins, polysaccharides, polyphenols, phytohormones, and osmolytes. These substances boost seed germination and crop establishment, total plant growth and productivity. |
| Compounds related to biocontrol and/or promoting growth (CRBPG) | Compounds related to biocontrol or promoting growth (CRBPG) are the ability of a bacteria to produce compounds for phytopathogen biocontrol and plant growth promotion. |
| Symbiotic Nitrogen-Fixing Bacteria | Symbiotic nitrogen-fixing bacteria such as Rhizobium obtain food and shelter from the host, and in return, they help by providing fixed nitrogen to the plants. |
| Nitrogen Fixation | Nitrogen fixation is a chemical process in soil which converts molecular nitrogen into ammonia or related nitrogenous compounds. |
| ARS (Agricultural Research Service) | ARS is the U.S. Department of Agriculture's chief scientific in-house research agency. It aims to find solutions to agricultural problems faced by the farmers in the country. |
| Phytosanitary Regulations | Phytosanitary regulations imposed by the respective government bodies check or prohibit the importation and marketing of certain insects, plant species, or products of these plants to prevent the introduction or spread of new plant pests or pathogens. |
| Ectomycorrhizae (ECM) | Ectomycorrhiza (ECM) is a symbiotic interaction of fungi with the feeder roots of higher plants in which both the plant and the fungi benefit through the association for survival. |


Research Methodology
Mordor Intelligence follows a four-step methodology in all our reports.
- Step-1: Identify Key Variables: In order to build a robust forecasting methodology, the variables and factors identified in Step-1 are tested against available historical market numbers. Through an iterative process, the variables required for market forecast are set and the model is built on the basis of these variables.
- Step-2: Build a Market Model: Market-size estimations for the forecast years are in nominal terms. Inflation is not a part of the pricing, and the average selling price (ASP) is kept constant throughout the forecast period.
- Step-3: Validate and Finalize: In this important step, all market numbers, variables and analyst calls are validated through an extensive network of primary research experts from the market studied. The respondents are selected across levels and functions to generate a holistic picture of the market studied.
- Step-4: Research Outputs: Syndicated Reports, Custom Consulting Assignments, Databases & Subscription Platforms.


