China Biostimulants Market Size and Share
Market Overview
| Study Period | 2021 - 2031 |
|---|---|
| Forecast Data Period | 2026 - 2031 |
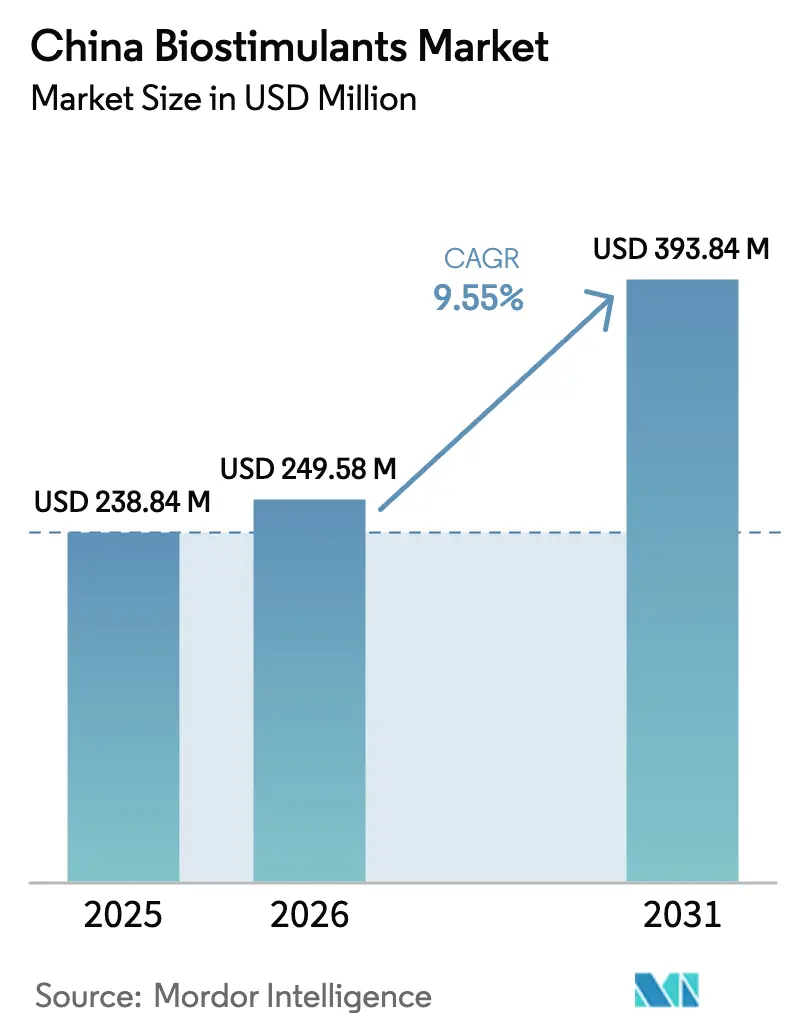
| Base Year Market Size (2025) | USD 238.84 Million |
| Market Size (2026) | USD 249.58 Million |
| Market Size (2031) | USD 393.84 Million |
| Growth Rate (2026 - 2031) | 9.55% CAGR |
| Market Concentration | Low |
Major Players *Disclaimer: Major Players sorted in no particular order Image © Mordor Intelligence. Reuse requires attribution under CC BY 4.0. | |
China Biostimulants Market Analysis by Mordor Intelligence
The China biostimulants market size was estimated at USD 238.84 million in 2025 and is projected to grow from USD 249.58 million in 2026 to reach USD 393.84 million by 2031, at a CAGR of 9.55% during 2026–2031. Seaweed production is expanding along the eastern coast, and protected cultivation is spreading in northern regions. Policies now reward efficient nutrient use instead of simply focusing on higher yields. Farmers in southern areas are dealing with soil acidification, so they are turning to kelp‑based and humic products that improve nutrient uptake. Urban consumers are willing to pay more for produce without chemical residues, which is pushing supply chains to adopt biological inputs. Seaweed extracts are projected to reach cost parity with premium synthetic foliar feeds soon as coastal processors reduce raw-material costs. Competition remains strong since provincial rules allow many small formulators, but upcoming national standards may favor larger companies with ISO‑certified labs.
Key Report Takeaways
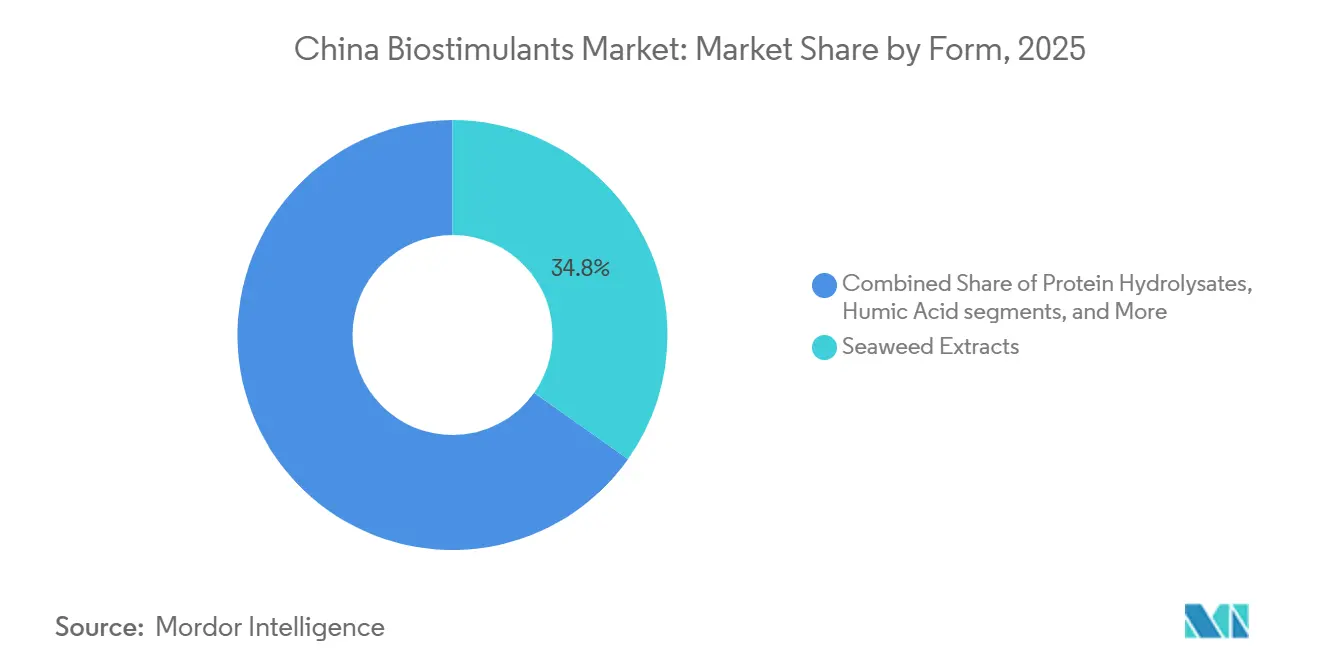
- By form, seaweed extracts led with 34.8% of the China biostimulants market share in 2025 and are projected to grow at a 10.3% CAGR from 2026 to 2031.
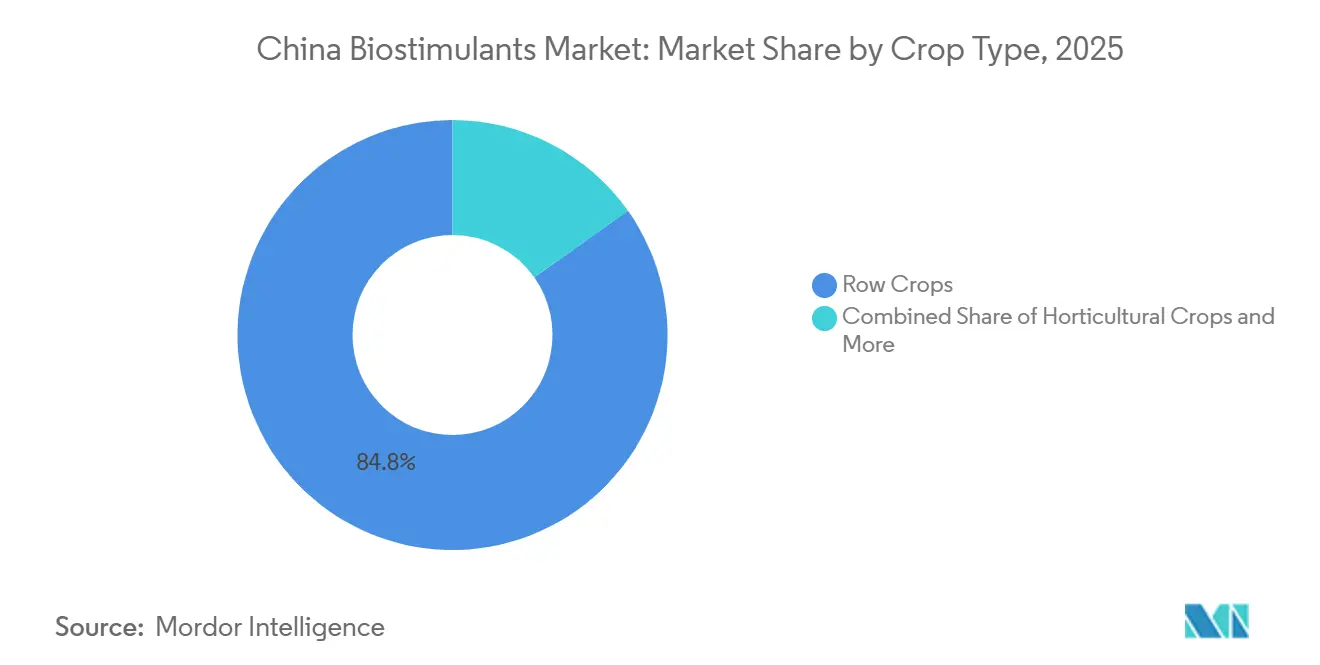
- By crop type, row crops accounted for 84.8% of the China biostimulants market size in 2025, and horticultural crops are growing at a 9.9% CAGR between 2026 to 2031.
Note: Market size and forecast figures in this report are generated using Mordor Intelligence’s proprietary estimation framework, updated with the latest available data and insights as of 2026.
China Biostimulants Market Trends and Insights
Drivers Impact Analysis*
| Driver | (~) % Impact on CAGR Forecast | Geographic Relevance | Impact Timeline |
|---|---|---|---|
| Government incentives for sustainable-input adoption | +1.8% | National, early gains in Jiangsu, Shandong, Zhejiang | Medium term (2–4 years) |
| Rising domestic demand for organic produce | +1.5% | Beijing, Shanghai, Guangzhou, Tier‑2 cities | Long term (≥ 4 years) |
| Soil‑health degradation and fertilizer‑efficiency targets | +2.1% | Hunan, Jiangxi, Guangxi | Short term (≤ 2 years) |
| Expansion of seaweed‑farming capacity | +1.6% | Shandong, Fujian, Liaoning | Medium term (2–4 years) |
| Protected-horticulture boom driving high-value input demand | +1.9% | Hebei, Liaoning, Inner Mongolia | Short term (≤ 2 years) |
| Integration of biostimulants into digital-farming platforms | +1.2% | Nation‑wide grain belts | Long term (≥ 4 years) |
| Source: Mordor Intelligence | |||
Government Incentives for Sustainable-Input Adoption
China’s agricultural policies are reshaping fertilizer use by encouraging growers to adopt sustainable alternatives. The Fertilizer Reduction Action Plan (2022–2025) aims to reduce chemical fertilizer use relative to earlier baselines, while the Organic Fertilizer Expansion Program (2021–2025) promotes the wider use of organic inputs. The Soil Protection & Black Soil Program (2022–2025) focuses on restoring soil quality and improving root‑zone function. Together, these initiatives create strong demand for biostimulants, which enhance nutrient uptake, complement organic fertilizers, and support soil biological activity. Provincial subsidies reward cooperatives that meet acreage thresholds, making adoption more attractive. Seaweed and amino products benefit most because they are recognized under both fertilizer and biostimulant categories, simplifying procurement. Funding has been allocated for green‑input subsidies, though overlapping eligibility with biopesticides has limited direct support.
Rising Domestic Demand for Organic Produce
Urban consumers are increasingly willing to pay premiums for certified organic produce, driving demand for biological inputs. Retailers now require contracted growers to document biostimulant use across large areas of vegetable production, embedding sustainability into supply chains. Organic farmland has expanded, but only a portion currently applies biostimulants, leaving a large opportunity for growth. Export‑oriented berry producers have adopted kelp extracts to meet stricter residue limits in overseas markets, protecting access to valuable export channels. Smaller farms often struggle to meet requirements, slowing penetration. Despite these challenges, rising consumer expectations and retailer mandates are creating strong momentum for biostimulant adoption, positioning organic demand as a powerful driver of long‑term market growth.
Soil-Health Degradation and Fertilizer-Use-Efficiency Targets
Soil acidification has become a major challenge in southern provinces, reducing the effectiveness of conventional fertilizers and lowering yields. Humic and fulvic acids are increasingly used to buffer acidity and improve nutrient uptake, delivering measurable yield improvements in trials. National programs mandate soil testing across millions of hectares, with sites showing low organic matter receiving automated biological recommendations. Fertilizer‑use efficiency targets are pushing agronomists to prescribe biostimulants that enhance nitrogen uptake and reduce reliance on urea without yield loss. Phosphorus runoff limits along major rivers are also creating space for seaweed‑based blends, which provide more sustainable nutrient management. Together, these measures are driving rapid adoption of biostimulants as farmers seek to meet efficiency targets while protecting soil health.
Expansion of Seaweed-Farming Capacity
China remains the largest harvester of macro‑algae, and coastal acreage continues to expand with support from subsidies for offshore systems. Integrated sites process kelp at high extraction yields, lowering raw‑material costs and making domestic products more competitive than imports. Foreign suppliers have responded by relocating processing facilities to coastal provinces to remain competitive. In 2025, Shandong Province built 139 marine farms (incl. 71 national-level) with integrated infrastructure for aquaculture expansion. These national-level marine ranches reflect state and provincial support for diversified marine farming infrastructure, enabling expanded sea-farming areas potentially suitable for seaweed integration and biomass growth. National policy also emphasized deep‑sea aquaculture, directing resources toward facility construction, technology deployment, and the establishment of pilot zones.
Restraints Impact Analysis*
| Restraint | (~) % Impact on CAGR Forecast | Geographic Relevance | Impact Timeline |
|---|---|---|---|
| High price premium versus conventional fertilizers | -1.4% | Nation‑wide, most acute in row‑crop belts | Short term (≤ 2 years) |
| Lack of harmonized efficacy standards and regulations | -0.9% | National with provincial disparity | Medium term (2–4 years) |
| Seasonal volatility in raw-material supply | -0.7% | Shandong, Fujian, Liaoning | Short term (≤ 2 years) |
| Channel destocking and tighter ag-input credit cycles | -1.1% | Grain‑belt distributors | Short term (≤ 2 years) |
| Source: Mordor Intelligence | |||
High Price Premium Versus Conventional Fertilizers
Seaweed extracts remain more expensive than conventional sprays, creating a premium that stretches payback periods for growers. Farmers devote only a small share of input budgets to non‑NPK products, limiting experimentation and slowing adoption. Distributors add significant mark‑ups through multi‑tier networks, while direct online sales face delivery challenges in remote areas. Grain subsidies have not kept pace with rising costs, forcing growers to trim discretionary spending and prioritize cheaper inputs. Without further price convergence, adoption among smallholders will remain muted, especially in regions where farm sizes are limited and margins are thin. Larger estates may continue to experiment with biostimulants, but widespread uptake will depend on narrowing the cost gap with conventional fertilizers. Price remains one of the most immediate restraints on growth, particularly in staple crop regions where affordability drives decisions.
Lack of Harmonized Efficacy Standards and Regulations
Biostimulants are still regulated under general fertilizer codes, leaving efficacy claims to voluntary disclosure. Different provinces impose varying trial requirements, creating delays for nationwide rollouts and complicating product launches. Counterfeit products dilute genuine extracts with synthetic additives, eroding grower trust and undermining brand credibility. Only a minority of domestic producers hold recognized certification, limiting confidence in product performance. Premium brands that invest in long‑term trials struggle to differentiate in price‑sensitive regions where inspection resources are scarce. The lack of harmonized standards creates uncertainty for both producers and farmers, slowing adoption and discouraging investment. Establishing clear national guidelines would help level the playing field, reduce counterfeit risks, and accelerate market penetration.
*Our forecasts treat driver/restraint impacts as directional, not additive. The impact forecasts reflect baseline growth, mix effects, and variable interactions.
Segment Analysis
By Form: Seaweed Extracts Lead Premium Positioning
Seaweed extracts captured 34.8% of 2025 revenue, making them the largest segment by form, and are projected to expand at a 10.3% CAGR during the forecast period (2026–2031), growing faster than the overall China biostimulants market size. Domestic producers benefit from vertical integration, which lowers costs and makes their products more competitive than imports. Greenhouse vegetable growers report yield improvements that help offset higher costs compared to conventional sprays. Humic acid holds the second position but grows more slowly due to supply limits. Amino and protein hydrolysates are gaining traction in high‑value crops where synthetic nitrogen is restricted, while fulvic acid remains a niche option in cotton and alkaline soils.
Future growth for seaweed extracts depends on resilience against weather shocks and investment in cold‑chain infrastructure. Typhoons have exposed supply risks, raising raw material costs and disrupting harvests. If coastal processors complete planned cold‑storage upgrades, inventory buffers will help stabilize supply and reduce volatility. Regulatory clarity under a proposed standalone biostimulant code could also shorten approval timelines, making it easier for new products to reach the market. These improvements would strengthen seaweed extracts’ leadership in the China biostimulants market share and accelerate overall expansion.


By Crop Type: Row Crops Dominate Volume
Row crops commanded 84.8% of 2025 revenue, making them the largest segment by crop type, reflecting their importance in food security and the scale of grain cultivation. Farmers in these regions remain cautious about adopting biostimulants because of cost sensitivity and limited subsidies. Input budgets are still heavily weighted toward conventional fertilizers, leaving little room for experimentation. Government programs promoting fertilizer efficiency are gradually encouraging the use of biological inputs to maintain yields under stricter nutrient‑use targets. Adoption is projected to rise slowly as awareness spreads through extension services and digital advisory platforms. Over time, these efforts will support growth in the China biostimulants market size, though row crops will continue to dominate the overall share.
Horticultural crops are forecasted to grow at a 9.9% CAGR during the forecast period (2026–2031), making them the fastest‑expanding segment. Protected cultivation has expanded steadily, supporting higher input spending per hectare and rewarding biologicals that improve shelf life for long‑distance transport. Export‑oriented berry producers in China have increasingly adopted kelp extract‑based biostimulants to comply with stricter residue standards in overseas markets, illustrating how international trade regulations directly influence local technology adoption. Digital platforms are embedding recommendations for kelp and amino products into fertigation systems, helping farmers reduce wastage and improve efficiency. Urban demand for organic produce and retailer mandates are creating strong momentum, positioning horticulture as a key driver of future China biostimulants market share growth.
Geography Analysis
Eastern coastal provinces account for the largest portion of the China biostimulants market share, supported by strong kelp industries and integrated greenhouse hubs. Subsidies in provinces such as Jiangsu and Zhejiang encourage cooperative adoption, while southern regions are experiencing rapid growth as producers increasingly turn to biostimulants to address soil acidification and enhance long‑term productivity. Humic‑fulvic blends are widely recommended in local agronomy handbooks, helping farmers buffer acidic soils and improve nutrient uptake. These regions combine favorable policy support with natural conditions that make biostimulants essential, positioning them as central drivers of the overall China biostimulants market size.
Northern provinces are adding solar‑heated greenhouses, and vegetable growers are increasingly adopting kelp‑amino fertigation systems to improve efficiency. This has boosted adoption in horticulture, though grain regions in the northeast remain slower to embrace biostimulants. Government programs promoting fertilizer efficiency and digital advisory platforms are projected to gradually raise awareness, supporting broader growth in the market size.
Western provinces remain niche markets, where fulvic acids are suited to cotton grown in alkaline soils. The Yangtze River Economic Belt is emerging as a policy testing ground, with stricter nutrient regulations opening opportunities for seaweed‑based blends. Urban clusters also drive demand, as retailers mandate biological protocols in contracted produce supply chains. These regions add diversity to the China biostimulants market share and play a role in expanding the overall China biostimulants market size.
Competitive Landscape
The China biostimulants market share remains fragmented, with many regional players competing under different provincial rules. Entry barriers are low, which allows a wide range of companies to operate. Syngenta Group leads after expanding kelp‑extract production and pairing its products with digital agronomy hubs that deliver plot‑level prescriptions. Qingdao Seawin follows closely, supported by vertically integrated seaweed processing that secures cost advantages over imports. Novonesis, Chengdu Newsun, and Leili Marine also hold meaningful positions, offering enzyme and amino solutions tuned to digital dosing systems and organic certification pathways. Together, these companies highlight the diversity of strategies shaping the competitive field of the market.
Vertical integration and platform distribution are the two dominant strategies shaping competition. Processors are investing in cold‑storage capacity to smooth weather‑driven price spikes, while digital entrants leverage mobile apps used by millions of smallholders to push subscription‑based biological bundles. Patent activity shows rising emphasis on multi‑functional products, with kelp‑humic complexes designed to improve stress tolerance. Global incumbents are acquiring local firms to accelerate market entry and strengthen portfolios. These moves highlight how innovation and consolidation are reshaping the China biostimulants market share, while digital distribution channels expand access and support adoption across diverse farming systems.
National standards under consultation could reshape the competitive landscape by mandating ISO‑aligned efficacy data, a requirement that only a fraction of domestic producers can currently meet. This shift may favor larger companies with established laboratories and international partnerships. At the same time, e‑commerce platforms are experimenting with grower financing and direct‑to‑farm delivery, offering new ways to reach smallholders despite rural logistics challenges. These developments point toward a more structured and technology‑driven market environment. As policies, infrastructure, and digital tools converge, the China biostimulants market size is projected to expand steadily, with leading firms positioned to capture greater influence in the evolving ecosystem.
China Biostimulants Industry Leaders
Syngenta Group
Qingdao Seawin Biotech Group Co., Ltd.
Novonesis
Chengdu Newsun Crop Science Co., Ltd.
Leili Marine Bioindustry Inc.
- *Disclaimer: Major Players sorted in no particular order


Recent Industry Developments
- July 2025: Novonesis expanded a new administration building in Tianjin’s TEDA, strengthening its local R&D and operational base, enabling the company to accelerate development of biostimulant solutions tailored to China’s agriculture. By integrating office, exhibition, and conference functions, the facility enhances collaboration and commercialization of biological inputs such as kelp extracts and microbial formulations, supporting sustainable productivity.
- July 2024: Chengdu NewSun Crop Science Co., Ltd. has created an Integrated Biostimulant Technology platform that incorporates multiple essential biostimulant mechanisms into a comprehensive crop enhancement solution. This platform is designed to tackle complex abiotic stresses while improving both crop yield and quality.
- June 2024: Chengdu NewSun Crop Science Co., Ltd. has inaugurated an integrated biological–chemical crop protection innovation in collaboration with Syngenta Group China. This initiative integrates biostimulants, bioregulators, biopesticides, and soil conditioners with conventional chemistries to develop more effective and sustainable crop protection systems. The approach aims to improve efficacy, promote green agriculture, and accelerate the adoption of integrated crop management solutions.


China Biostimulants Market Report Scope
A biostimulant is generally defined as a substance or microorganism applied to seeds, plants, or soil that stimulates natural processes to enhance nutrient uptake, nutrient use efficiency, tolerance to abiotic stress, or crop quality and yield.
The China biostimulants market report is segmented by form (amino acids, fulvic acid, humic acid, protein hydrolysates, seaweed extracts, and other biostimulants) and by crop type (horticultural crops, row crops, and cash crops). The market forecasts are provided in terms of value (USD) and volume (metric tons).
| Amino Acids |
| Fulvic Acid |
| Humic Acid |
| Protein Hydrolysates |
| Seaweed Extracts |
| Other Biostimulants |
| Cash Crops |
| Horticultural Crops |
| Row Crops |
| By Form | Amino Acids |
| Fulvic Acid | |
| Humic Acid | |
| Protein Hydrolysates | |
| Seaweed Extracts | |
| Other Biostimulants | |
| By Crop Type | Cash Crops |
| Horticultural Crops | |
| Row Crops |


Market Definition
- AVERAGE DOSAGE RATE - The average application rate is the average volume of biostimulants applied per hectare of farmland in the respective region/country.
- CROP TYPE - Crop type includes Row crops (Cereals, Pulses, Oilseeds), Horticultural Crops (Fruits and vegetables) and Cash Crops (Plantation Crops, Fibre Crops and Other Industrial Crops)
- FUNCTION - The Crop Protection function of agirucultural biological include products that prevent or control various biotic and abiotic stress.
- TYPE - Biostimulants boost crop growth and yield by preventing or controlling various abiotic stresses.
| Keyword | Definition |
|---|---|
| Cash Crops | Cash crops are non-consumable crops sold as a whole or part of the crop to manufacture end-products to make a profit. |
| Integrated Pest Management (IPM) | IPM is an environment-friendly and sustainable approach to control pests in various crops. It involves a combination of methods, including biological controls, cultural practices, and selective use of pesticides. |
| Bacterial biocontrol agents | Bacteria used to control pests and diseases in crops. They work by producing toxins harmful to the target pests or competing with them for nutrients and space in the growing environment. Some examples of commonly used bacterial biocontrol agents include Bacillus thuringiensis (Bt), Pseudomonas fluorescens, and Streptomyces spp. |
| Plant Protection Product (PPP) | A plant protection product is a formulation applied to crops to protect from pests, such as weeds, diseases, or insects. They contain one or more active substances with other co-formulants such as solvents, carriers, inert material, wetting agents or adjuvants formulated to give optimum product efficacy. |
| Pathogen | A pathogen is an organism causing disease to its host, with the severity of the disease symptoms. |
| Parasitoids | Parasitoids are insects that lay their eggs on or within the host insect, with their larvae feeding on the host insect. In agriculture, parasitoids can be used as a form of biological pest control, as they help to control pest damage to crops and decrease the need for chemical pesticides. |
| Entomopathogenic Nematodes (EPN) | Entomopathogenic nematodes are parasitic roundworms that infect and kill pests by releasing bacteria from their gut. Entomopathogenic nematodes are a form of biocontrol agents used in agriculture. |
| Vesicular-arbuscular mycorrhiza (VAM) | VAM fungi are mycorrhizal species of fungus. They live in the roots of different higher-order plants. They develop a symbiotic relationship with the plants in the roots of these plants. |
| Fungal biocontrol agents | Fungal biocontrol agents are the beneficial fungi that control plant pests and diseases. They are an alternative to chemical pesticides. They infect and kill the pests or compete with pathogenic fungi for nutrients and space. |
| Biofertilizers | Biofertilizers contain beneficial microorganisms that enhance soil fertility and promote plant growth. |
| Biopesticides | Biopesticides are natural/bio-based compounds used to manage agricultural pests using specific biological effects. |
| Predators | Predators in agriculture are the organisms that feed on pests and help control pest damage to the crops. Some common predator species used in agriculture include ladybugs, lacewings, and predatory mites. |
| Biocontrol agents | Biocontrol agents are living organisms used to control pests and diseases in agriculture. They are alternatives to chemical pesticides and are known for their lesser impact on the environment and human health. |
| Organic Fertilizers | Organic fertilizer is composed of animal or vegetable matter used alone or in combination with one or more non-synthetically derived elements or compounds used for soil fertility and plant growth. |
| Protein hydrolysates (PHs) | Protein hydrolysate-based biostimulants contain free amino acids, oligopeptides, and polypeptides produced by enzymatic or chemical hydrolysis of proteins, primarily from vegetal or animal sources. |
| Biostimulants/Plant Growth Regulators (PGR) | Biostimulants/Plant Growth Regulators (PGR) are substances derived from natural resources to enhance plant growth and health by stimulating plant processes (metabolism). |
| Soil Amendments | Soil Amendments are substances applied to soil that improve soil health, such as soil fertility and soil structure. |
| Seaweed Extract | Seaweed extracts are rich in micro and macronutrients, proteins, polysaccharides, polyphenols, phytohormones, and osmolytes. These substances boost seed germination and crop establishment, total plant growth and productivity. |
| Compounds related to biocontrol and/or promoting growth (CRBPG) | Compounds related to biocontrol or promoting growth (CRBPG) are the ability of a bacteria to produce compounds for phytopathogen biocontrol and plant growth promotion. |
| Symbiotic Nitrogen-Fixing Bacteria | Symbiotic nitrogen-fixing bacteria such as Rhizobium obtain food and shelter from the host, and in return, they help by providing fixed nitrogen to the plants. |
| Nitrogen Fixation | Nitrogen fixation is a chemical process in soil which converts molecular nitrogen into ammonia or related nitrogenous compounds. |
| ARS (Agricultural Research Service) | ARS is the U.S. Department of Agriculture's chief scientific in-house research agency. It aims to find solutions to agricultural problems faced by the farmers in the country. |
| Phytosanitary Regulations | Phytosanitary regulations imposed by the respective government bodies check or prohibit the importation and marketing of certain insects, plant species, or products of these plants to prevent the introduction or spread of new plant pests or pathogens. |
| Ectomycorrhizae (ECM) | Ectomycorrhiza (ECM) is a symbiotic interaction of fungi with the feeder roots of higher plants in which both the plant and the fungi benefit through the association for survival. |


Research Methodology
Mordor Intelligence follows a four-step methodology in all our reports.
- Step-1: Identify Key Variables: In order to build a robust forecasting methodology, the variables and factors identified in Step-1 are tested against available historical market numbers. Through an iterative process, the variables required for market forecast are set and the model is built on the basis of these variables.
- Step-2: Build a Market Model: Market-size estimations for the forecast years are in nominal terms. Inflation is not a part of the pricing, and the average selling price (ASP) is kept constant throughout the forecast period.
- Step-3: Validate and Finalize: In this important step, all market numbers, variables and analyst calls are validated through an extensive network of primary research experts from the market studied. The respondents are selected across levels and functions to generate a holistic picture of the market studied.
- Step-4: Research Outputs: Syndicated Reports, Custom Consulting Assignments, Databases & Subscription Platforms.


