United States Biocontrol Agents Market Size and Share
Market Overview
| Study Period | 2021 - 2031 |
|---|---|
| Forecast Data Period | 2026 - 2031 |
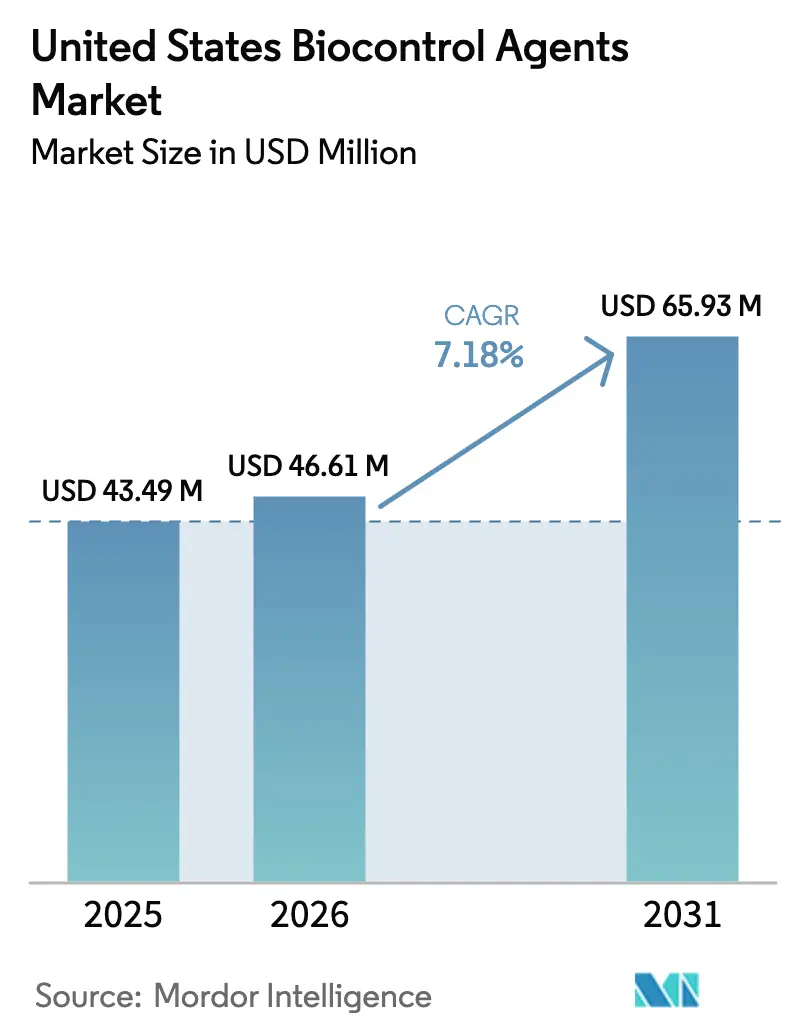
| Base Year Market Size (2025) | USD 43.49 Million |
| Market Size (2026) | USD 46.61 Million |
| Market Size (2031) | USD 65.93 Million |
| Growth Rate (2026 - 2031) | 7.18% CAGR |
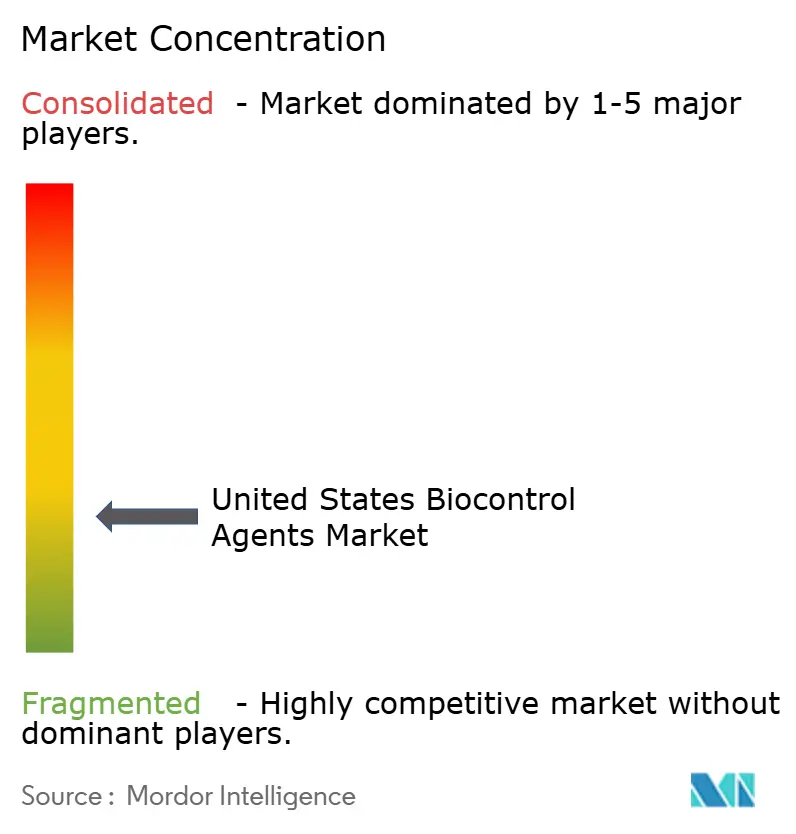
| Market Concentration | Low |
Major Players*Disclaimer: Major Players sorted in no particular order Image © Mordor Intelligence. Reuse requires attribution under CC BY 4.0. | |
United States Biocontrol Agents Market Analysis by Mordor Intelligence
The United States biocontrol agents market size was valued at USD 43.49 million in 2025 and estimated to grow from USD 46.61 million in 2026 to reach USD 65.93 million by 2031, at a CAGR of 7.18% during the forecast period (2026-2031). Stricter Environmental Protection Agency (EPA) rules on synthetic pesticides, premium demand for residue-free produce, and a 12% annual expansion of controlled-environment acreage through 2024 are the strongest current growth catalysts[1]Source: USDA Economic Research Service, “Greenhouse and Nursery Production,” ers.usda.gov . The intensified adoption of Integrated Pest Management (IPM), technology-driven release methods, and retail sustainability mandates reinforce volume gains, while fragmented competition sustains price pressure. Consolidation interest is rising because the top five suppliers jointly hold only a prominent share, yet small specialists still drive rapid strain innovation and custom formulations[2]Source: EPA Office of Pesticide Programs, “Registration Review Process,” epa.gov. Additionally, patent filings for microbial strain engineering have shown significant growth in 2024, signaling strong private research and development momentum. Investors are also scaling up production capacity, as demonstrated by Koppert Biological Systems B.V.'s expansion in Michigan, which aims to increase output for greenhouse growers.
Key Report Takeaways
- By form, microbials led the United States biocontrol agents market share at 88.95% in 2025 and are projected to grow at a 7.55% CAGR through 2031.
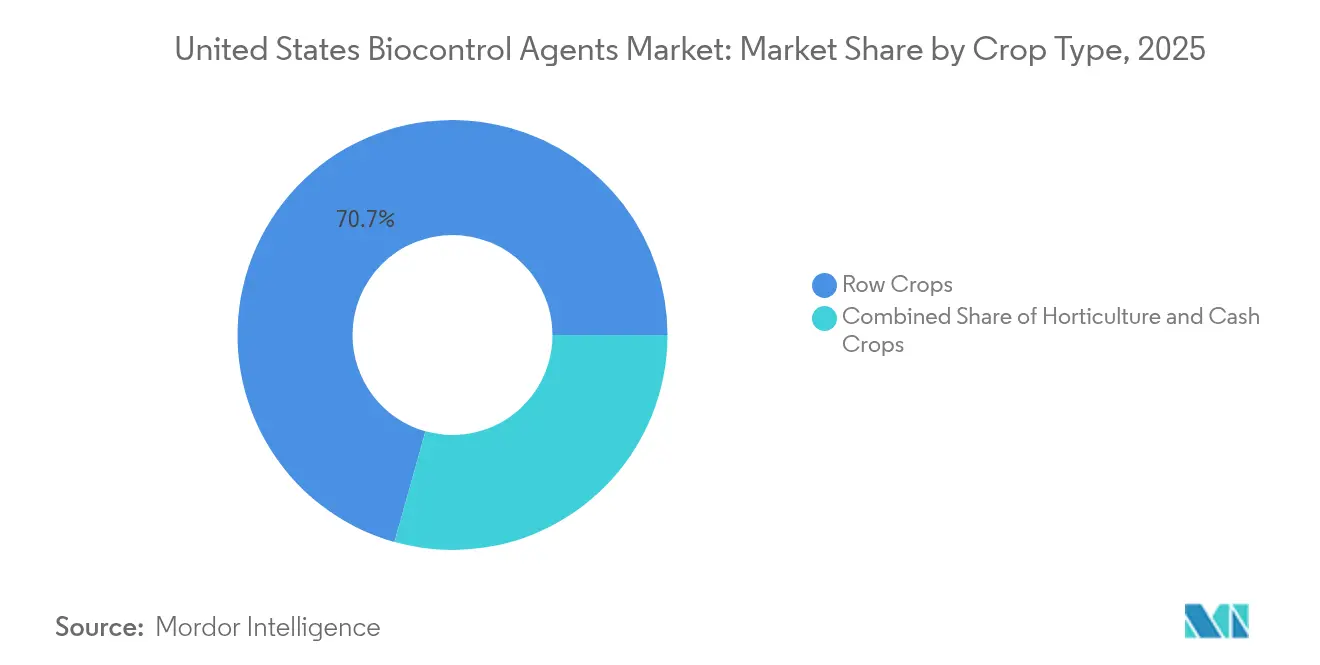
- By crop type, row crops accounted for 70.65% of the United States biocontrol agents market size in 2025 and are anticipated to grow at a 7.32% CAGR through 2031.
Note: Market size and forecast figures in this report are generated using Mordor Intelligence’s proprietary estimation framework, updated with the latest available data and insights as of 2026.
United States Biocontrol Agents Market Trends and Insights
Drivers Impact Analysis*
| Driver | (~) % Impact on CAGR Forecast | Geographic Relevance | Impact Timeline |
|---|---|---|---|
| Rising demand for residue-free produce from retail chains | +1.8% | California, Florida, and Texas | Medium term (2–4 years) |
| Stricter Environmental Protection Agency (EPA) regulations limiting chemical pesticides | +1.5% | National, regulated watersheds | Short term (≤ 2 years) |
| Growth in the United States' organic farming acreage | +1.2% | Pacific Northwest, and Northeast | Long term (≥ 4 years) |
| Integration of biocontrol in large-scale Integrated Pest Management (IPM) programs | +0.9% | Midwest, and California | Medium term (2–4 years) |
| Surge in controlled-environment agriculture acreage | +0.8% | Arizona, and California | Short term (≤ 2 years) |
| Drone-enabled release technologies are lowering labor costs | +0.6% | California, Texas, and Florida | Long term (≥ 4 years) |
| Source: Mordor Intelligence | |||
Rising Demand for Residue-Free Produce from Retail Chains
Leading supermarkets have made pesticide-free verification a contractual requirement, and this shift is rewriting procurement strategies for thousands of growers. Walmart’s 2024 supplier update links shelf space allocation to third-party residue testing, while Whole Foods now weighs biocontrol adoption in its “Responsibly Grown”. These mandates let growers command 30–40% premiums that more than offset the higher per-acre cost of biological inputs. Because price signals are clear and stable, mid-size farms that once hesitated on cost grounds are moving rapidly into the United States biocontrol agents market. Retail audits also boost brand storytelling since zero-residue claims resonate with health-conscious consumers who trust independently verified data. The combined commercial and reputational gains position retail pull as the strongest immediate catalyst for nationwide adoption.
Stricter Environmental Protection Agency (EPA) Regulations Limiting Chemical Pesticides
In 2024, the Environmental Protection Agency (EPA) curtailed or restricted the use of 23 synthetic active ingredients, significantly narrowing the chemical options available to specialty crop growers. Registration reviews now require more in-depth endangered-species consultations, which can extend approval timelines by up to two years, leaving a protection gap that biological agents can potentially fill. Growers in regulated watersheds respond quickly because non-compliance triggers fines and crop rejections by processors. California halves registration fees for biocontrol agents and expedites reviews that meet pollinator-safety standards. Suppliers, therefore, fast-track microbial and macro-bial dossiers, confident that lighter regulatory burdens shorten time to market. Over the next two seasons, field advisors anticipate a surge in label conversions from provisional to full registration as data packages mature.
Growth in United States Organic Farming Acreage
Certified organic farmland reached 5.6 million acres in 2024 after posting 8.2% yearly expansion, and each new acre implies mandatory biological pest management[3]Source: USDA National Organic Program, “About AMS Programs and Offices,” ams.usda.gov. Organic growers must demonstrate three consecutive seasons free from synthetic residues before harvest, so biocontrol volume climbs early in the transition stage. USDA awarded USD 25 million in research grants in 2024 to improve the field consistency of microbes and beneficial insects, lowering risk for first-time users. Organic cooperatives in Vermont, Oregon, and Wisconsin share cost-effective cold-chain routes that cut delivery prices by 18% relative to single-farm orders. As extension agents document yield parity with chemical programs, neighboring conventional farms gain confidence and trial biological solutions in buffer zones. The sustained acreage growth ensures a long horizon of structural demand rather than a temporary spike.
Integration of Biocontrol in Large-Scale Integrated Pest Management (IPM) Programs
University surveys indicate that 67% of commercial producers now incorporate biological agents into formal Integrated Pest Management (IPM) protocols, compared with 34% in 2020. Scale matters because operations exceeding 1,000 acres reduce per-unit costs by pooling scouting, application, and data analytics. Dealers offer bundled packages that include resistance-rotation schedules, remote diagnostics, and season-long resupply guarantees. Large farms report that predictable weekly shipments avoid emergency pesticide runs and allow smoother labor planning. Consultants also translate academic trial data into simple decision trees that farm managers can follow without entomology expertise. Together, these services de-risk performance variability and normalize biological inputs as routine line items rather than experimental add-ons.
Restraints Impact Analysis*
| Restraint | (~) % Impact on CAGR Forecast | Geographic Relevance | Impact Timeline |
|---|---|---|---|
| Limited shelf life and cold-chain requirements | −1.1% | Rural distribution networks | Short term (≤ 2 years) |
| High registration costs and timelines under Federal Insecticide, Fungicide, and Rodenticide Act (FIFRA) | −0.7% | National | Medium term (2–4 years) |
| Variable field performance across climates | −0.5% | Arid Southwest | Long term (≥ 4 years) |
| Resistance-management guidelines limiting repeat use | −0.4% | Intensive production regions | Medium term (2–4 years) |
| Source: Mordor Intelligence | |||
Limited Shelf Life and Cold-Chain Requirements
Most microbial formulations remain viable for only two to six weeks in refrigeration, while live macro-bials deteriorate faster if humidity fluctuates[4]Source: Cold Chain Federation, “Industry Resources,” coldchainfederation.org. Deliveries to rural counties often involve third-party carriers that lack temperature-controlled trailers, causing 8–12% loss rates that erode distributor margins. Cold storage also competes with pharmaceuticals and dairy for warehouse space during summer peaks, driving surcharges of USD 0.15–0.25 per unit. Suppliers counter with phase-change gel packs and breathable liners, but these add material cost and weight penalties that lift freight charges. Recent packaging innovations from Arizona Biological Control doubled some parasitoid shelf lives to four weeks, yet many growers still schedule just-in-time shipments that complicate inventory planning. Until universal cold-chain coverage improves, this logistical fragility will temper volume expansion in remote production belts.
High Registration Costs and Timelines Under Federal Insecticide, Fungicide, and Rodenticide Act (FIFRA)
A new biological active ingredient can cost USD 1.2–2.8 million to shepherd through toxicology, ecotoxicology, and efficacy studies, even on the Environmental Protection Agency's (EPA) streamlined lane. Cash-constrained startups often license strains to larger firms rather than self-register, which consolidates intellectual property in fewer hands and slows the creation of variety. State authorities impose additional data requirements on top of federal dossiers, and these regional duplications extend timelines to as long as five years. Opportunity costs rise when promising microbes must idle in pilot trials while paperwork moves through sequential reviews. Investors, therefore, encourage companies to develop broad-spectrum products that promise larger markets, leaving highly targeted niche solutions underfunded. Although Environmental Protection Agency (EPA) fees are partly offset for small businesses, indirect costs such as protocol design and lab outsourcing remain formidable.
*Our forecasts treat driver/restraint impacts as directional, not additive. The impact forecasts reflect baseline growth, mix effects, and variable interactions.
Segment Analysis
By Form: Microbials Lead Through Application Versatility
Microbials commanded 88.95% of the United States biocontrol agents market size in 2025, owing to their seamless fit with existing spray systems and longer shelf stability compared to live insects. The segment is projected to reach a 7.55% CAGR through 2031 as encapsulation boosts UV tolerance and moisture retention. Macrobials excel in greenhouse niches that reward high establishment rates despite shipping constraints. Competitive focus is shifting toward microbial consortia that broaden target spectrums and extend field persistence, which fuels incremental price premiums.
Demand from outdoor row crops now drives bulk volume for microbials while high-margin greenhouse growers remain the prime market for macrobials. Strain-level differentiation, intellectual property protection, and formulation patents protect margin sustainability in the United States biocontrol agents market even as consolidation moves forward.


By Crop Type: Row Crops Drive Volume While Specialty Crops Command Premiums
Row crops accounted for 70.65% of the United States biocontrol agents market share in 2025, as corn, soybean, and wheat growers incorporated cost-effective microbes into expansive Integrated Pest Management (IPM) rotations. The segment is forecast to grow at a 7.32% annual rate through 2031, supported by drone release systems that help curb labor costs. Horticultural crops, encompassing vegetables and fruit, incur markedly higher per-acre costs because residue-free compliance is mission-critical for fresh produce buyers. Cash crops, such as cotton and tobacco, often adopt biocontrols targeting invasive pests when no synthetic alternatives are available.
United States Department of Agriculture (USDA) surveys indicate adoption rates of 31% for vegetables versus 23% for corn, suggesting that premium price assurance drives quicker uptake in specialty segments. For row-crop growers, cost parity with synthetic products remains the decisive factor, although pressure from the Environmental Protection Agency (EPA) and watershed restrictions are steadily shifting that balance in favor of biocontrol.
Geography Analysis
California, Florida, and Texas together consumed the majority of the national volume in 2024, with California leading due to its dominance in specialty crops and robust organic infrastructure. Year-round production demands constant pest suppression, elevating the United States biocontrol agents market penetration rate in greenhouse tomatoes, strawberries, and leafy greens. Florida’s citrus and vegetable sectors rely on beneficial insects for whitefly and thrips management, and greenhouse acreage accounts for 18% of its farm output.
Midwest states, including Iowa, Illinois, and Indiana, have accounted for a significant portion of row-crop biocontrol sales, with adoption rates continuing to rise since 2022. Large Integrated Pest Management (IPM) cooperatives and watershed protection rules encouraged that shift, and extension advisers provided decision matrices for microbial rotation. Pacific Northwest growers, notably in Washington and Oregon, maintain a prominent adoption because organic acreage density supports regional distribution networks.
Geographic expansion is now the fastest in Georgia, North Carolina, and South Carolina, where diversified farm portfolios and improved consultant availability have increased usage through 2024. Climatic diversity still molds success rates, yet formulation advances now counter arid Southwest challenges that previously limited field persistence. Overall, national coverage is expanding steadily as supply chains become more robust and resilient.
Competitive Landscape
The United States biocontrol agents market remains highly fragmented. Arizona Biological Control Inc. led the market with a significant share of the total market value, closely followed by Beneficial Insectary Inc. (Biobest Group NV). Three other suppliers, including Koppert Biological Systems Inc., BioBee Sde Eliyahu Ltd (Kibbutz Sde Eliyahu), and Bioline AgroSciences Ltd (Union Invivo S.A.) lifted the combined top-five share. Fragmentation persists because diverse pest spectra, climatic differences, and crop-specific efficacy encourage specialization. Yet rising registration costs and nationwide distribution demands are spurring mergers that promise broader product portfolios and stronger technical support.
Patent filings increased by 23% in 2024, particularly for microbial strain engineering and formulation innovation. Conventional pesticide companies are partnering with biocontrol specialists to secure channel access and hedge against tightening synthetic regulations. For example, Certis Biologicals acquired AgBio Solutions in August 2024, extending its cold-chain reach in the Southeast. The competitive narrative is one of dual momentum in which nimble innovators push biological frontiers while larger entities accumulate brands to reach scale economies.
Strategic alliances now blend biology with precision-ag technologies that raise field efficacy and cut labor costs. Koppert Biological Systems B.V. invested USD 15 million in 2024 to automate parasitoid rearing in Michigan, lifting output 60% for protected-culture clients. Valent BioSciences LLC (Sumitomo Chemical Co., Ltd.) introduced a drone-ready insect formulation in July 2024 that lowered aerial release labor by 40% and broadened row-crop coverage. Arizona Biological Control Inc. adopted temperature-stable packaging in November 2024, which doubled parasitoid shelf life and reduced refrigerated freight expenses by 25%. These moves show how scale, digital integration, and logistics innovation are emerging as decisive levers in a market that is gradually tilting toward concentration.
United States Biocontrol Agents Industry Leaders
Arizona Biological Control Inc.
Beneficial Insectary Inc (Biobest Group NV)
BioBee Sde Eliyahu Ltd. (Kibbutz Sde Eliyahu)
Bioline AgroSciences Ltd. (Union Invivo S.A.)
Koppert Biological Systems B.V.
- *Disclaimer: Major Players sorted in no particular order

Recent Industry Developments
- October 2024: Koppert Biological Systems invested USD 15 million to expand its Michigan insect-rearing plant, adding automated systems that raise parasitoid output by 60% for controlled-environment clients.
- September 2024: Marrone Bio Innovations secured Environmental Protection Agency (EPA) approval for a new fungal agent targeting soil pathogens in vegetables, its fifth registration since 2022 and the second to leverage proprietary encapsulation technology.
- August 2024: Certis Biologicals acquired AgBio Solutions for USD 12 million, gaining a Southeastern cold-chain distribution platform and a direct sales team specialized in specialty crops.
- July 2024: Valent BioSciences launched a drone-ready beneficial insect formulation for corn, soybean, and cotton that improves release coverage 40% compared with ground rigs.


United States Biocontrol Agents Market Report Scope
Biocontrol agents are living organisms that manage agricultural pests and diseases, offering a sustainable alternative to chemical pesticides with minimal environmental and human health impact. The United States Biocontrol Agents Market Report is segmented by form, including microbials and macrobials, and by crop type, including row crops, horticultural crops, and cash crops. The market forecasts are provided in terms of value (USD) and volume (metric tons).
| Macrobials | Entamopathogenic Nematodes |
| Parasitoids | |
| Predators | |
| Microbials | Bacterial Biocontrol Agents |
| Fungal Biocontrol Agents | |
| Other Microbials |
| Cash Crops |
| Horticultural Crops |
| Row Crops |
| Form | Macrobials | Entamopathogenic Nematodes |
| Parasitoids | ||
| Predators | ||
| Microbials | Bacterial Biocontrol Agents | |
| Fungal Biocontrol Agents | ||
| Other Microbials | ||
| Crop Type | Cash Crops | |
| Horticultural Crops | ||
| Row Crops | ||


Market Definition
- AVERAGE DOSAGE RATE - The average application rate is the average volume of biocontrol agents applied per hectare of farmland in the respective region/country.
- CROP TYPE - Crop type includes Row crops (Cereals, Pulses, Oilseeds), Horticultural Crops (Fruits and vegetables) and Cash Crops (Plantation Crops, Fibre Crops and Other Industrial Crops)
- FUNCTION - The Crop Protection function of agirucultural biological include products that prevent or control various biotic and abiotic stress.
- TYPE - Biocontrol agents are the natural predators and parasitoids used to control various pests. Biocontrol agents include both microbials (Microorganisms) and macrobials (Insects).
| Keyword | Definition |
|---|---|
| Cash Crops | Cash crops are non-consumable crops sold as a whole or part of the crop to manufacture end-products to make a profit. |
| Integrated Pest Management (IPM) | IPM is an environment-friendly and sustainable approach to control pests in various crops. It involves a combination of methods, including biological controls, cultural practices, and selective use of pesticides. |
| Bacterial biocontrol agents | Bacteria used to control pests and diseases in crops. They work by producing toxins harmful to the target pests or competing with them for nutrients and space in the growing environment. Some examples of commonly used bacterial biocontrol agents include Bacillus thuringiensis (Bt), Pseudomonas fluorescens, and Streptomyces spp. |
| Plant Protection Product (PPP) | A plant protection product is a formulation applied to crops to protect from pests, such as weeds, diseases, or insects. They contain one or more active substances with other co-formulants such as solvents, carriers, inert material, wetting agents or adjuvants formulated to give optimum product efficacy. |
| Pathogen | A pathogen is an organism causing disease to its host, with the severity of the disease symptoms. |
| Parasitoids | Parasitoids are insects that lay their eggs on or within the host insect, with their larvae feeding on the host insect. In agriculture, parasitoids can be used as a form of biological pest control, as they help to control pest damage to crops and decrease the need for chemical pesticides. |
| Entomopathogenic Nematodes (EPN) | Entomopathogenic nematodes are parasitic roundworms that infect and kill pests by releasing bacteria from their gut. Entomopathogenic nematodes are a form of biocontrol agents used in agriculture. |
| Vesicular-arbuscular mycorrhiza (VAM) | VAM fungi are mycorrhizal species of fungus. They live in the roots of different higher-order plants. They develop a symbiotic relationship with the plants in the roots of these plants. |
| Fungal biocontrol agents | Fungal biocontrol agents are the beneficial fungi that control plant pests and diseases. They are an alternative to chemical pesticides. They infect and kill the pests or compete with pathogenic fungi for nutrients and space. |
| Biofertilizers | Biofertilizers contain beneficial microorganisms that enhance soil fertility and promote plant growth. |
| Biopesticides | Biopesticides are natural/bio-based compounds used to manage agricultural pests using specific biological effects. |
| Predators | Predators in agriculture are the organisms that feed on pests and help control pest damage to the crops. Some common predator species used in agriculture include ladybugs, lacewings, and predatory mites. |
| Biocontrol agents | Biocontrol agents are living organisms used to control pests and diseases in agriculture. They are alternatives to chemical pesticides and are known for their lesser impact on the environment and human health. |
| Organic Fertilizers | Organic fertilizer is composed of animal or vegetable matter used alone or in combination with one or more non-synthetically derived elements or compounds used for soil fertility and plant growth. |
| Protein hydrolysates (PHs) | Protein hydrolysate-based biostimulants contain free amino acids, oligopeptides, and polypeptides produced by enzymatic or chemical hydrolysis of proteins, primarily from vegetal or animal sources. |
| Biostimulants/Plant Growth Regulators (PGR) | Biostimulants/Plant Growth Regulators (PGR) are substances derived from natural resources to enhance plant growth and health by stimulating plant processes (metabolism). |
| Soil Amendments | Soil Amendments are substances applied to soil that improve soil health, such as soil fertility and soil structure. |
| Seaweed Extract | Seaweed extracts are rich in micro and macronutrients, proteins, polysaccharides, polyphenols, phytohormones, and osmolytes. These substances boost seed germination and crop establishment, total plant growth and productivity. |
| Compounds related to biocontrol and/or promoting growth (CRBPG) | Compounds related to biocontrol or promoting growth (CRBPG) are the ability of a bacteria to produce compounds for phytopathogen biocontrol and plant growth promotion. |
| Symbiotic Nitrogen-Fixing Bacteria | Symbiotic nitrogen-fixing bacteria such as Rhizobium obtain food and shelter from the host, and in return, they help by providing fixed nitrogen to the plants. |
| Nitrogen Fixation | Nitrogen fixation is a chemical process in soil which converts molecular nitrogen into ammonia or related nitrogenous compounds. |
| ARS (Agricultural Research Service) | ARS is the U.S. Department of Agriculture's chief scientific in-house research agency. It aims to find solutions to agricultural problems faced by the farmers in the country. |
| Phytosanitary Regulations | Phytosanitary regulations imposed by the respective government bodies check or prohibit the importation and marketing of certain insects, plant species, or products of these plants to prevent the introduction or spread of new plant pests or pathogens. |
| Ectomycorrhizae (ECM) | Ectomycorrhiza (ECM) is a symbiotic interaction of fungi with the feeder roots of higher plants in which both the plant and the fungi benefit through the association for survival. |


Research Methodology
Mordor Intelligence follows a four-step methodology in all our reports.
- Step-1: Identify Key Variables: In order to build a robust forecasting methodology, the variables and factors identified in Step-1 are tested against available historical market numbers. Through an iterative process, the variables required for market forecast are set and the model is built on the basis of these variables.
- Step-2: Build a Market Model: Market-size estimations for the forecast years are in nominal terms. Inflation is not a part of the pricing, and the average selling price (ASP) is kept constant throughout the forecast period.
- Step-3: Validate and Finalize: In this important step, all market numbers, variables and analyst calls are validated through an extensive network of primary research experts from the market studied. The respondents are selected across levels and functions to generate a holistic picture of the market studied.
- Step-4: Research Outputs: Syndicated Reports, Custom Consulting Assignments, Databases & Subscription Platforms.


