United States Additive Manufacturing Market Size and Share
Market Overview
| Study Period | 2020 - 2031 |
|---|---|
| Forecast Data Period | 2026 - 2031 |
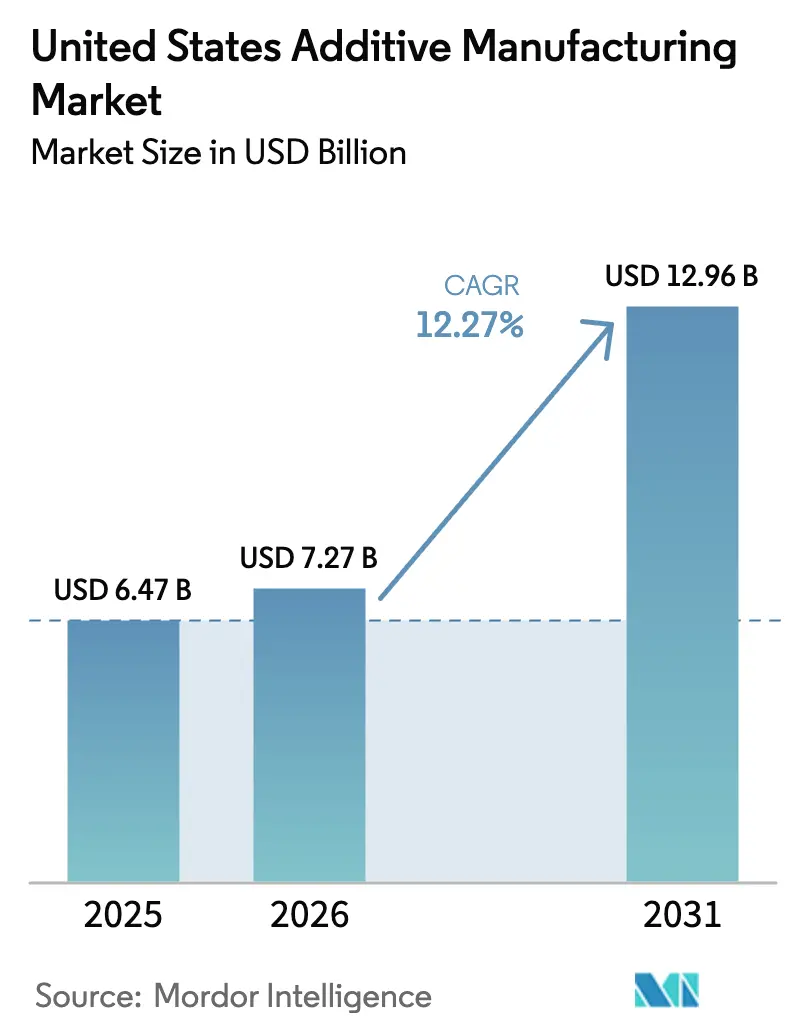
| Base Year Market Size (2025) | USD 6.47 Billion |
| Market Size (2026) | USD 7.27 Billion |
| Market Size (2031) | USD 12.96 Billion |
| Growth Rate (2026 - 2031) | 12.27% CAGR |
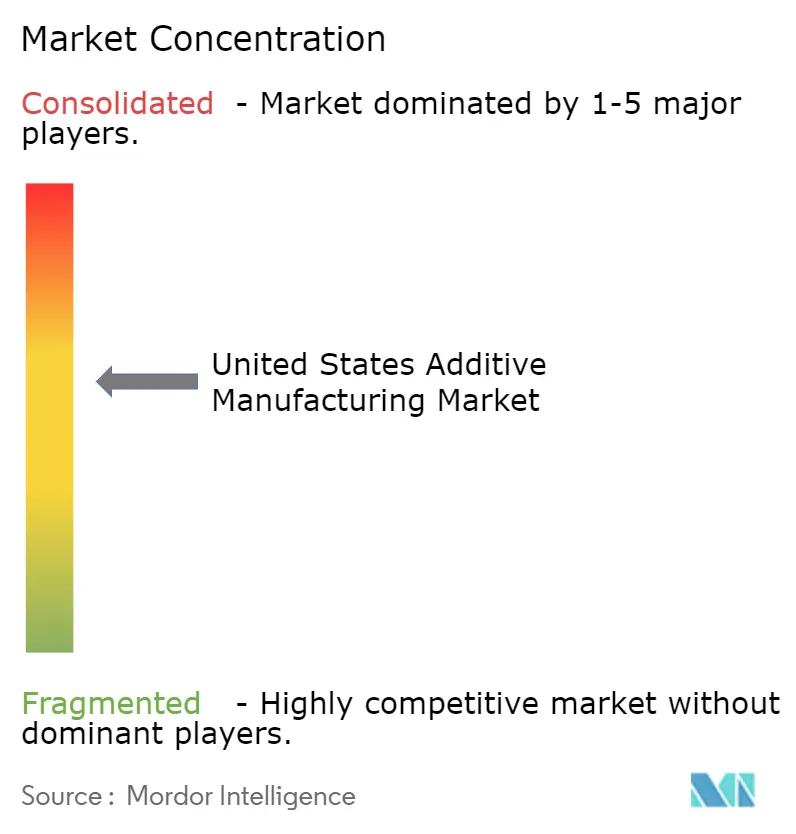
| Market Concentration | Medium |
Major Players *Disclaimer: Major Players sorted in no particular order Image © Mordor Intelligence. Reuse requires attribution under CC BY 4.0. | |
United States Additive Manufacturing Market Analysis by Mordor Intelligence
The United States additive manufacturing market size is expected to grow from USD 6.47 billion in 2025 to USD 7.27 billion in 2026 and is forecast to reach USD 12.96 billion by 2031 at 12.27% CAGR over 2026-2031. Weight-saving opportunities in aerospace, on-site production for defense depots, and patient-specific implants in orthopedics are moving the technology from prototyping to certified end-use production. Federal incentives such as Inflation Reduction Act Section 48D credits reward domestic advanced-manufacturing investment, while Department of Defense (DoD) budget allocations create long-term demand signals for military platforms.[1]Internal Revenue Service, “26 CFR 1.48D-1 — Advanced Manufacturing Investment Credit Determined,” ecfr.gov Vertical integration through mergers-most visibly Nano Dimension’s 2025 take-over of Desktop Metal and Markforged-strengthens multi-material capabilities and increases scale. However, qualification costs above USD 600,000 per part and nickel-alloy powder at USD 120/kg restrain uptake in regulated sectors.
Key Report Takeaways
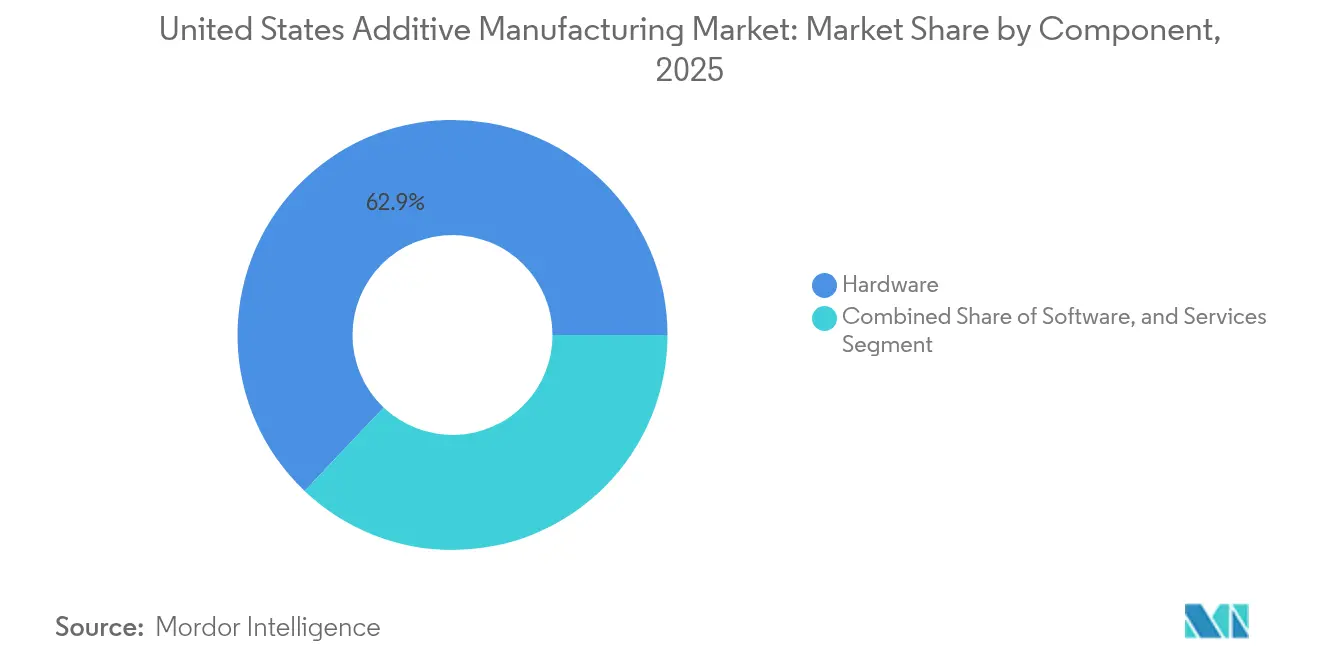
- By component, hardware led with 62.92% of United States additive manufacturing market share in 2025, while services are projected to expand at a 14.02% CAGR to 2031.
- By material, polymers captured 48.75% share of the United States additive manufacturing market size in 2025; metals are forecast to grow at a 15.12% CAGR through 2031.
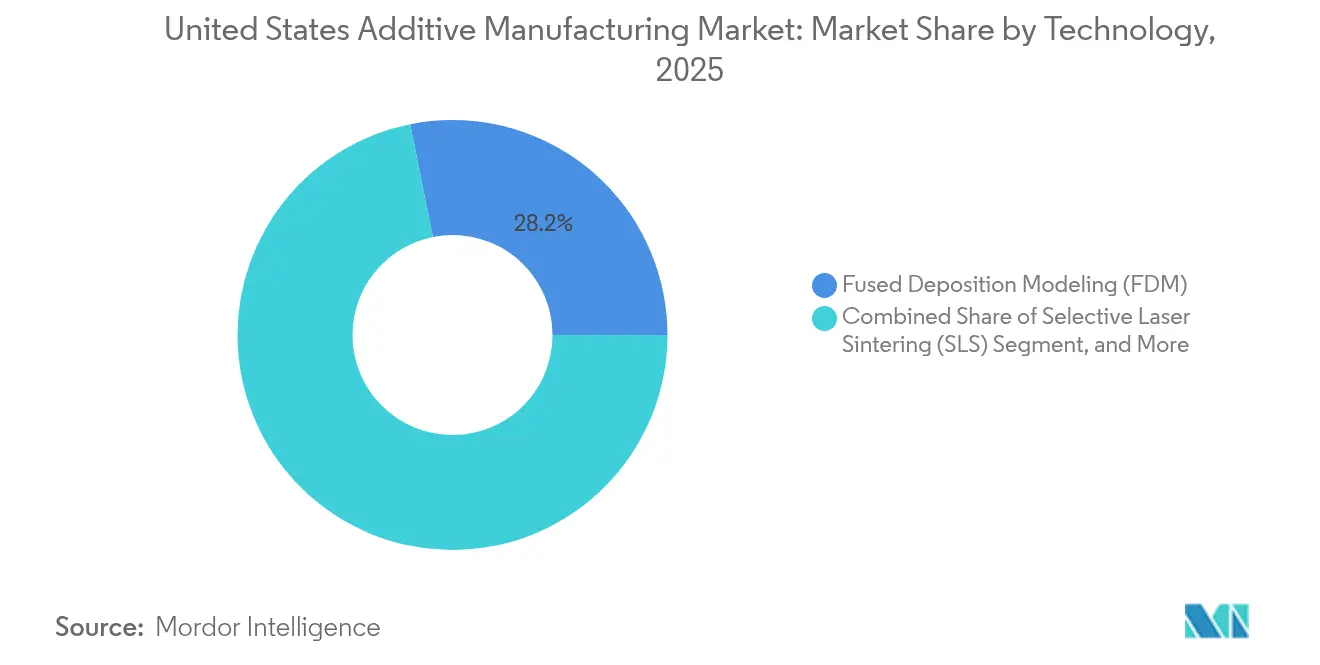
- By technology, fused deposition modeling commanded 28.15% share of the United States additive manufacturing market in 2025, whereas binder jetting is poised for 15.82% CAGR growth.
- By end-user industry, aerospace and defense held 30.95% of the United States additive manufacturing market share in 2025, while medical and dental applications are advancing at a 13.05% CAGR through 2031.
Note: Market size and forecast figures in this report are generated using Mordor Intelligence’s proprietary estimation framework, updated with the latest available data and insights as of 2026.
United States Additive Manufacturing Market Trends and Insights
Drivers Impact Analysis*
| Driver | (~) % Impact on CAGR Forecast | Geographic Relevance | Impact Timeline |
|---|---|---|---|
| FAA qualification of 3DP flight parts | +2.1% | National, aerospace hubs | Medium term (2-4 years) |
| DoD additive‐manufacturing roadmap | +1.8% | National, military depots | Long term (≥ 4 years) |
| Orthopedic OEM shift to porous titanium | +1.4% | National, medical-device clusters | Medium term (2-4 years) |
| Oil-and-gas WAAM spares | +0.9% | Regional, energy corridors | Long term (≥ 4 years) |
| Semiconductor tooling with AM cooling | +0.7% | Regional, chip-fabrication states | Short term (≤ 2 years) |
| IRA §48D credits for on-shoring | +0.5% | National, investment zones | Medium term (2-4 years) |
| Source: Mordor Intelligence | |||
Federal Aviation Administration Qualification Accelerates Aerospace Adoption
The Federal Aviation Administration modernized its special-airworthiness pathway in 2024, giving OEMs a clear route to certify 3D-printed flight hardware.[2] GE Additive’s LEAP engine fuel nozzle achieved 25% weight reduction and removed 18 parts, validating the economic case for consolidated designs. Boeing and Airbus now operate in-house additive centers to secure critical supply chains. ASTM’s joint standards work with the FAA supports unified quality metrics, pushing the United States additive manufacturing market deeper into primary-structure applications. As air-framer demand grows, equipment vendors compete on multi-laser throughput and real-time melt-pool monitoring.
Orthopedic Sector Transforms Through Patient-Specific Manufacturing
Selective laser melting enables lattice implants that replicate bone anisotropy, mitigating stress shielding in younger patients.[2]Federal Aviation Administration, “Modernization of Special Airworthiness Certification,” federalregister.gov FDA revisions aligning Quality System Regulation with ISO 13485:2016 take effect in February 2026, streamlining approval of customized devices.[3]BioMed, “Customized Lattice Structures Tailored to Mimic Patients' Bone Anisotropic Properties,” mdpi.com Lead times shrink from eight weeks to two, and surgeons report shorter operating times when patient-matched models guide pre-operative planning. As outcomes data accumulates, insurers consider value-based reimbursement, lifting barriers to routine use. These dynamics position medical implants as a double-digit growth engine within the United States additive manufacturing market.
Oil and Gas Infrastructure Adopts Large-Format WAAM
Wire arc additive manufacturing (WAAM) now produces meter-scale pipeline valves and pump housings on demand, eliminating long-lead castings.[4]Journal of Manufacturing and Materials Processing, “Thermo-Mechanical Modeling of Large-Scale WAAM Components,” mdpi.com Operators cut material waste by up to 90% and reduce downtime in remote facilities. WAAM’s lower energy profile compared with die casting aligns with corporate decarbonization targets. Regional production hubs create distributed resilience, and design tweaks for flow efficiency are implemented with no new tooling. These operational gains expand metal throughput in the United States additive manufacturing market.
Department of Defense Roadmap Drives Systematic Military Adoption
The DoD’s 2024–2030 roadmap embeds additive manufacturing into every service branch, aligning USD 10.4 billion in FY 2025 RDT&E funds toward advanced-manufacturing components. Fleet Readiness Centers already print tooling and spare parts, while the Army fields containerized printers for depot-level repairs. Standardized material specs through ASTM ensure interoperability, allowing lessons learned in defense to spill over to commercial aerospace. The resulting long-term demand locks in hardware upgrades, boosting the United States additive manufacturing market across build-volume classes.
Restraints Impact Analysis*
| Restraint | (~) % Impact on CAGR Forecast | Geographic Relevance | Impact Timeline |
|---|---|---|---|
| Qualification cost > USD 600k/part | -1.9% | National, aerospace & medical | Medium term (2-4 years) |
| Powder price volatility (Ni alloys to USD 120/kg) | -1.2% | National, metal service bureaus | Short term (≤ 2 years) |
| Limited ASTM Type III & IV data | -0.8% | National, all metal AM | Long term (≥ 4 years) |
| Skilled operator shortage | -0.7% | National, advanced-manufacturing regions | Medium term (2-4 years) |
| Source: Mordor Intelligence | |||
Qualification Costs Create Regulatory Bottlenecks
Part-by-part certification in aerospace and medical can top USD 600,000, deterring SMEs from high-margin programs. Extensive fatigue testing, CT scanning and statistical process control lengthen time-to-market. America Makes’ USD 3.2 million Delta Qualification project applies machine-learning property prediction to reduce testing cycles, but agencies remain cautious. Large OEMs absorb the expense and widen competitive moats. Until streamlined protocols mature, this barrier tempers growth in the United States additive manufacturing market.
Feedstock Price Volatility Pressures Service-Bureau Economics
Nickel-alloy powder spiked to USD 120/kg in 2024 amid geopolitical disruptions, raising raw-material cost to 40-60% of part price. Titanium supply uncertainties compound risk. Service bureaus struggle to quote long-run contracts, throttling capacity investments. Some firms invest in closed-loop powder recycling, while others pivot toward polymers. Price swings therefore suppress near-term margins across the United States additive manufacturing market.
*Our forecasts treat driver/restraint impacts as directional, not additive. The impact forecasts reflect baseline growth, mix effects, and variable interactions.
Segment Analysis
By Component: Hardware Strength Meets Outsourced Production Momentum
Hardware captured 62.92% of the United States additive manufacturing market in 2025, underscoring the capital intensity of industrial printers that now feature multi-kilowatt lasers and automated powder handling. Stratasys secured USD 120 million from Fortissimo Capital in February 2025 to expand high-throughput F3300 platforms. The services segment, however, is growing 14.02% annually as firms outsource production to avoid depreciation and maintenance costs. Protolabs’ end-to-end contract model typifies this shift.
Software revenues scale with machine installations; EOS and 1000 Kelvin introduced AMAIZE, an AI co-pilot that trims build-parameter iteration by 80%. Inspection tools integrate CT analytics to accelerate qualification cycles. As equipment becomes modular, subscription-based software and preventative-maintenance services gain traction, gradually rebalancing revenue toward recurring streams. This blend of capital sales and high-margin services will sustain the United States additive manufacturing market through 2031.


By Material: Polymers Stabilize, Metals Accelerate
Polymers held 48.75% share in 2025 thanks to mature prototyping demand, while metals will expand at 15.12% CAGR as more flight-critical and energy components enter serial production. Titanium alloys dominate aerospace; stainless steel and Inconel serve turbine hot sections in power generation. The United States additive manufacturing market size for metal implants alone is forecast to reach USD 2.17 billion by 2031, supported by ISO-aligned FDA approval pathways.
Composite feedstocks and high-performance thermosets open new opportunities in motorsport and defense. Ceramic printing remains niche but strategic for hypersonic heat-shields. Powder suppliers align with ASTM F42 working groups to standardize Type III and IV mechanical data, a prerequisite for structural certification. As databases mature, material diversification will fuel broader acceptance across the United States additive manufacturing market.
By Technology: FDM Dominance Confronts Binder-Jetting Upswing
Fused deposition modeling led with 28.15% revenue share in 2025 because of low entry cost and broad polymer portfolio. Stratasys shipped 30+ F3300 machines to aerospace and defense users for jigs and fixtures, citing 25% faster build times. Binder jetting, projected at 15.82% CAGR, enables mass-production of steel tooling inserts and copper heat-exchangers without laser melting, cutting per-part energy use in half. Nikon SLM Solutions’ quad-laser SLM 500 and eight-laser SLM 800 platforms illustrate the throughput race in powder-bed metals.
Hybrid machines integrate subtractive finishing to meet aerospace tolerances in one setup. Real-time acoustic-emission sensing and layerwise thermography enhance process stability, a critical factor as the United States additive manufacturing market transitions to lights-out factories.
By End-User Industry: Aerospace Scale, Medical Velocity
Aerospace and defense contributed 30.95% of revenue in 2025, leveraging certified titanium parts to save fuel and extend range. Relativity Space famously flight-tested a 3D-printed rocket stage, demonstrating structural viability for extreme environments. Medical and dental volumes, growing at 13.05% CAGR, capitalize on FDA-aligned digital workflows that deliver patient-matched implants in days. Orthopedic OEMs reported 18% reduction in revision surgeries when porous titanium improved osseointegration.
Automotive lightweighting, oil-and-gas spare-parts localization, and semiconductor tooling further diversify demand. Education and research institutes embed additive curricula to close the skilled-labor gap, reinforcing the talent pipeline essential for scaling the United States additive manufacturing market.
Geography Analysis
Regional clusters mirror legacy manufacturing strengths. Washington and California host aerospace giants, supporting dense printer networks for flight hardware qualification. South-eastern states attract green-field investment through right-to-work policies and access to military installations, aligning with the Navy’s distributed advanced-manufacturing strategy. The Midwest remains pivotal for automotive tooling and polymer prototyping, while Gulf-coast energy corridors lead WAAM adoption for pipeline spares.
Federal place-based incentives steer semiconductor-tooling projects toward Arizona, Texas and New York under the CHIPS Act, stimulating demand for conformal-cooled fixtures. North Carolina secured a USD 285 million Manufacturing USA institute focused on digital twins, anchoring additive R&D on the East Coast U.S.. Workforce programs, such as IACMI’s DoD partnership, prioritize composites and metal-matrix printing skills in Tennessee and Ohio.
Supply-chain resilience influences siting decisions. Domestic titanium initiatives hedge Russian feedstock risk, while powder-recycling startups colocate near service bureaus to slash logistics. ASTM’s USD 15 million Standardization Center of Excellence establishes a national hub for data harmonization but distributes pilot projects across universities, ensuring benefits accrue nationwide. All told, regional specialization combined with federal coordination underpins balanced expansion of the United States additive manufacturing market.
Competitive Landscape
Market structure remains fragmented, yet consolidation is accelerating. Nano Dimension’s 2025 dual acquisitions create a portfolio covering electronics, metals and composites, enhancing cross-sell potential to aerospace primes. Stratasys, flush with Fortissimo Capital funds, eyes inorganic growth to extend polymer leadership into composite and large-format metal domains. EOS focuses on AI-driven process control, offering subscription software that locks in recurring revenue.
Service bureaus differentiate by material and vertical. Mears Machine ran its third Velo3D Sapphire XC to secure defense aluminum contracts, while i3D MFG ordered 12 EOS M 400-4 printers to scale stainless-steel production for power-generation clients. Intellectual-property stakes rise as companies patent in-process monitoring and carbon-fiber deposition. Sustainability credentials, such as AMGTA’s recognition of Stratasys, increasingly influence customer selection.
Competitive intensity varies by niche: high-volume polymer prototyping sees price compression, whereas certified metal flight parts command premium margins. Top-five vendors controlled about 52% of hardware revenue in 2024, suggesting room for both consolidation and specialist entrants. As automation lowers per-unit labor, scale advantages will widen, shaping the future trajectory of the United States additive manufacturing market.
United States Additive Manufacturing Industry Leaders
3D Systems Corporation
General Electric Company (GE Additive)
Nikon SLM
Ricoh USA Inc.
EOS GmbH
- *Disclaimer: Major Players sorted in no particular order

Recent Industry Developments
- April 2025: Nano Dimension completed its acquisition of Markforged, integrating composite and metal systems.
- April 2025: Nano Dimension finalized its acquisition of Desktop Metal, broadening volume-production capabilities.
- February 2025: Stratasys received a USD 120 million equity investment from Fortissimo Capital to fund acquisitions.
- February 2025: Formlabs acquired Micronics to accelerate selective-laser-sintering accessibility.
- February 2025: ASTM International secured USD 2.1 million from DoD to research sustainable material recycling in additive processes.


United States Additive Manufacturing Market Report Scope
In contrast to traditional subtractive methods that remove material from a solid block, additive manufacturing constructs 3D objects by adding material layer by layer. The study tracks the revenue accrued through the sale of additive manufacturing components in the US market by various players. The study also tracks the key market parameters, underlying growth influencers, and major vendors operating in the industry, which supports the market estimations and growth rates during the forecast period.
The US additive manufacturing market is segmented by component (hardware [desktop 3d printer and industrial 3d printer], software [design software, inspection software, printing software, and scanning software], and services), material (polymer, metal, and ceramic), technology (stereo lithography, selective laser sintering, fused deposition modeling, laser sintering, binder jetting printer, and other technologies), and end-user vertical (automotive, aerospace and defense, healthcare, consumer electronics, power and energy, fashion and jewelry, dentistry, and other end-user verticals). The market sizes and forecasts are provided in terms of value (USD) for all the above segments.
| Hardware | Desktop 3D Printers |
| Industrial 3D Printers | |
| Software | Design Software |
| Inspection/Metrology Software | |
| Printer/Build-Prep Software | |
| Scanning and Reverse-Engineering Software | |
| Services |
| Polymers |
| Metals |
| Ceramics |
| Composites and High-Performance Thermosets |
| Stereolithography (SLA) |
| Selective Laser Sintering (SLS) |
| Fused Deposition Modeling (FDM) |
| Direct Metal Laser Sintering (DMLS) |
| Binder Jetting |
| Electron Beam Melting (EBM) |
| Material Jetting |
| Aerospace and Defense |
| Automotive and Motorsports |
| Medical and Dental |
| Consumer Electronics and IoT Devices |
| Oil, Gas and Power Generation |
| Fashion, Jewelry and Luxury Goods |
| Industrial Machinery and Tooling |
| Construction and Architecture |
| Education and Research Institutes |
| By Component | Hardware | Desktop 3D Printers |
| Industrial 3D Printers | ||
| Software | Design Software | |
| Inspection/Metrology Software | ||
| Printer/Build-Prep Software | ||
| Scanning and Reverse-Engineering Software | ||
| Services | ||
| By Material | Polymers | |
| Metals | ||
| Ceramics | ||
| Composites and High-Performance Thermosets | ||
| By Technology | Stereolithography (SLA) | |
| Selective Laser Sintering (SLS) | ||
| Fused Deposition Modeling (FDM) | ||
| Direct Metal Laser Sintering (DMLS) | ||
| Binder Jetting | ||
| Electron Beam Melting (EBM) | ||
| Material Jetting | ||
| By End-user Industry | Aerospace and Defense | |
| Automotive and Motorsports | ||
| Medical and Dental | ||
| Consumer Electronics and IoT Devices | ||
| Oil, Gas and Power Generation | ||
| Fashion, Jewelry and Luxury Goods | ||
| Industrial Machinery and Tooling | ||
| Construction and Architecture | ||
| Education and Research Institutes | ||


Key Questions Answered in the Report
What is the current value of the United States additive manufacturing market?
The market is valued at USD 7.27 billion in 2026 and is projected to reach USD 12.96 billion by 2031 at a 12.27% CAGR.
Which component segment is growing fastest in the United States additive manufacturing market?
Services are expanding at a 14.02% CAGR because companies prefer outsourcing to avoid equipment capital cost
Why are metals gaining traction compared with polymers?
Certified metal applications in aerospace, energy and medical implants are growing 15.12% annually as qualification frameworks mature and multi-laser printers increase throughput.
How are federal policies influencing regional growth?
CHIPS Act and Inflation Reduction Act incentives channel additive-manufacturing investment into designated semiconductor and advanced-manufacturing zones, spurring cluster development in states such as Arizona and North Carolina
What is the main barrier to wider adoption in regulated industries?
Qualification costs above USD 600,000 per part and extensive documentation requirements slow first-article acceptance, particularly for SMEs.
How will the competitive landscape evolve through 2031?
Continued mergers, AI-integrated quality control and hybrid manufacturing platforms are expected to drive consolidation, pushing market-concentration toward higher scores while still leaving room for specialist innovators.
Page last updated on:


