
Technology, Media and Telecom
5th MayPricing Strategy for Semiconductor Components
3 Min Read
The Metal 3D Printing Market Report is Segmented by Technology (Powder Bed Fusion, Binder Jetting, and More), Component (Hardware, Software, and Services), Printer Type (Industrial, and Desktop/Benchtop), Material (Titanium and Alloys, Nickel-Based Super-Alloys, and More), End-User Industry (Aerospace and Defense, Automotive and Motorsports, and More), and Geography. The Market Forecasts are Provided in Terms of Value (USD).
Market Overview
| Study Period | 2020 - 2031 |
|---|---|
| Market Size (2026) | USD 11.18 Billion |
| Market Size (2031) | USD 23.07 Billion |
| Growth Rate (2026 - 2031) | 15.58 % CAGR |
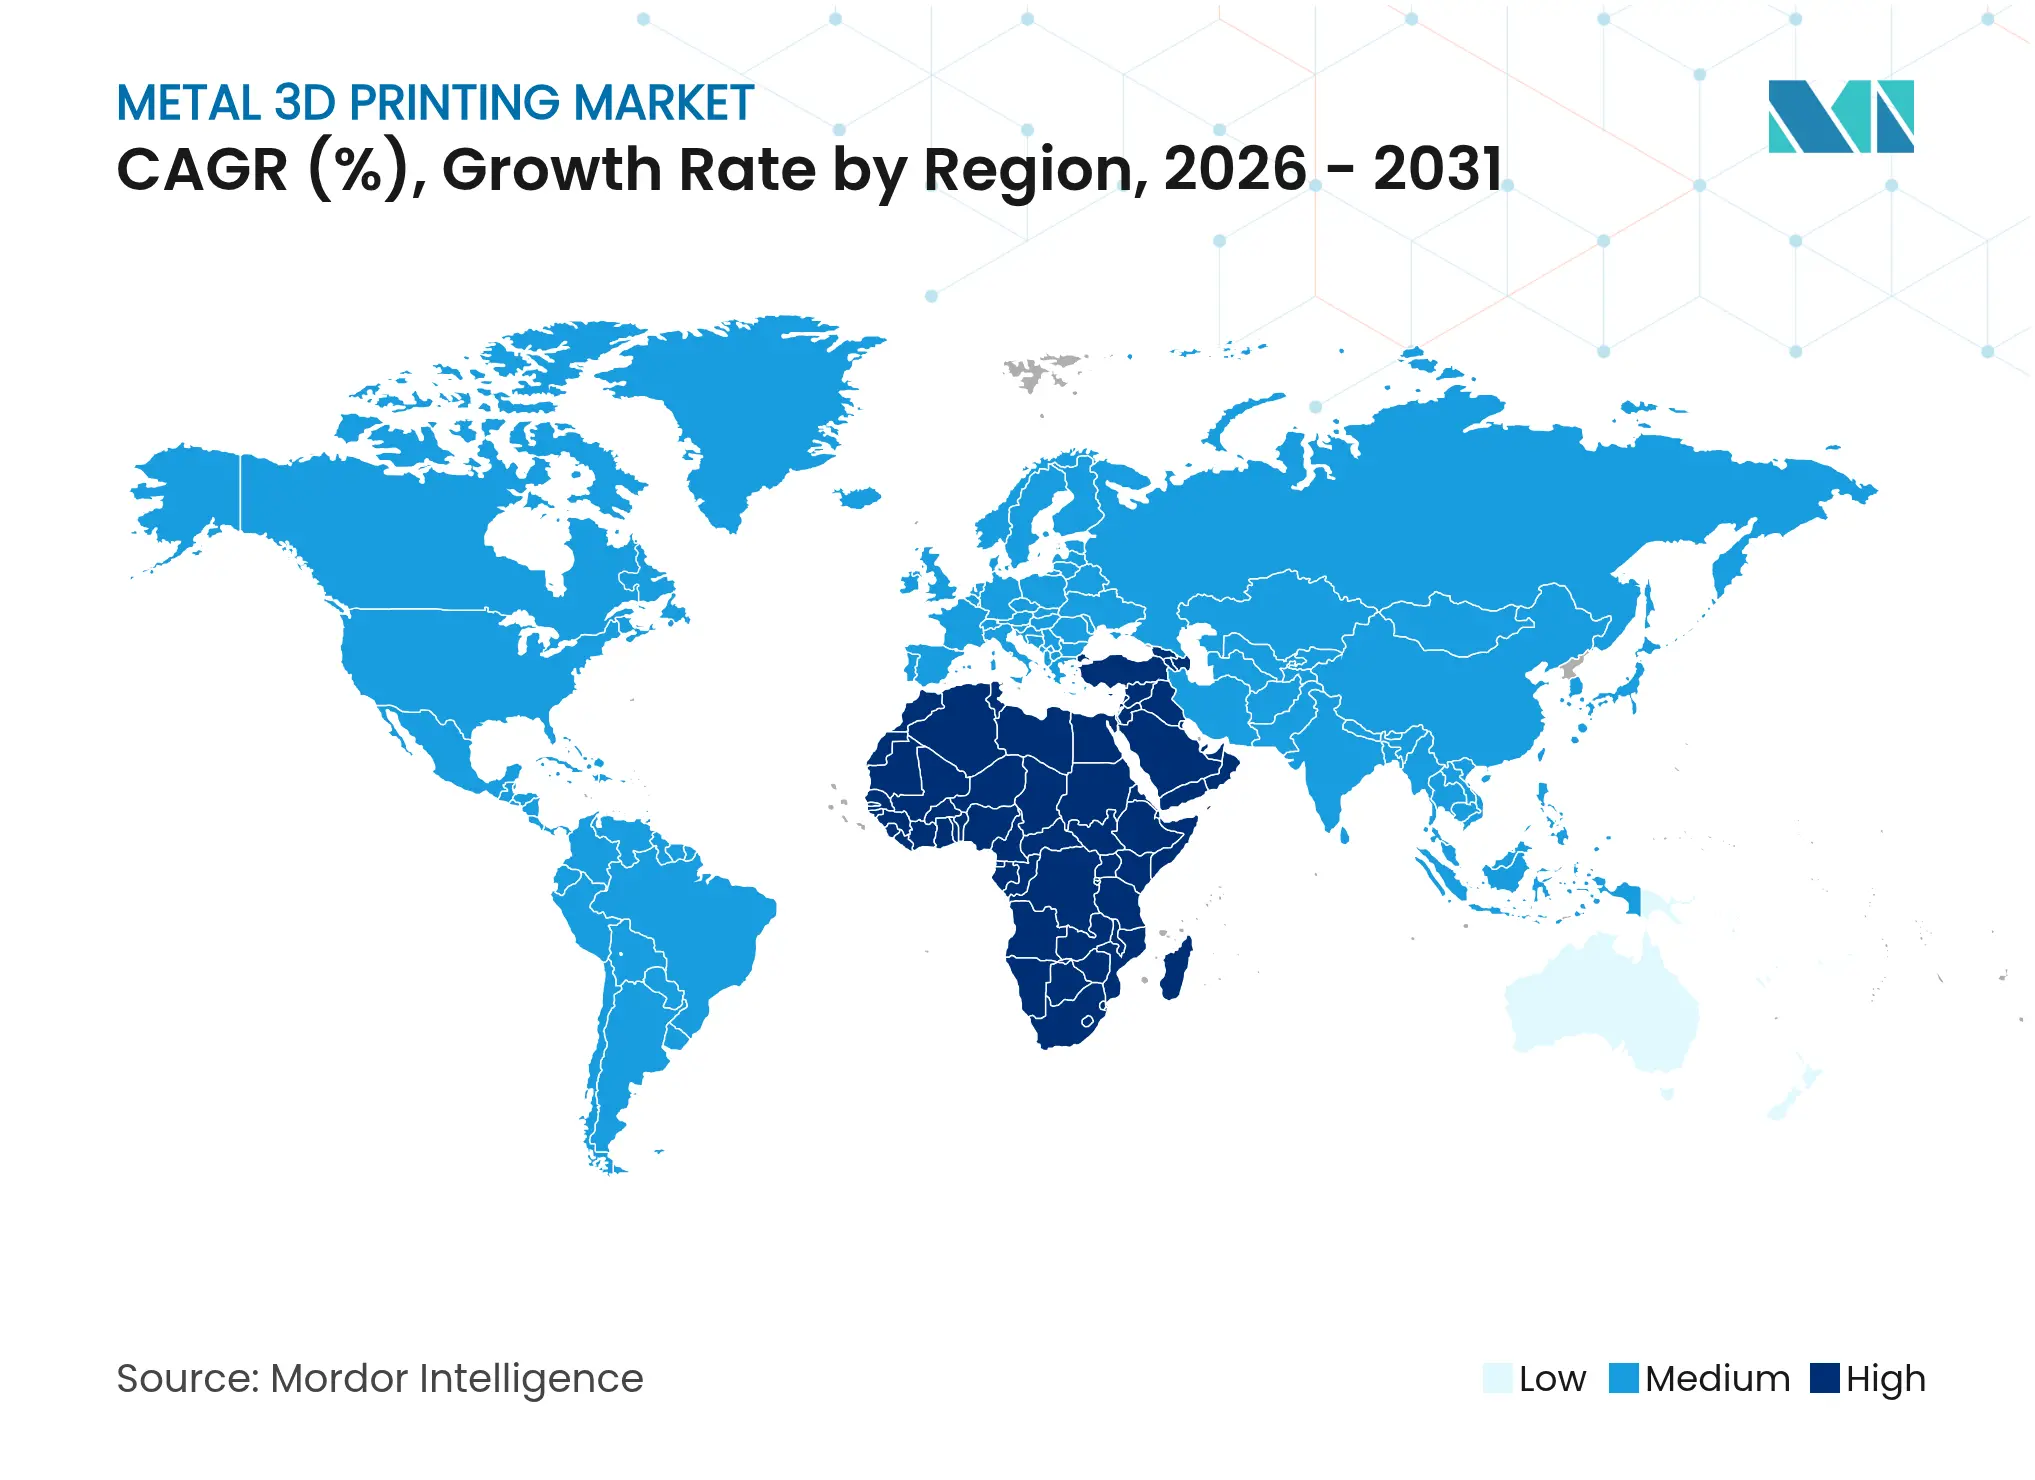
| Fastest Growing Market | Asia Pacific |
| Largest Market | North America |
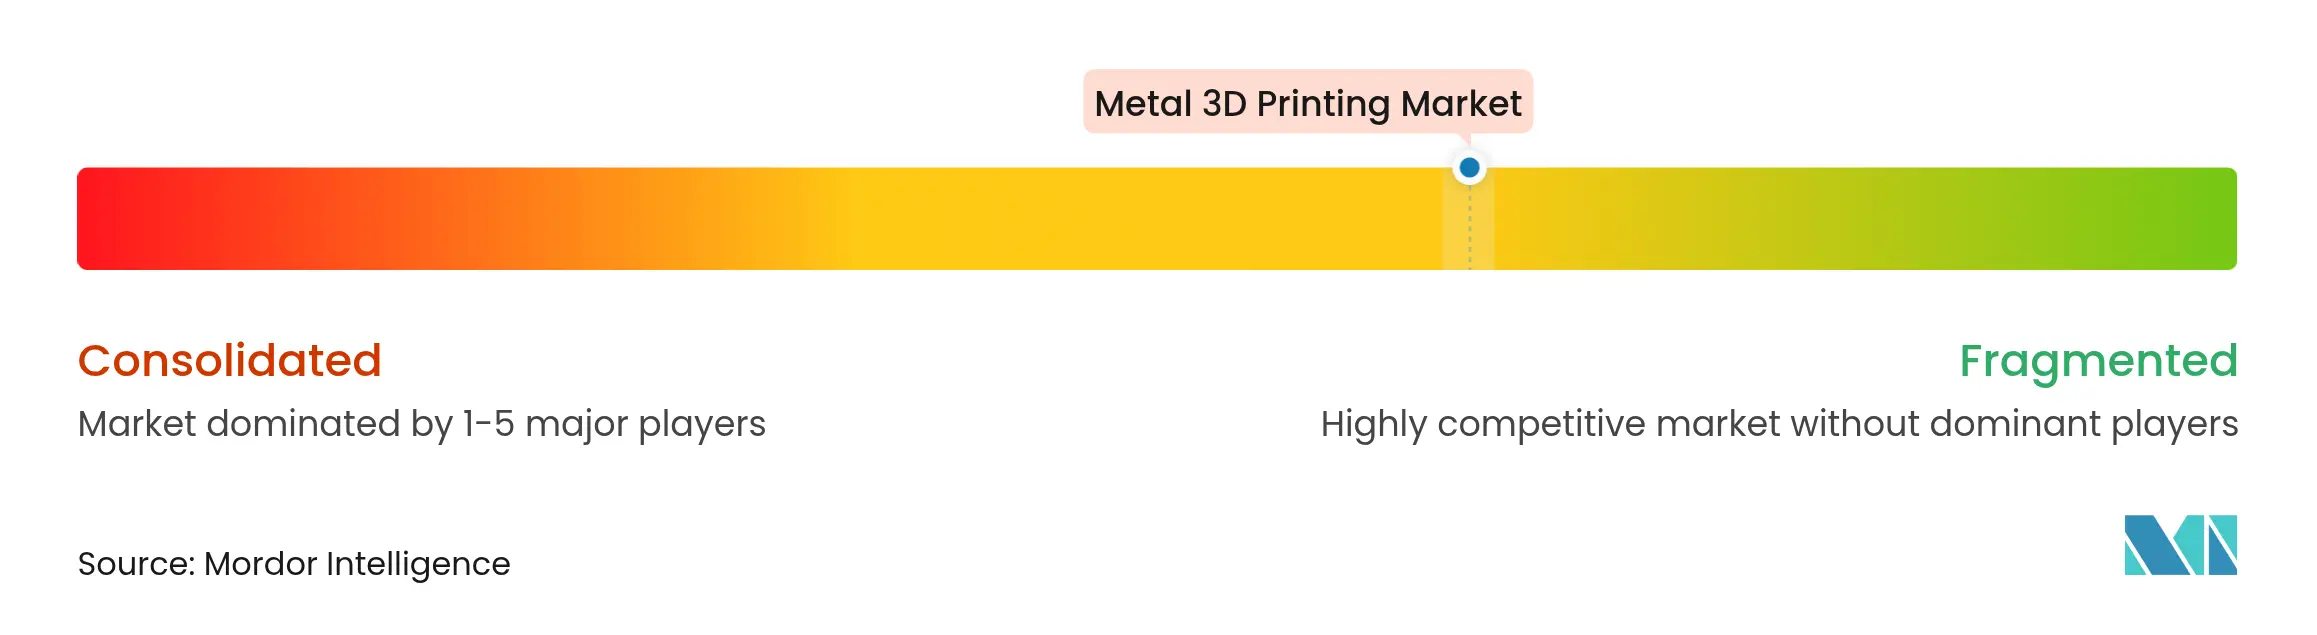
| Market Concentration | Medium |
Major Players *Disclaimer: Major Players sorted in no particular order. Image © Mordor Intelligence. Reuse requires attribution under CC BY 4.0. |
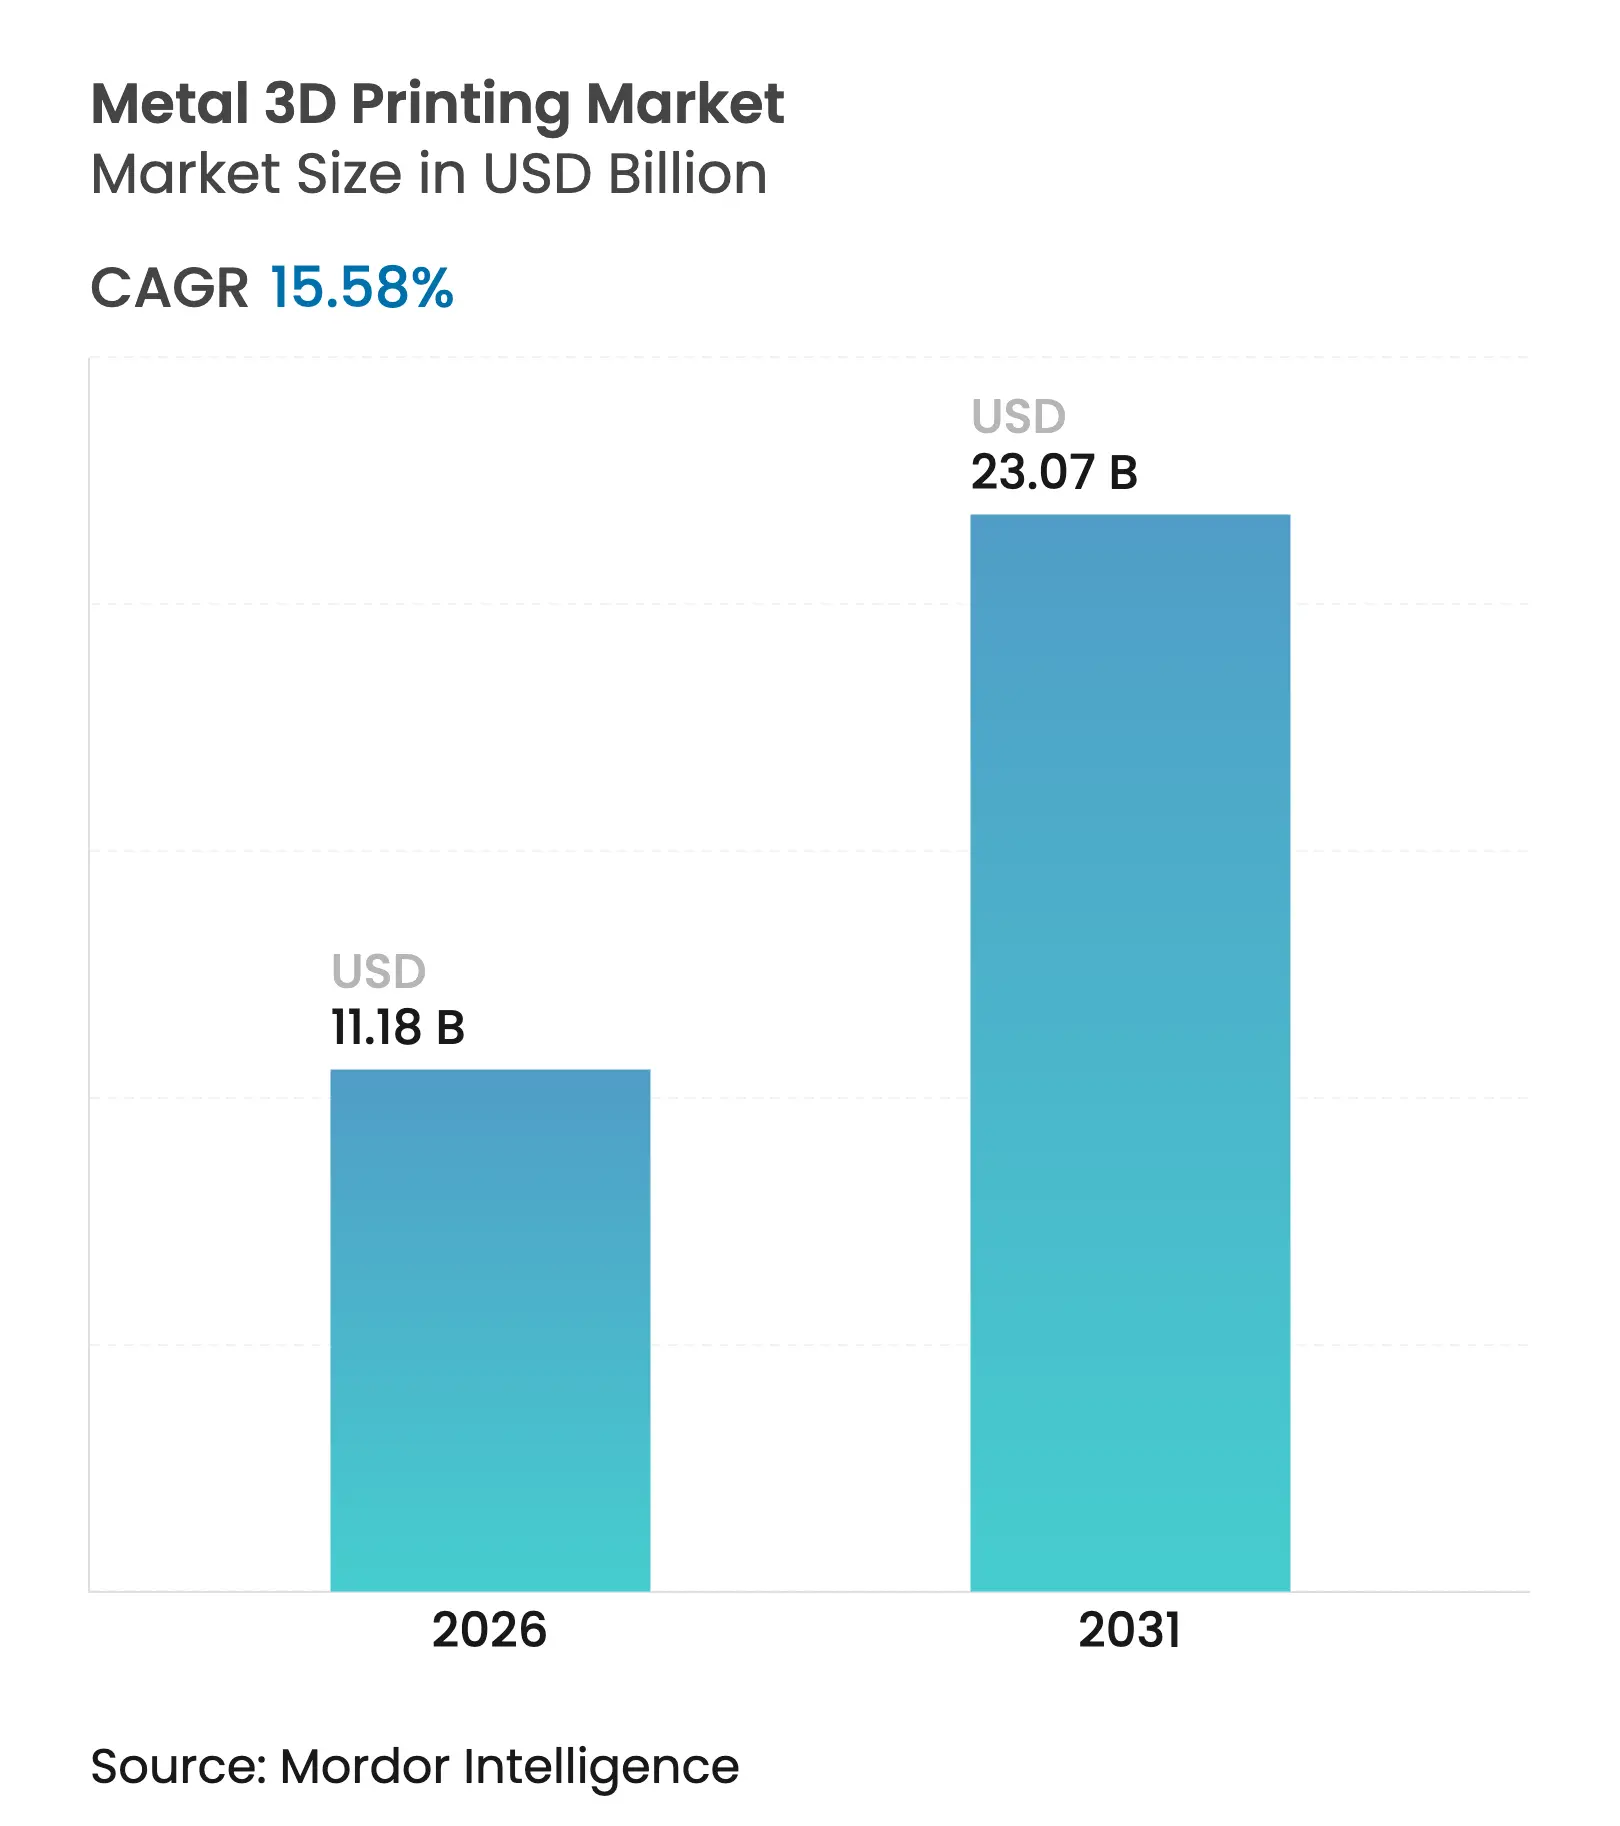
The metal 3D printing market size is expected to grow from USD 9.67 billion in 2025 to USD 11.18 billion in 2026 and is forecast to reach USD 23.07 billion by 2031 at 15.58% CAGR over 2026-2031. The surge reflects government-funded hypersonics programs, EU net-zero aviation mandates, and 37% part-cost reductions achieved after German qualification of 12 kW laser powder bed fusion (PBF) lines.[1]EOS, “EOS helps Atlas Copco cut costs by 30%, Lead Times by 90%,” eos.info North American defense spending, China’s Made in 2025 subsidies, and FDA 510(k) guidance for additively manufactured implants are widening application scopes while shrinking certification timelines.[2]U.S. Food and Drug Administration, “Evidentiary Expectations for 510(k) Implant Devices,” fda.gov Hardware continues to dominate capital budgets, yet services are scaling faster as manufacturers pivot to outcome-based revenue models. Titanium alloys hold the largest share of qualified applications, but aluminum alloys are gaining momentum as porosity mitigation techniques mature. On the supply side, localized powder ecosystems in China and EU investments in niobium oxide and nitrogen atomization capacity underscore sovereignty imperatives that influence purchasing decisions as much as cost or performance.
Key Report Takeaways
Note: Market size and forecast figures in this report are generated using Mordor Intelligence's proprietary estimation framework, updated with the latest available data and insights as of 2026.
Drivers Impact Analysis
| Driver | (~) % Impact on CAGR Forecast | Geographic Relevance | Impact Timeline | |||
|---|---|---|---|---|---|---|
Government-funded hypersonics and space-launch metal AM programs in the United States Government-funded hypersonics and space-launch metal AM programs in the United States | +2.8% | North America, with spillover to allied nations | Medium term (2-4 years) | (~) % Impact on CAGR Forecast:+2.8% | Geographic Relevance:North America, with spillover to allied nations | Impact Timeline:Medium term (2-4 years) |
Acceleration of EU net-zero aviation demanding lightweight nickel and Ti parts Acceleration of EU net-zero aviation demanding lightweight nickel and Ti parts | +2.1% | Europe, with global aerospace supply-chain impact | Long term (≥4 years) | |||
German OEM qualification of 12-kW laser PBF lines, slashing per-part cost by 37% German OEM qualification of 12-kW laser PBF lines, slashing per-part cost by 37% | +1.9% | Europe, expanding to North America and Asia-Pacific | Short term (≤2 years) | |||
China's Made in 2025 subsidies creating localized powder suppliers for AM China's Made in 2025 subsidies creating localized powder suppliers for AM | +2.3% | Asia-Pacific core, with competitive pressure globally | Medium term (2-4 years) | |||
Surge in in-hospital point-of-care implants after FDA 510(k) guidance Surge in in-hospital point-of-care implants after FDA 510(k) guidance | +1.7% | Global, with early adoption in North America and Europe | Short term (≤2 years) | |||
Gulf Cooperation Council Countries sovereign funds backing oil-&-gas tooling centres adopting DED Gulf Cooperation Council Countries sovereign funds backing oil-&-gas tooling centres adopting DED | +1.4% | Middle East, with technology transfer to global energy sector | Medium term (2-4 years) | |||
| Source: Mordor Intelligence | ||||||
Government-funded hypersonics and space-launch metal AM programs
United States defense agencies awarded USD 8.7 million to Relativity Space to advance metal additive manufacturing for hypersonic and launch systems. Parallel funding in Australia, where AUD 8 million supports 3D-printed hypersonic drones, signals allied alignment on sovereign manufacturing capabilities. America Makes added USD 2.1 million in project calls focused on qualification and sustainability, underscoring the institutional push toward serial-production readiness. SpaceX’s Raptor 3 engine, produced with metal AM, offers a public demonstration of performance at scale Collectively, these programs accelerate technology adoption beyond prototypes, anchor domestic supply chains, and lift the overall metal 3D printing market growth trajectory.
EU net-zero aviation initiatives reshape lightweight component economics
The European Union’s Clean Sky 3 program mandates ultra-light nickel and titanium components to meet 2050 zero-emission targets, creating new demand curves for complex AM geometries. Earlier Clean Sky 2 projects cut part counts by 37% and manufacturing costs by 26%, setting quantifiable benchmarks that prime procurement pipelines. European aerospace suppliers now embed metal AM capability requirements in qualification checklists, raising entry barriers for conventional fabricators. Integration with hydrogen fuel-cell architectures further broadens the addressable opportunity set. As a result, the region’s policy environment cascades through global supply chains, supporting sustained expansion of the metal 3D printing market.
German OEM qualification of high-power laser systems triggers cost revolution
German original equipment manufacturers validated 12 kW multi-laser PBF platforms that delivered 37% part-cost reductions and 92% lead-time compression for partners such as Atlas Copco. The achievement resolves a long-standing cost hurdle that limited AM to low-volume runs. ASTM and EOS widened machine-operator certification programs to cover M 290 and M 400 series equipment, simplifying workforce qualification. Faster amortization drives broader capital-equipment uptake, reinforcing hardware dominance while catalyzing service-provider growth. The development positions PBF as a competitive method for medium-volume production, unlocking new layers of demand in the metal 3D printing market.
China’s Made in 2025 subsidies accelerate local powder supply chains
China’s industrial policy incentivizes domestic powder production, slashing reliance on foreign suppliers and lowering material costs. Formnext Asia Shenzhen 2025 logged a 68% year-over-year rise in materials exhibitors, reflecting the scale of state-backed expansion. Newly-qualified suppliers pressure global pricing structures, compelling Western vendors to differentiate on specialty alloys and service. The geographic rebalancing enhances supply resilience for Asia-Pacific users and supports the region’s 17.1% CAGR outlook. End-users worldwide gain leverage from diversified sourcing, reinforcing volume growth in the metal 3D printing market.
Restraints Impact Analysis
| Restraint | (~) % Impact on CAGR Forecast | Geographic Relevance | Impact Timeline | |||
|---|---|---|---|---|---|---|
Persistent porosity issues in high-strength Al-Sc alloys delaying serial production Persistent porosity issues in high-strength Al-Sc alloys delaying serial production | -1.80% | Global, with particular impact on aerospace applications | Medium term (2-4 years) | (~) % Impact on CAGR Forecast:-1.80% | Geographic Relevance:Global, with particular impact on aerospace applications | Impact Timeline:Medium term (2-4 years) |
Shortfall of AM-grade nitrogen atomized powder capacity outside Europe Shortfall of AM-grade nitrogen atomized powder capacity outside Europe | -1.30% | North America and Asia-Pacific primarily | Short term (≤2 years) | |||
Lack of ASTM-certified in-process monitoring protocols for multi-laser PBF Lack of ASTM-certified in-process monitoring protocols for multi-laser PBF | -0.90% | Global, affecting industrial adoption | Medium term (2-4 years) | |||
Rising industrial electricity tariffs in Japan eroding desktop metal printer ROI Rising industrial electricity tariffs in Japan eroding desktop metal printer ROI | -0.70% | Japan, with potential expansion to other high-cost regions | Short term (≤2 years) | |||
| Source: Mordor Intelligence | ||||||
Persistent porosity issues in high-strength Al-Sc alloys constrain aerospace applications
Scalmalloy studies show keyhole pores emerge at energy densities above 0.75 J/mm, preventing serial aerospace adoption despite Ra < 7 µm surface finishes.[3]Michael Seidel, “Influence of contour scans on pore formation in Scalmalloy®,” onlinelibrary.wiley.com Laser metal deposition produces coarser microstructures but similar porosity risks, indicating a fundamental materials challenge. Until alternative alloys or process breakthroughs arise, high-performance aluminum parts remain confined to prototypes, trimming near-term volume potential for this material class within the metal 3D printing market.
Shortfall of AM-grade nitrogen atomized powder capacity outside Europe creates supply bottlenecks
European concentration of nitrogen atomizers, highlighted by ArcelorMittal’s 1,000-tonne unit in Spain, limits rapid scaling for North American and Asia-Pacific projects. Lead-time uncertainty forces higher inventories, diluting one of AM’s chief benefits-on-demand production flexibility. New entrants such as UniMelt plasma systems aim to bridge the gap, yet near-term constraints still temper growth trajectories for powder-intensive verticals in the metal 3D printing market.
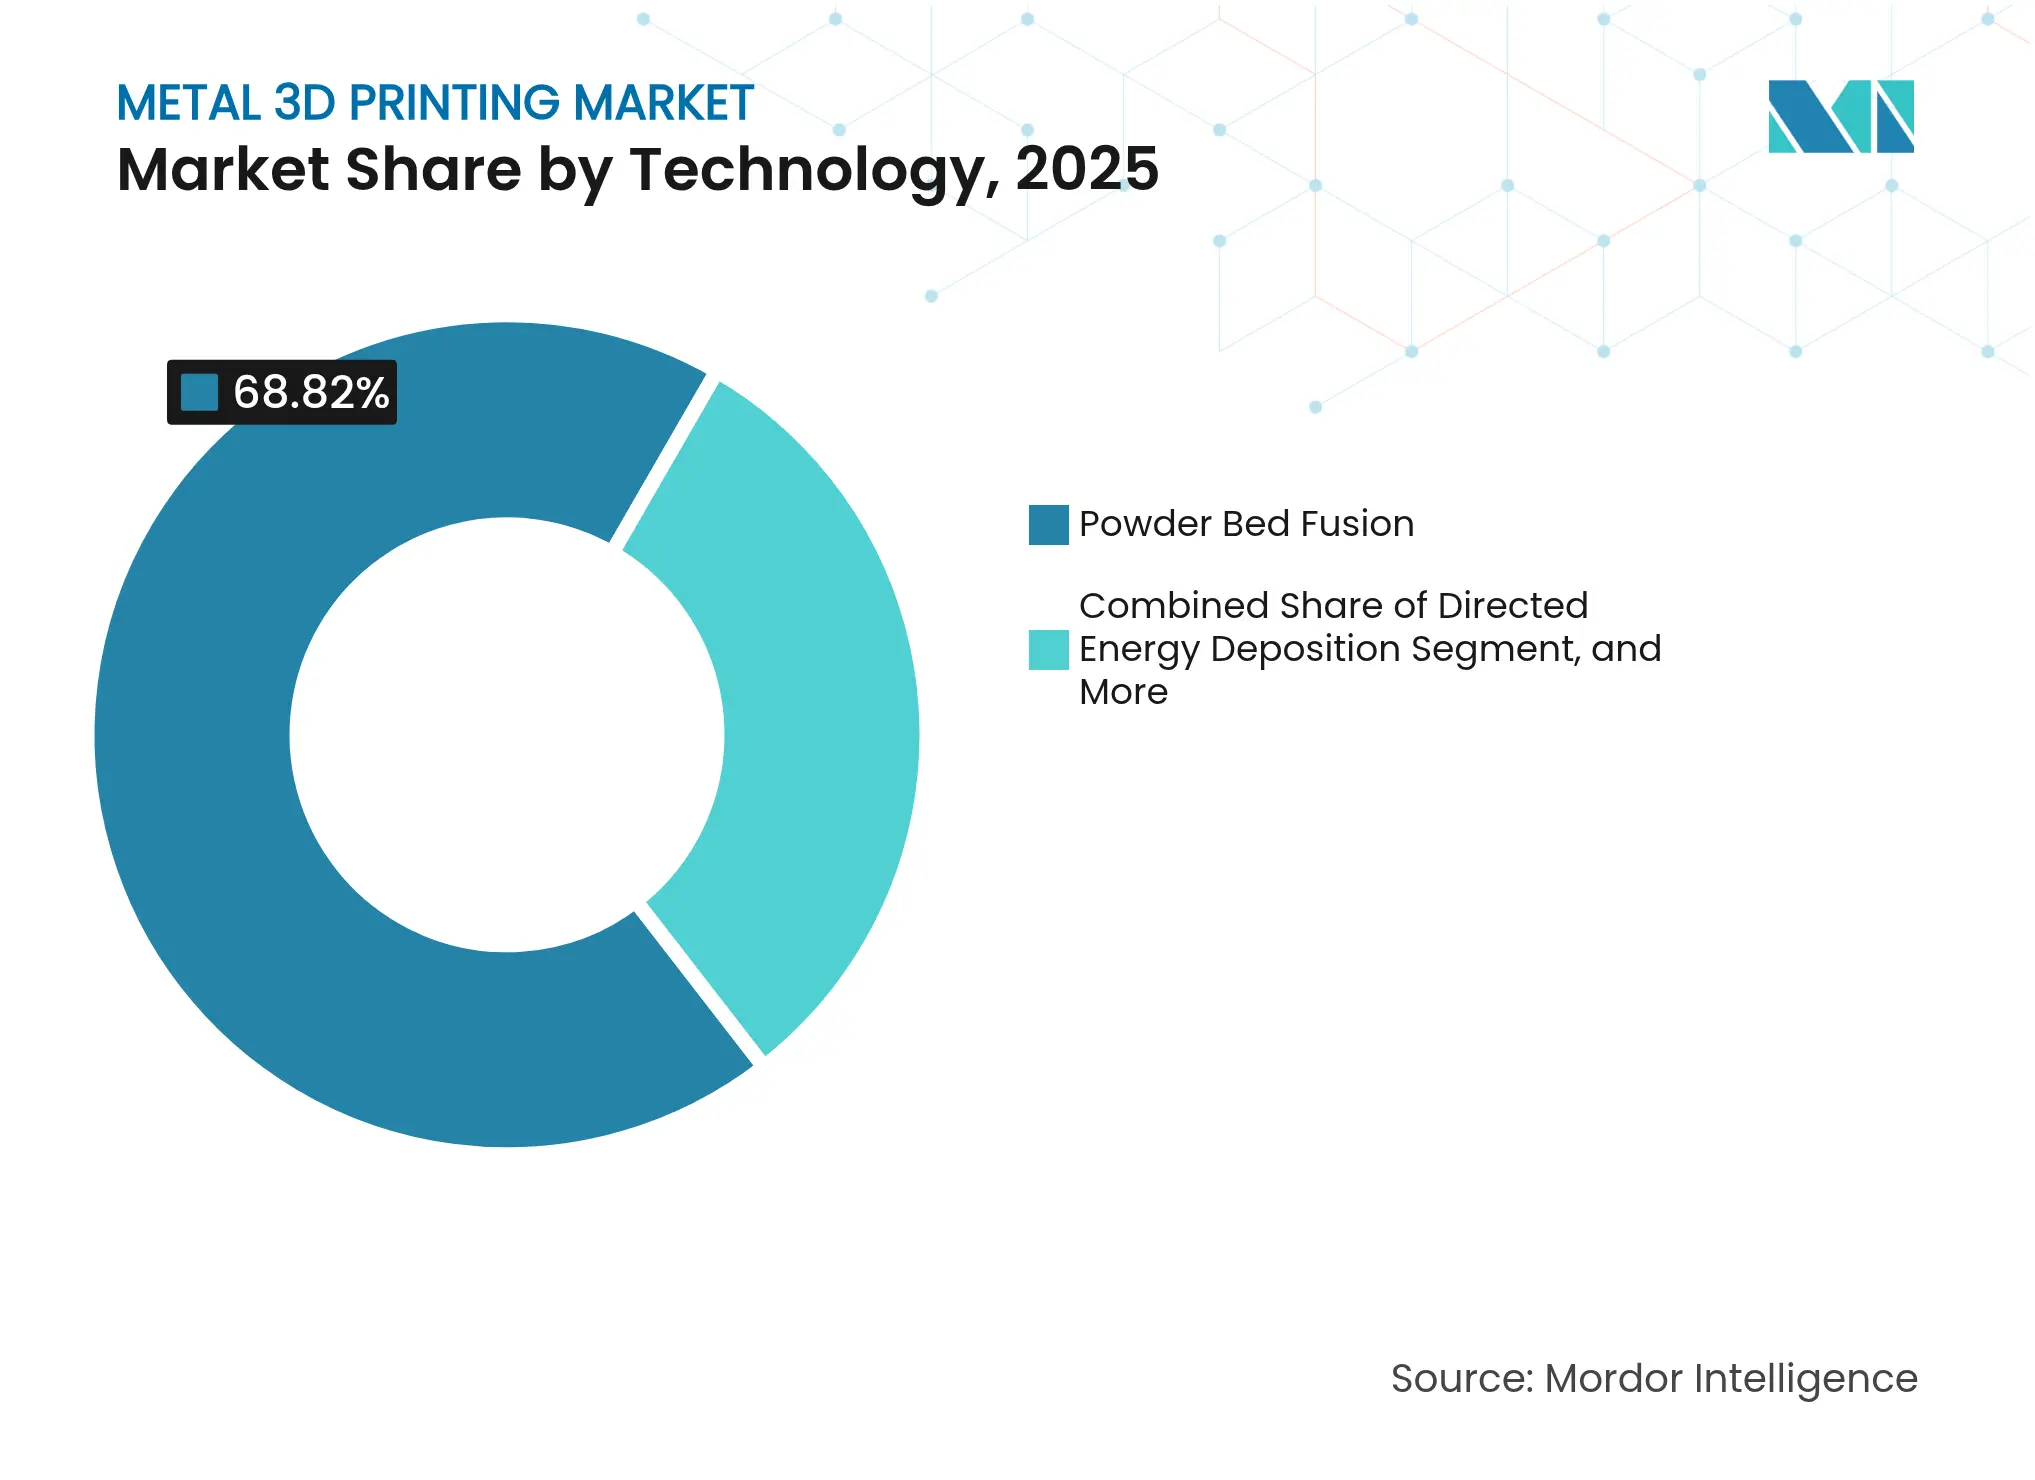
By Technology: Powder Bed Fusion Retains Primacy While Directed Energy Deposition Accelerates
Powder bed fusion accounted for 68.82% of 2025 revenue, anchoring the metal 3D printing market. High resolution, established qualification pathways, and multi-laser scalability sustain its leadership. The segment’s 12 kW breakthroughs cut costs by 37%, nudging PBF toward parity with machining for medium-volume parts. Directed energy deposition’s 18.05% CAGR underscores expanding repair and large-format build demand. DED bridges format gaps PBF cannot address economically, especially in turbine repair where component value offsets process complexity. Binder jetting gains traction as vendors demonstrate cycle times suited to automotive casting replacements, hinting at future disruption. Niche processes-cold spray, electron-beam melting, bound-metal extrusion-fill material-specific or geometry-specific roles, adding diversity without eroding PBF’s core advantages. The technology mix shows that adoption decisions hinge on part size, alloy, and throughput economics rather than brand allegiance. Continued R&D in process monitoring and closed-loop control will define share shifts beyond 2030.
Powder bed fusion’s cost curves foster service-provider ecosystems that package design, print, and post-process capacity under outcome-based contracts. Conversely, DED system integrators align with heavy-industry maintenance networks, commercializing high-deposition heads for shipyard and oil-rig repairs. As these domains mature, multi-technology cell layouts will emerge, letting plants assign each job to the most economical process. Such configuration flexibility becomes a competitive differentiator, reinforcing hardware sales yet elevating software orchestration importance. Both trends point to sustained volume growth across the metal 3D printing market.
Note: Segment shares of all individual segments available upon report purchase
By Component: Hardware Dominance Meets Services Upswing
Hardware represented 80.12% of 2025 spending in the metal 3D printing market size yet faces decelerating growth as installed bases thicken. Early adopters shift budgets toward process optimization, quality assurance, and certified post-processing. Service revenues, projected to expand at 18.78% CAGR, reflect this pivot to outcome-driven engagements. Enterprises with capital-intensive fleets increasingly monetize excess capacity by offering contract manufacturing, blurring lines between OEM and bureau models.
Software packages evolve from build-prep tools into AI-enabled quality guardians. Adaptive scan strategies and melt-pool analytics reduce scrap rates, improving payback timelines. Integration of MES systems allows real-time costing and scheduling transparency, essential for industrial clients that must validate part pedigrees. These developments bolster recurring revenue streams and attract venture funding despite hardware market saturation. Together, improved service depth and software intelligence compress time-to-qualification for new alloys, drawing additional verticals into the metal 3D printing market.
By Printer Type: Industrial Systems Maintain Control Yet Desktop Adoption Broadens
Industrial printers, priced above USD 1 million and shipping with multi-laser arrays, controlled 89.62% of revenue in 2025, safeguarding aerospace and medical qualification pathways. Production-scale builds, tight atmospherics, and validated safety infrastructure keep regulated customers anchored to this class. Desktop and benchtop units advance at a 15.62% CAGR, extending metal AM to small fabricators, universities, and R&D hubs. Improved inert-gas management and cartridge-based powders mitigate operator hazards, supporting decentralized experimentation.
Desktop platforms now integrate cloud-based calibration routines that replicate industrial-grade accuracy, shrinking the performance gap. Conversely, flagship industrial systems iterate toward simplified UX via automated powder handling and self-diagnostics, blurring class distinctions. Although electricity-price volatility challenges operating economics in high-cost regions, faster sintering cycles and lower standby loads offset much of the tariff impact. Over time, educational exposure from benchtop systems should cultivate a larger workforce that will later specify industrial equipment, supporting virtuous demand loops within the metal 3D printing market.

Recognized by Experts. Trusted by Leaders.
A trusted intelligence partner to global decision-makers across 90+ countries.


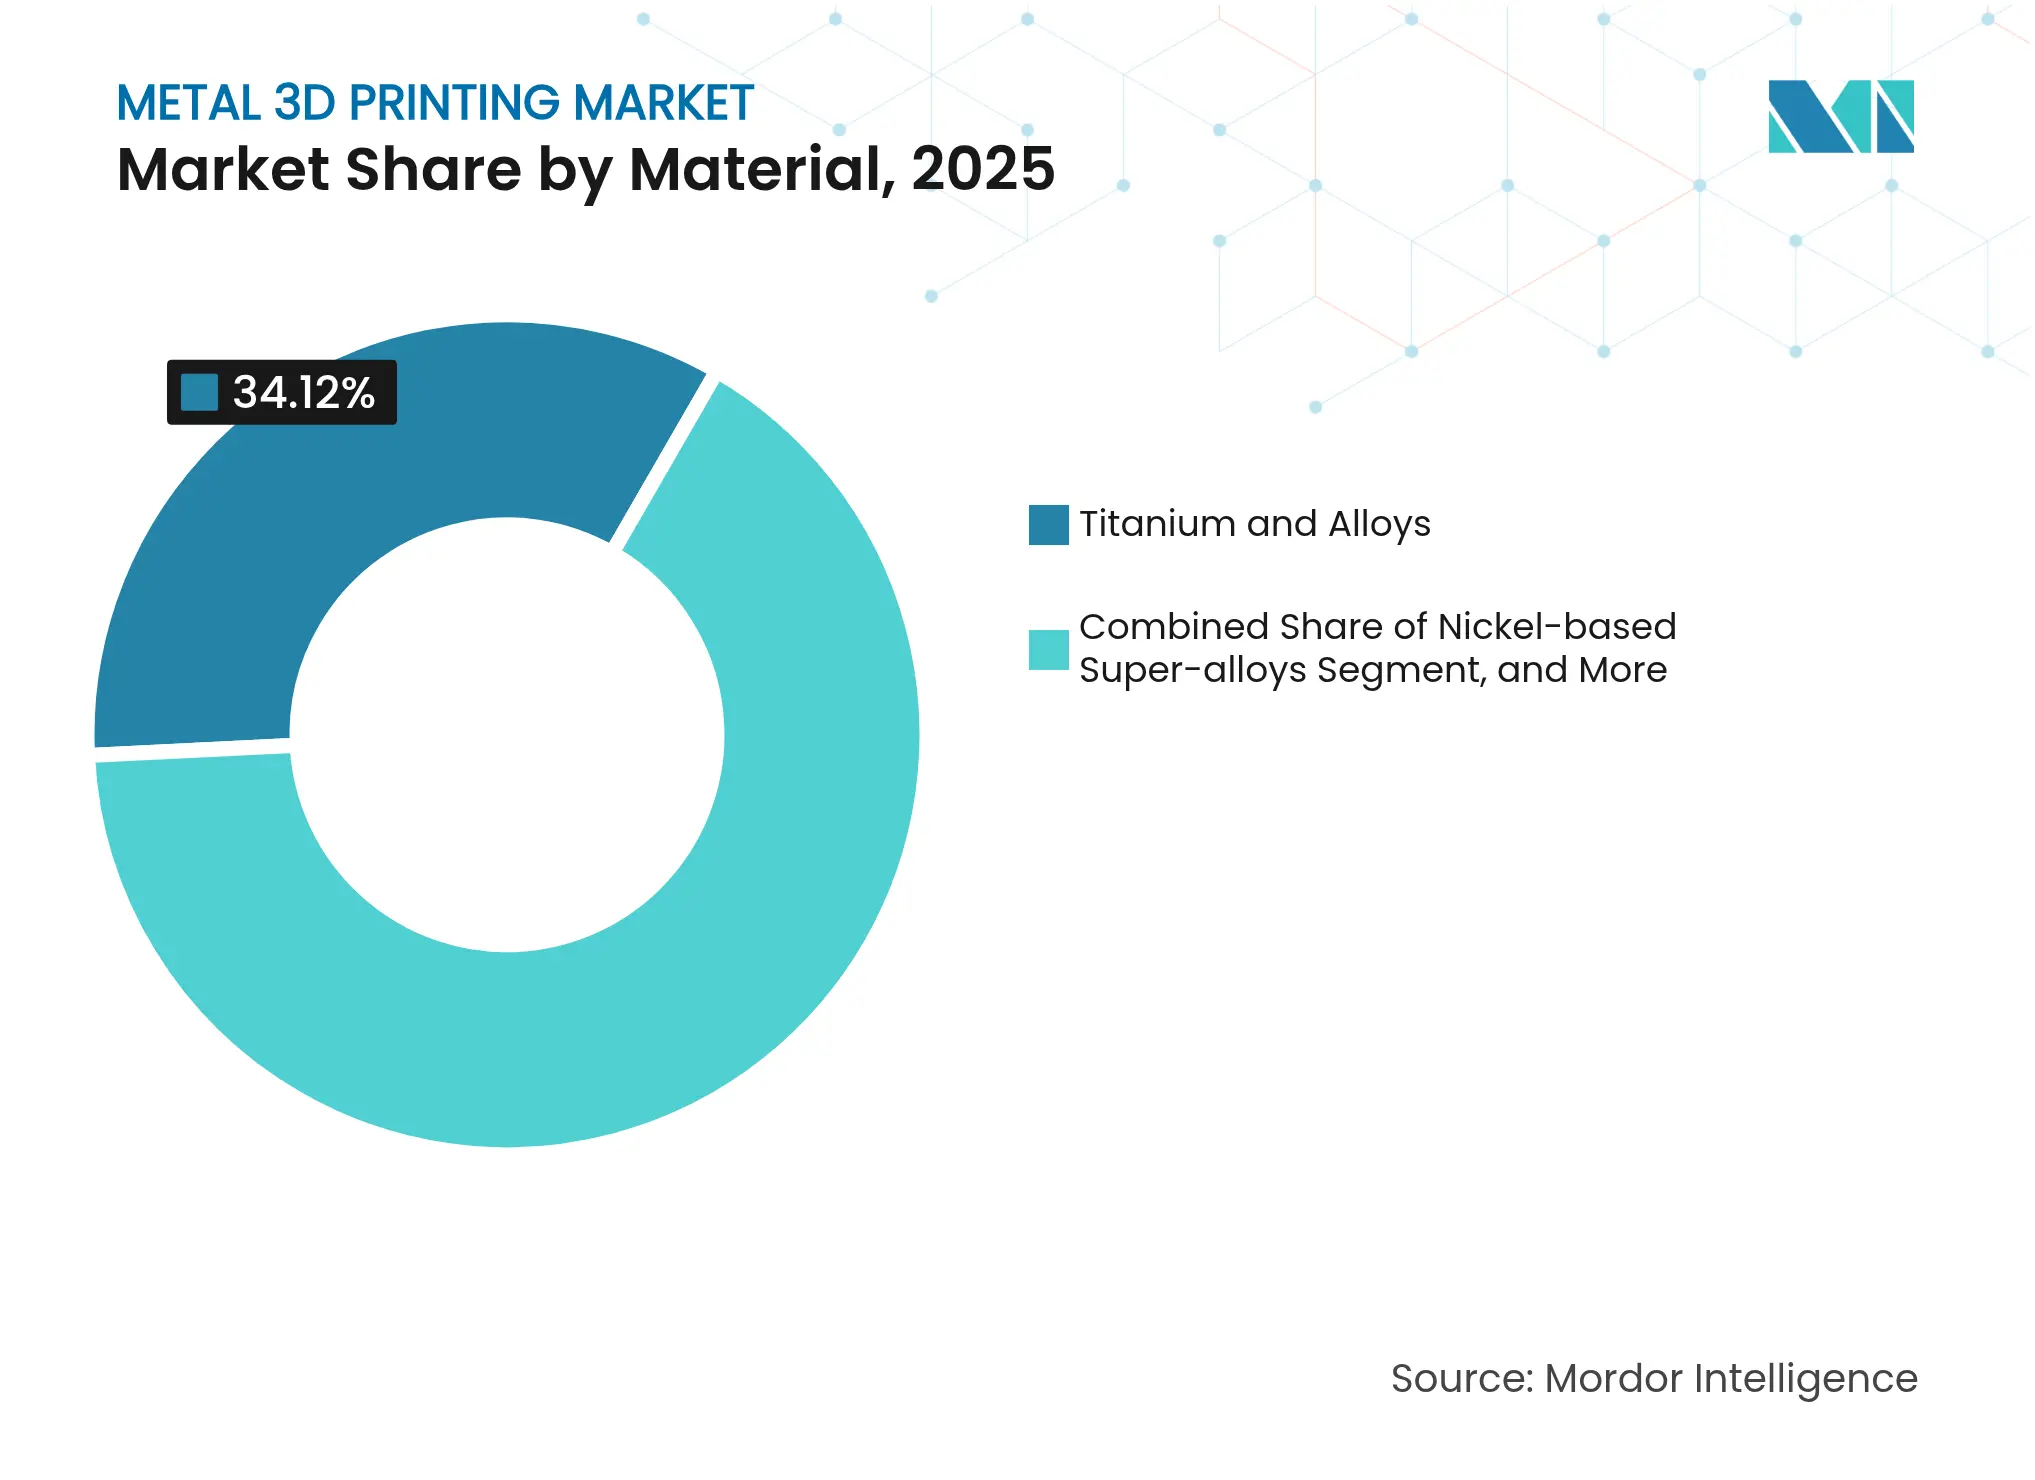
By Material: Titanium Leadership Faces Fast-Rising Aluminum Alloys
Titanium alloys held 34.12% of 2025 revenue owing to aerospace engine, airframe, and spinal-implant demand. Biocompatibility and fatigue performance underpin its premium positioning despite elevated powder costs. Aluminum alloys, expanding at a 16.95% CAGR, benefit from lightweighting regulations and recent porosity-control advances such as nanoparticle inoculation that delivers 251 MPa tensile strength in modified 2024 compositions mdpi.com. Cost-pressured automotive and consumer-electronics OEMs increasingly specify aluminum over magnesium or plastics when thermal and structural loads converge.
Nickel-based superalloys remain indispensable for hot-section turbines and hydrogen combustors, while stainless steels dominate tooling and end-of-arm robotics fixtures. Cobalt-chrome alloys continue to anchor dental and orthopedic implants, though cobalt price volatility spurs research into alternative Co-free formulations. Precious metals occupy jewelry and high-frequency electronics niches, leveraging AM’s design latitude to cut wastage. Advanced atomization and alloy-development pipelines will keep material diversity high, broadening the metal 3D printing market addressable base.
Note: Segment shares of all individual segments available upon report purchase
By End User: Aerospace Dominance Meets Healthcare Momentum
Aerospace and defense applications captured 33.15% revenue in 2025, with supply-chain sovereignty and weight-savings overriding cost premiums. Flight-critical part qualification, though rigorous, now leverages standardized test protocols, accelerating part-family approvals. Healthcare follows with a 20.05% CAGR outlook. Revised FDA technical considerations formalize process validation steps, enabling hospitals to print patient-specific orthopedic and cranial implants on-site. Personalized care shortens surgical lead times and reduces inventory of modular implant sets.
Automotive use cases proliferate as hybrid-powertrain cooling plates and motorsport intake systems leverage lattice designs unavailable via casting. Oil-and-gas service companies adopt directed-energy deposition to refurbish drilling tools, supported by Gulf Cooperation Council funding streams. Electronics, industrial machinery, and construction sectors pilot structural connectors and heat exchangers, collectively diversifying demand and lowering cyclical exposure for suppliers in the metal 3D printing market.
North America retained 37.02% metal 3D printing market share in 2025, sustained by USD 8.7 million DoD grants to Relativity Space and GE Aerospace’s USD 1 billion additive manufacturing facility expansion. FAA- and NASA-funded acquisitions, such as NIAR’s Velo3D Sapphire 1MZ, bolster domestic qualification capacity. The region also benefits from early integration of defense and healthcare demand, though powder supply concentration in Europe poses strategic vulnerabilities.
Asia-Pacific grows fastest at 16.82% CAGR, propelled by China’s subsidies and India’s space-program partnerships. Materials exhibitors at Formnext Asia Shenzhen 2025 grew 68%, emphasizing the region’s role in scaling the metal 3D printing market. EOS’s collaboration with Godrej integrates multi-laser systems into India’s aerospace supply chains, while Japanese OEMs refine large-format PBF for automotive platforms. As regional suppliers achieve quality certifications, competitive pricing reshapes global sourcing strategies.
Europe commands technology leadership, underpinned by Clean Sky 3 and robust powder metallurgy clusters. German OEM qualification of 12 kW systems leads cost-down trajectories, and EU targets for zero-emission aviation embed AM into future aircraft architectures. However, elevated power costs necessitate efficiency gains to sustain margins. The Middle East deploys directed-energy deposition in oil-field tooling centers funded by sovereign wealth vehicles, while South America’s opportunities emerge as aerospace tier-ones localize spares manufacturing. Collectively, geographic diversification buffers the metal 3D printing market against localized macro shocks.
Market Concentration
The market shows moderate concentration, with a cadre of incumbent OEMs-EOS, GE Additive, SLM-Nikon, Velo3D-guarding share through patent portfolios and installed bases. Nano Dimension’s USD 135 million acquisition of Desktop Metal in April 2025 created a vertically integrated platform spanning electronics and metals, signaling a consolidation rationale based on cross-material synergies. Strategic partnerships rather than outright purchases dominate subsequent moves; EOS aligned with Godrej to penetrate India’s space vertical and joined Volkmann to automate powder handling.
Emerging challengers focus on niche differentiation: Freeform leverages NVIDIA-backed AI for autonomous cell operation, while Meltio advances wire-laser deposition for mid-build envelopes at lower capex. Powder specialists Equispheres and Continuum expand capacity and partner with Renishaw to assure supply continuity and alloy innovation. Competitive advantage now hinges on integrated hardware-software-service offerings, robust material libraries, and the capacity to meet rigorous end-market qualification schemes. As users consolidate vendor lists to mitigate qualification overhead, suppliers capable of turnkey delivery should gain incremental metal 3D printing market share.

*Disclaimer: Major Players sorted in no particular order
1. INTRODUCTION
2. RESEARCH METHODOLOGY
3. EXECUTIVE SUMMARY
4. MARKET LANDSCAPE
5. MARKET SIZE AND GROWTH FORECASTS (VALUES)
6. COMPETITIVE LANDSCAPE
7. MARKET OPPORTUNITIES AND FUTURE OUTLOOK
Metal 3D printing merges the design versatility of 3D printing with the robust characteristics of high-performance metal alloys. This fusion enables the production of unique, strong, and lightweight components, catering even to the most intricate applications. It's particularly suited for crafting fully functional prototypes and end-use parts, many defying conventional manufacturing methods. Metal 3D printing enables the production of elaborate, customized parts, achieving geometries that traditional manufacturing methods cannot. These 3D-printed metal components can be topologically optimized, enhancing performance while reducing weight and minimizing the total number of parts in an assembly.
The study tracks the revenue accrued through the sale of metal 3D printing printers types by various players globally. The study also tracks the key market parameters, underlying growth influencers, and major vendors operating in the industry, which supports the market estimations and growth rates over the forecast period. The study further analyses the overall impact of COVID-19 aftereffects and other macroeconomic factors on the market. The report's scope encompasses market sizing and forecasts for the various market segments.
The metal 3D printing market is segmented by technology (selective laser sintering (SLS), electron beam melting, fused deposition modeling (FDM), stereo lithography (SLA), digital light processing, and other technologies), component (hardware, software, and services), type of printer (industrial, and desktop), end-user industry (automotive, aerospace and defense, healthcare, construction and architecture, electronics and electro-mechanics, and other end-user industries), and geography (North America, Europe, Asia-Pacific, Latin America, and Middle East and Africa). The market sizes and forecasts are provided in terms of value (USD) for all the above segments.
Pricing Strategy for Semiconductor Components
3 Min Read
Accelerating Additive Manufacturing Adoption in India
3 Min Read
Unlocking Growth in India’s Luxury Beauty & Skincare Market
3 Min Read
When decisions matter, industry leaders turn to our analysts. Let’s talk.