3D Metrology Market Size and Share
Market Overview
| Study Period | 2021 - 2031 |
|---|---|
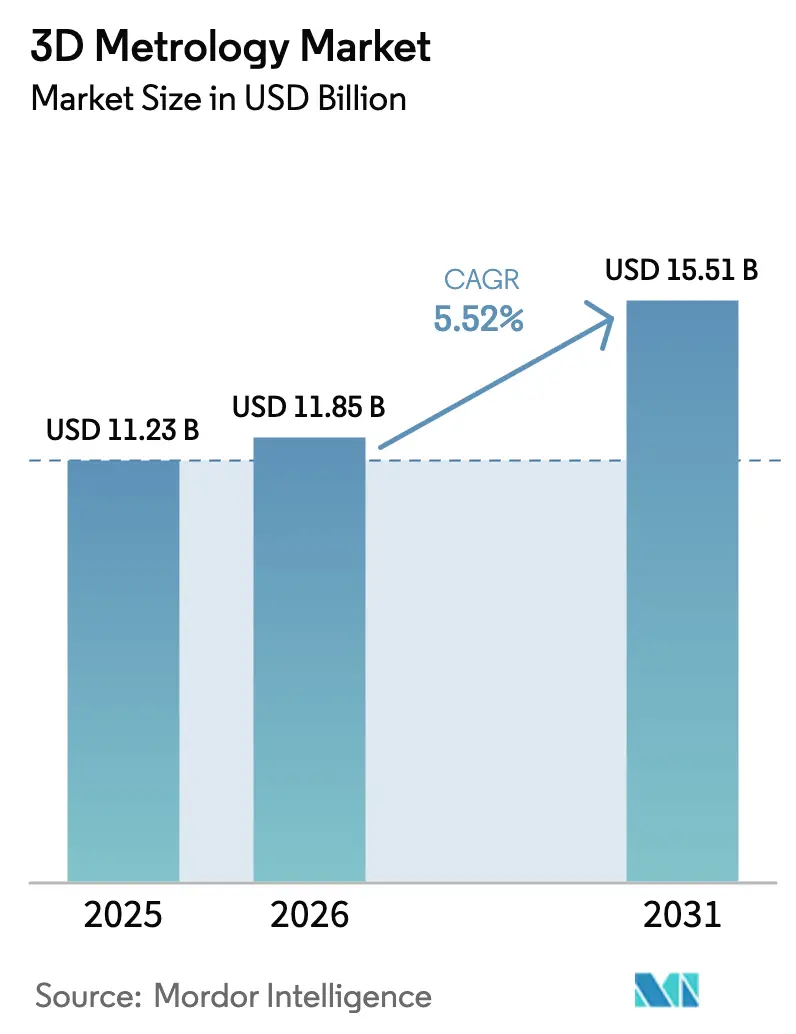
| Market Size (2026) | USD 11.85 Billion |
| Market Size (2031) | USD 15.51 Billion |
| Growth Rate (2026 - 2031) | 5.52% CAGR |
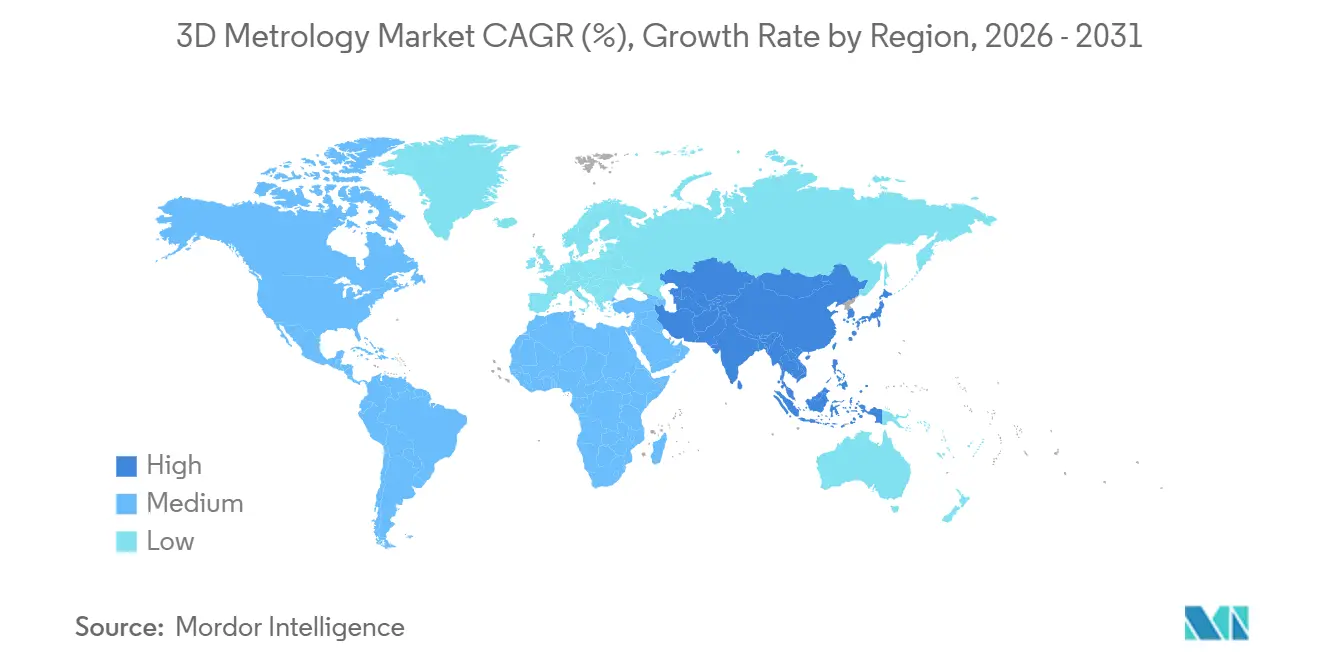
| Fastest Growing Market | Asia Pacific |
| Largest Market | Asia Pacific |
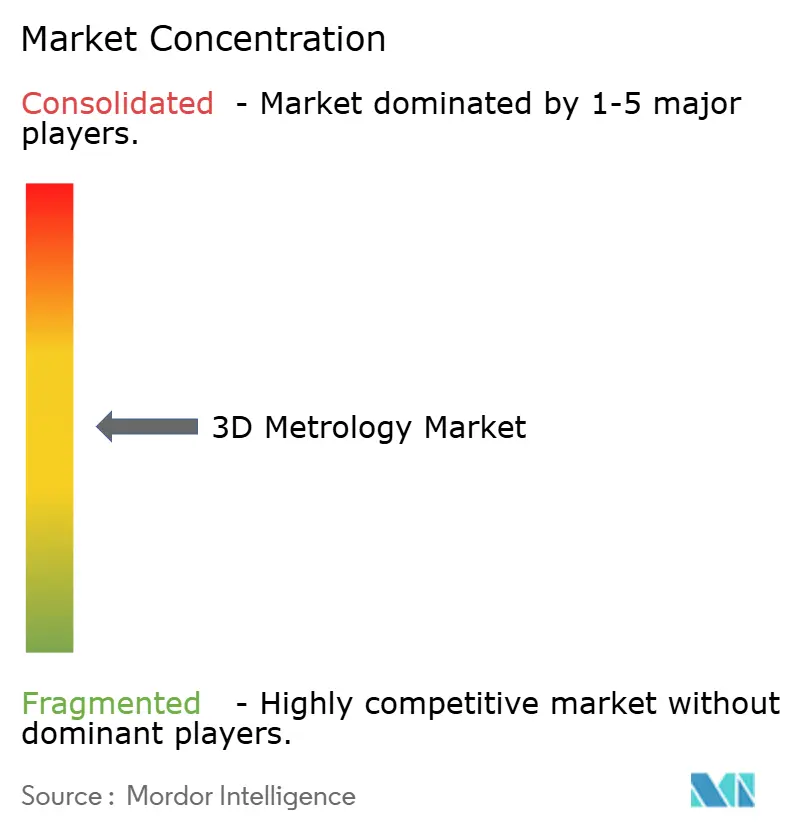
| Market Concentration | Medium |
Major Players *Disclaimer: Major Players sorted in no particular order Image © Mordor Intelligence. Reuse requires attribution under CC BY 4.0. | |
3D Metrology Market Analysis by Mordor Intelligence
The 3D metrology market size is expected to grow from USD 11.23 billion in 2025 to USD 11.85 billion in 2026 and is forecast to reach USD 15.51 billion by 2031 at 5.52% CAGR over 2026-2031. Growth is being driven by tighter quality requirements in automotive, aerospace, and medical manufacturing, coupled with the shift toward data-rich, connected production lines that rely on precise dimensional feedback. Inline inspection systems are replacing post-process sampling, shortening lead times and lowering scrap. Adoption is spreading fastest where governments subsidize smart manufacturing rollouts, most notably in China, South Korea, and the United States. Competitive intensity is rising as traditional coordinate-measuring machine (CMM) leaders expand into optical and X-ray platforms while software specialists add AI to automate defect detection.
Key Report Takeaways
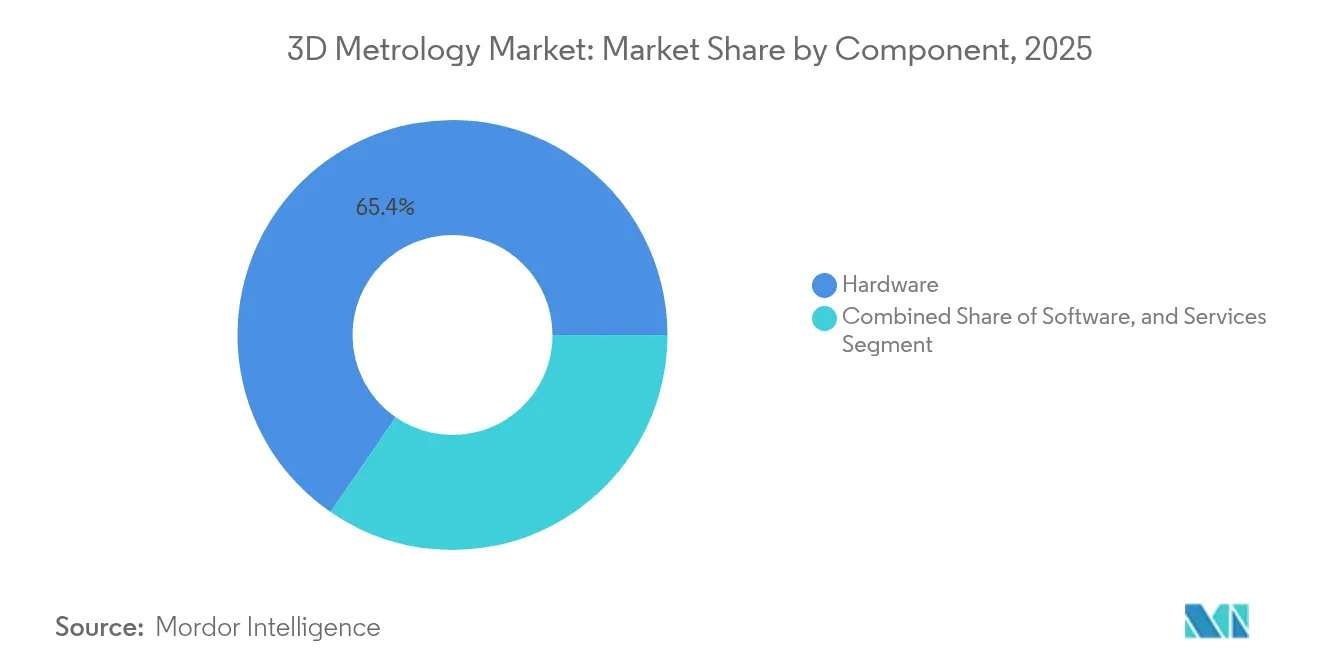
- By component, hardware held 65.40% of 3D metrology market share in 2025, whereas services are forecast to grow at an 8.31% CAGR through 2031.
- By hardware type, CMMs led with 37.65% revenue in 2025; laser scanners are set to advance at a 6.18% CAGR to 2031.
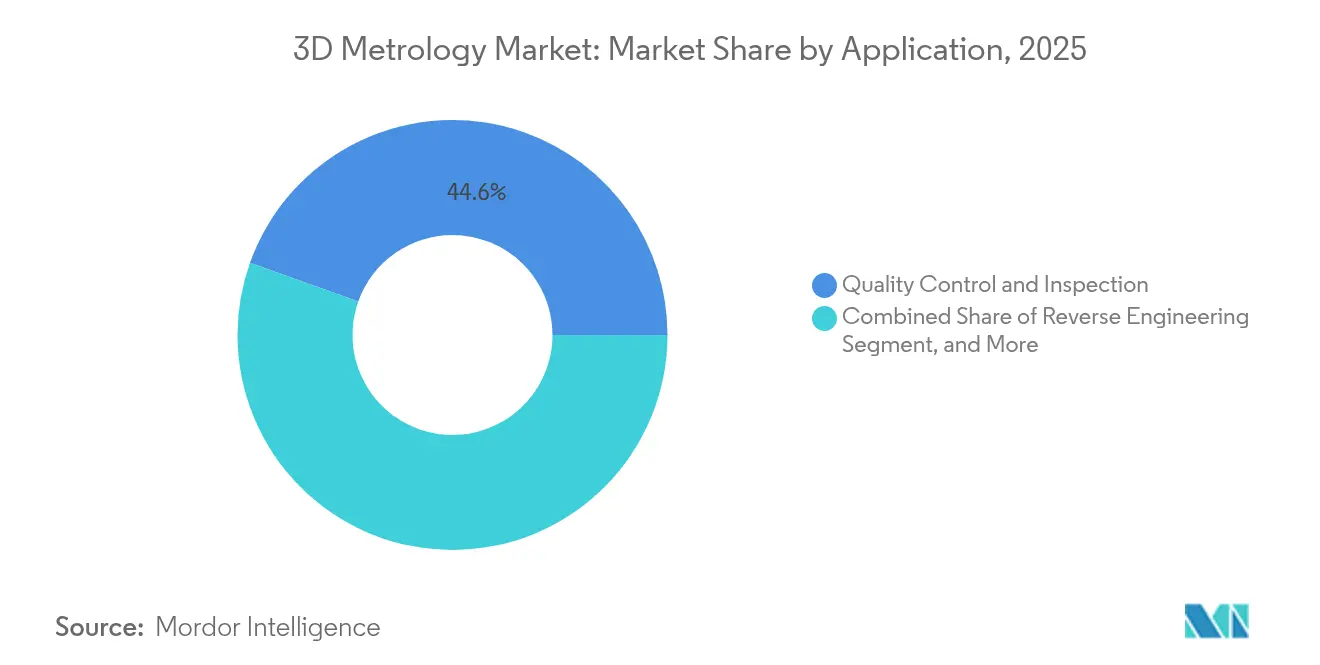
- By application, quality control & inspection captured 44.55% of the 3D metrology market size in 2025; reverse engineering is projected to expand at a 5.86% CAGR.
- By end-user industry, automotive accounted for 29.55% of revenue in 2025, while medical & dental is the fastest-growing segment at a 6.62% CAGR.
- By geography, Asia Pacific contributed 51.60% of global sales in 2025 and is tracking a 5.55% CAGR for 2026-2031.
Note: Market size and forecast figures in this report are generated using Mordor Intelligence’s proprietary estimation framework, updated with the latest available data and insights as of 2026.
Market Trends and Insights
Drivers Impact Analysis of 3D Metrology Market*
| Driver | (~) % Impact on CAGR Forecast | Geographic Relevance | Impact Timeline |
|---|---|---|---|
| Inline metrology for EV battery gigafactories | +1.2% | North America; spillover to Europe | Medium term (2-4 years) |
| Aerospace OEM validation of additive parts | +0.9% | Europe; North America | Short term (≤ 2 years) |
| Custom medical implant manufacturing surge | +1.0% | China, Japan, South Korea | Medium term (2-4 years) |
| Subsidies for smart manufacturing | +0.7% | China; South Korea | Medium term (2-4 years) |
| Shift to lightweight composites in auto lines | +0.6% | Europe; North America | Long term (≥ 4 years) |
| Digital-twin integration for wind-blade testing | +0.5% | Nordic countries | Long term (≥ 4 years) |
| Source: Mordor Intelligence | |||
Adoption of Inline Metrology for EV Battery Gigafactories
Real-time dimensional checks are becoming standard in lithium-ion battery plants as automakers race to scale electric-vehicle output. Government incentives in the United States and Canada have accelerated gigafactory construction, creating demand for high-throughput X-ray computed-tomography systems that uncover internal weld defects without destroying cells.[1]FARO Technologies Investor Relations, “Financial Releases,” faro.com Line-integrated scanners are improving yield, supporting new chemistries, and reducing warranty risk. Suppliers are embedding analytics that link measurement data to digital twins of the battery pack, allowing engineers to predict thermal runaway before shipment. As the North American supply chain regionalizes, similar technology is migrating to European facilities under the EU Battery Regulation. The result is a structural tailwind lifting capital spending on optical, laser, and X-ray metrology across cell, module, and pack assembly halls.
Aerospace OEM Mandates for Additive Manufacturing Validation
Major airframe builders now require dimensional proof of every additively manufactured (AM) structural part before first flight. The Federal Aviation Administration’s joint program with the U.S. Air Force is finalizing uniform inspection guidelines that depend on high-resolution laser scanners and industrial CT to verify internal lattices that traditional gauges cannot reach.[2]FAA-Air Force AM Workshop Proceedings, rosap.ntl.bts.gov Portable blue-light scanners are proving accurate for selective-laser-melted titanium components, enabling rapid on-site checks during aircraft overhauls.[3]Sara Giganto et al., “Analysis of Modern Optical Inspection Systems,” mdpi.com European primes have already expanded QC labs to comply, opening opportunity for solution providers offering combined hardware, software, and training packages. The mandate is cascading to tier-2 suppliers, who are adding cloud-based analytics-even as cyber-rules in defense constrain remote data hosting-to secure new contracts.
Surge in Medical Implant Custom Manufacturing
Personalized orthopedic, spinal, and dental implants are gaining market acceptance, thanks to AM metals with superior biocompatibility and geometry freedom.[4]Yuhua Li et al., “Revolutionizing Medical Implant Fabrication,” eurekalert.org Each implant’s fit depends on sub-micron scanning of patient anatomy and finished part geometry. Clinics in Japan, South Korea, and China are deploying benchtop structured-light scanners inside surgical planning suites, linking 3D metrology results to CAD/CAM printers. University studies show print orientation materially changes surgical-guide accuracy, making post-print inspection mandatory before sterilization. As reimbursement codes adapt, hospitals increasingly outsource measurement to accredited service bureaus, reinforcing the services growth theme.
Government Subsidies for Smart Manufacturing
China’s 14th Five-Year Plan and South Korea’s K-Smart Factory initiative reimburse up to 50% of capital outlays for automation equipment, and 3D metrology ranks high on eligible lists. Large manufacturers captured most subsidies, growing assets and employment, while small firms struggle with upfront costs. Grants favor systems with Industrial Internet of Things connectivity, accelerating demand for networkable scanners and CMMs. Academic surveys underline executive commitment and skilled labor as key success factors in rollouts. Policy support therefore raises baseline equipment turnover and services income, especially in electronics, semiconductor, and precision-machinery plants.
Restraints Impact Analysis of 3D Metrology Market*
| Restraint | (~) % Impact on CAGR Forecast | Geographic Relevance | Impact Timeline |
|---|---|---|---|
| Shortage of ISO 17025-compliant calibration labs | –0.6% | Sub-Saharan Africa | Long term (≥ 4 years) |
| High total cost of ownership of multi-sensor CMMs for SMBs | –0.9% | Emerging markets | Medium term (2-4 years) |
| Data-security concerns in cloud metrology for defense | –0.7% | North America; Europe | Short term (≤ 2 years) |
| Complexity of AS9100 documentation for tier-2 suppliers | –0.5% | Emerging aerospace hubs | Medium term (2-4 years) |
| Source: Mordor Intelligence | |||
Shortage of ISO 17025-Compliant Calibration Labs
Africa fields fewer than 1 calibration lab per 10 million inhabitants, limiting the regional uptake of high-precision instruments that require annual traceability checks. Despite SADCAS accrediting 300 facilities across 13 member states, capacity still trails demand. Studies pin success on leadership commitment, funding, and skilled staff. Lacking accreditation, many firms ship probes to Europe or Asia, extending downtime by 6-8 weeks. Governments aim to close the gap through Quality Infrastructure for Sustainable Development programs, but progress is slow, curbing sales of top-end systems.
Data-Security Concerns Hindering Cloud-based Metrology Analytics in Defense
Defense primes handle classified geometries that cannot leave secure networks. Although the U.S. Department of Defense champions data analytics, cultural resistance to cloud sharing persists. Multi-tier trust models now let owners choose sanitization levels, but adoption remains cautious. Start-ups offering AI defect detection must certify on-premise deployments, inflating costs and lengthening sales cycles. European defense firms face similar constraints under GDPR and national security laws. Until zero-trust architectures mature, cloud analytics will grow slower than predicted, tempering the sector’s overall spend.
*Our forecasts treat driver/restraint impacts as directional, not additive. The impact forecasts reflect baseline growth, mix effects, and variable interactions.
3D Metrology Market Segment Analysis
By Component:
Services Outpace Hardware GrowthThe hardware segment commanded 65.40% revenue in 2025, underscoring the need for physical scanners, CMMs, and X-ray systems on shop floors. Yet services are forecast to compound at 8.31% through 2031, outpacing equipment sales as manufacturers buy turnkey solutions covering installation, calibration, and analytics. Rising process complexity in aerospace, medical, and EV battery lines pushes firms to outsource metrology know-how. Vendors now bundle subscription-based software with maintenance agreements, creating recurring cash flows that were scarce in pure hardware models. Hexagon’s Manufacturing Intelligence unit, for instance, positions data services as the bridge between design and production to boost uptime and sustainability.
As customers demand outcome-based contracts, suppliers invest in remote-monitoring portals that flag tool wear or fixture drift, then dispatch field engineers before failures occur. This managed-services logic mirrors trends seen in automation and robotics. Because accreditation and application expertise are vital, global players leverage their ISO 17025 labs to lock in long-term clients. In emerging economies where technical talent is scarce, the services premium is even higher, further tilting growth away from one-time equipment deals. The transition widens entry barriers for new hardware-only entrants but opens niches for specialized service boutiques focused on niche verticals within the 3D metrology industry.


By Hardware Type:
CMMs Maintain Dominance While Laser Scanners SurgeCMMs retained a 37.65% share in 2025 thanks to sub-micron repeatability and established ISO 10360 standards. Bridge-type models handle engine blocks, while gantry versions cover aerospace structures. However, laser scanners are growing 6.18% annually as production lines favor rapid, non-contact capture of complex free-form shapes. Portable handheld units now deliver accuracy once limited to fixed-bed machines, broadening deployment beyond QC labs. Optical structured-light scanners serve painted or shiny surfaces without powdering, reducing prep time. Multi-sensor machines that fuse tactile and optical probes arrive to serve hybrid tasks, offering flexibility in a single footprint.
Research finds handheld laser-triangulation and blue-light systems provide the best accuracy for selective-laser-melted parts, a key edge in additive manufacturing. Market leaders integrate photogrammetry targets to extend working volumes for ship hulls or wind blades. Falling diode costs and faster GPUs support real-time point-cloud creation, spurring interest across the 3D metrology market for inline robotic scanning cells. Vendors emphasize ruggedness against shop-floor vibration and thermal drift, while software upgrades add AI filtering to suppress noise. These advances close the gap between optical and tactile accuracy, encouraging users to slide more inspections to upstream processes.
By Application:
Quality Control Leads While Reverse Engineering AcceleratesQuality control and inspection represented 44.55% of revenue in 2025, reflecting universal regulatory and warranty demands. Automakers deploy inline gauges that track 100% of weld studs, eliminating sampling errors. Aerospace producers rely on multi-sensor CMMs to certify turbine-disk geometry before engine assembly. Reverse engineering, at a 5.86% CAGR, is growing as legacy equipment ages and suppliers need digital twins for spare parts. The U.S. Air Force demonstrated rapid reverse engineering at its Advanced Manufacturing Olympics, where teams scanned, modeled, and reproduced a metal fitting in under 72 hours, a template now carried into depot maintenance.
Simulation and digital-twin workflows gain traction as operators align scanned data with finite-element models to forecast fatigue in wind blades. In additive manufacturing validation, optical and CT inspections prove vital for detecting porosity and dimensional drift layer-by-layer. Alignment and assembly also remain staple uses, especially in heavy industry where positional tolerances govern robot programming. The expansion into medical dentistry, heritage preservation, and construction verification further diversifies demand, confirming the versatility of solutions across the 3D metrology market.
By End-user Industry:
Automotive Dominates While Medical Sector ExpandsAutomotive kept its lead with 29.55% of demand in 2025 as electric-vehicle platforms proliferate and tighter tolerances accompany weight-optimized chassis. Robot-mounted scanners inspect every stamped panel, while multi-sensor CMMs verify power-electronics housings. The medical and dental vertical, advancing at 6.62% CAGR, benefits from personalized implants whose fit mandates exact surface mapping. Hospitals collaborate with service bureaus for same-day prostheses, leveraging CT and structured-light to shorten patient cycles.
Aerospace and defense maintain high spend per site due to regulatory stringency and the shift toward additive parts. Semiconductors adopt nanometer-scale optical metrology for wafer-level packaging as CHIPS Act incentives channel fresh capital. Heavy machinery, energy, and construction round out the customer mix, using long-range laser trackers for plant-equipment alignment and BIM verification. The breadth of applications ensures steady baseline demand even when any single vertical cools, supporting continued expansion of the 3D metrology market.
Geography Analysis
APAC 3D Metrology Market
Asia Pacific generated 51.60% of global revenue in 2025 and is growing at a 5.55% CAGR to 2031, propelled by China’s Made in China 2025 roadmap, which drove a 13% rise in robot patents and a 29.5% jump in robotics firms. South Korea’s subsidy programs speed smart-factory upgrades in semiconductor fabs, while Japan’s legacy of precision engineering sustains steady replacement cycles. The region also leads in custom medical implants, applying additive manufacturing to aging population.
North America 3D Metrology Market
North America is the second-largest market. The United States’ CHIPS Act and NIST’s USD 1.498 billion FY 2025 request-USD 47.7 million of which is earmarked for AI measurement research-support investment in nano-scale metrology. Aerospace hubs in Washington, Alabama, and Québec deploy portable metrology to validate AM components under new FAA guidance.
EMEA and LATAM 3D Metrology Market
Europe remains technologically advanced, spearheading digital-twin projects for wind turbines in Germany and the Nordics. France’s aerospace valley continues to modernize with CT-based inspection for engine parts. Latin America and the Middle East follow automotive and oil-and-gas investment cycles; Brazil retrofits steel mills with laser trackers, while UAE energy firms scan offshore rigs for retrofit planning. Africa lags due to limited accredited labs, yet the SADCAS program has accredited 300 sites, signaling gradual ecosystem development.

Competitive Landscape
The 3D metrology market is moderately consolidated. Hexagon, FARO Technologies, and ZEISS control a large installed base, yet niche innovators challenge incumbents with AI-driven algorithms that cut inspection cycle time. Market leaders focus on integrated workflows that span design, measurement, and analytics; Hexagon’s platform feeds real-time data into MES and PLM systems to optimize process parameters. FARO broadened its reach through the Leap ST handheld scanner launch in January 2025, reinforcing its portable leadership.
Strategic alliances shape the field. FARO’s tie-up with Topcon Corporation pools laser-scanning and geospatial know-how, opening civil-engineering opportunities. ZEISS partners with Danish wind-research institutes to refine turbine-blade inspection protocols, elevating brand authority in renewable energy. White-space entrants focus on heritage preservation, dental scanning, or miniaturized semiconductor metrology. Barriers include global service footprints and ISO 17025 calibration capacity, giving established players a lock-in advantage. Nonetheless, low-cost optical-scanner vendors from Asia undercut prices, forcing differentiation through software and application expertise.
Technology competition centers on accuracy, speed, and automation. AI routines now remove outliers from point clouds in milliseconds, enabling 100% inline checks. X-ray CT vendors race to boost voxel resolution while holding scan time below 90 seconds for battery pouch cells. Cloud-platform providers promise predictive defect analytics, though defense-sector cyber rules slow uptake. Overall, escalating performance benchmarks and the pivot to SaaS revenues redefine success factors across the 3D metrology market.
3D Metrology Industry Leaders
ZEISS Group
Creaform
FARO
Hexagon AB
Intertek Group Plc
- *Disclaimer: Major Players sorted in no particular order
3D Metrology Market Companies Covered in this Report
- Hexagon AB
- Carl Zeiss AG
- FARO Technologies Inc.
- Nikon Corporation (Nikon Metrology)
- Mitutoyo Corporation
- Renishaw plc
- Creaform Inc.
- WENZEL Group GmbH and Co. KG
- GOM GmbH (ZEISS)
- Trimble Inc.
- Keyence Corporation
- Perceptron Inc. (Atlas Copco)
- KLA Corporation
- Zygo Corporation
- 3D Systems Corporation
- Metrologic Group
- Jenoptik AG
- InnovMetric Software Inc.
- Leica Geosystems AG
- Hexagon Manufacturing Intelligence
- Intertek Group plc
- API - Automated Precision Inc.
- Shining 3D
- Kreon Technologies
- CyberOptics Corporation

Recent Industry Developments in 3D Metrology Market
- April 2025: InnovMetric announced the forthcoming PolyWorks release featuring advanced data-analysis functions.
- April 2025: ISO released updated calibration-procedure standards, refining measurement-uncertainty guidelines.
- March 2025: NIST secured a USD 1.498 billion discretionary budget request for FY 2025, with funds allocated to AI and quantum measurement research supporting metrology advances.
- February 2025: ZEISS deployed ARAMIS and TRITOP optical systems at the Technical University of Denmark to enable blade-crack tracking under load
- February 2025: Topcon Corporation and FARO Technologies formed a partnership to co-develop laser-scanning solutions for digital-reality applications.


3D Metrology Market Report Scope and Research Methodology
Market Definition and Coverage
Our study treats the 3D metrology market as all hardware, software, and related services that capture, process, and analyze three-dimensional coordinates to verify dimensional accuracy of physical parts in manufacturing, repair, or research settings. The baseline value for 2025 is USD 11.23 billion, rising to USD 14.87 billion by 2030 at a 5.8 % CAGR.
Scope exclusion: simple 2-D gauges, manual calipers, and standalone calibration services are outside this scope.
Segments Covered in This Report
- By Component
- Hardware
- Software
- Services
- By Hardware Type
- Coordinate Measuring Machines (CMM)
- Laser Trackers
- Optical and Structured-Light Scanners
- Video Measuring Machines (VMM)
- Photogrammetry Systems
- Others
- By Application
- Quality Control and Inspection
- Reverse Engineering
- Virtual Simulation and Digital Twin
- 3D Printing and Additive Manufacturing Validation
- Alignment and Assembly
- Others
- By End-user Industry
- Automotive
- Aerospace and Defense
- Industrial Manufacturing and Heavy Machinery
- Electronics and Semiconductor
- Medical and Dental
- Energy and Power Generation
- Construction and Engineering
- Heritage and Archaeology
- Others
- By Geography
- North America
- United States
- Canada
- Mexico
- Europe
- Germany
- United Kingdom
- France
- Italy
- Spain
- Rest of Europe
- Asia-Pacific
- China
- Japan
- South Korea
- India
- South East Asia
- Rest of Asia-Pacific
- South America
- Brazil
- Rest of South America
- Middle East and Africa
- Middle East
- United Arab Emirates
- Saudi Arabia
- Rest of Middle East
- Africa
- South Africa
- Rest of Africa
- Middle East
- North America
Data Sources, Market Sizing, and Validation
Primary Research
Interviews with quality-control managers, metrology solution integrators, and regional distributors across North America, Europe, and Asia-Pacific helped us verify utilization rates, software attachment ratios, and service revenue shares, filling gaps left by desk research and sharpening our assumptions before final triangulation.
Desk Research
We first collated publicly available datasets from bodies such as the International Organization of Motor Vehicle Manufacturers, OECD trade statistics, and Eurostat to size end-use demand pools. Sector associations, such as the Aerospace Industries Association and SEMI, offered shipment and capacity updates that hint at metrology intensity in aerospace and semiconductor lines. Company 10-Ks plus investor decks revealed capital-equipment outlays and average selling prices, while peer-reviewed journals clarified emerging tolerance requirements for additive parts.
Our analysts then drew on paid databases, D&B Hoovers for vendor revenues and Questel for patent counts, to validate adoption curves and benchmark competitive footprints. Numerous other secondary materials were referenced; the list above is illustrative rather than exhaustive.
Market-Sizing & Forecasting
A top-down production and trade rebuild (using automotive builds, aircraft deliveries, semiconductor wafer starts, heavy machinery output, and medical device shipments) establishes the total addressable pool, which is then stress tested through selective bottom-up roll-ups of key supplier revenues and channel checks. Drivers such as installed CMM base, laser scanner ASP trends, and penetration of automated optical inspection lines feed a multivariate regression forecast; where bottom-up data are sparse, we apply calibrated cross-checks and scenario analysis to keep variance within +/- 5 %.
Data Validation & Update Cycle
Our outputs pass anomaly screens, senior analyst peer review, and management sign-off. We refresh each model annually and trigger interim revisions when material events, such as plant expansions, regulatory shifts, or large mergers, move the market. A last-minute verification pass ensures clients receive the latest view.
How Mordor Intelligence's 3D Metrology Market Size Compares to Other Published Estimates
Published values often differ because firms pick varying product mixes, apply unique ASP progressions, or freeze exchange rates at different points.
Key gap drivers here include wider "industrial metrology" scopes, differing refresh cadences, and unvetted cross-segment extrapolations that inflate competitor numbers relative to Mordor's disciplined, scope-locked baseline.
Benchmark comparison
| Market Size | Anonymized source | Primary gap driver |
|---|---|---|
| USD 11.23 bn (2025) | Mordor Intelligence | - |
| USD 13.56 bn (2024) | Global Consultancy A | Includes 2-D instruments and project-based services, older exchange rates |
| USD 11.13 bn (2024) | Global Consultancy B | Uses 2023 supplier ASPs without adjusting for 2024 price rises |
| USD 13.27 bn (2024) | Industry Journal C | Aggregates broader "industrial metrology" equipment not limited to 3D capture |
In summary, by anchoring scope tightly to true 3D tools, refreshing inputs yearly, and validating both top-down and bottom-up, Mordor Intelligence supplies a balanced, reproducible baseline that buyers can rely on with confidence.


Key Questions Answered in the Report
What is the current value of the 3D metrology market?
The market is valued at USD 11.85 billion in 2026 and is on track to reach USD 15.51 billion by 2031.
Which region leads 3D metrology adoption?
Asia Pacific commands 51.60% of global revenue, buoyed by China’s smart-factory push and South Korea’s semiconductor investments.
Why are services growing faster than hardware?
Manufacturers need turnkey expertise for calibration, data analytics, and system integration, driving an 8.31% CAGR for services versus slower hardware growth.
What hardware type is expanding the quickest?
Laser scanners are the fastest-growing hardware category, advancing at a 6.18% CAGR as non-contact inspection spreads across automotive and aerospace lines.
How does 3D metrology support electric-vehicle battery production?
Inline X-ray CT and optical systems provide real-time defect detection in gigafactories, raising yield and safety while complying with stringent quality mandates.
What limits metrology adoption in Africa?
A shortage of ISO 17025-accredited calibration labs forces companies to send equipment abroad for verification, increasing downtime and cost.
Page last updated on:


