
Market Overview
| Study Period | 2021 - 2031 |
|---|---|
| Market Size (2026) | USD 5.41 Billion |
| Market Size (2031) | USD 6.72 Billion |
| Growth Rate (2026 - 2031) | 4.47 % |
| Fastest Growing Market | Asia Pacific |
| Largest Market | North America |
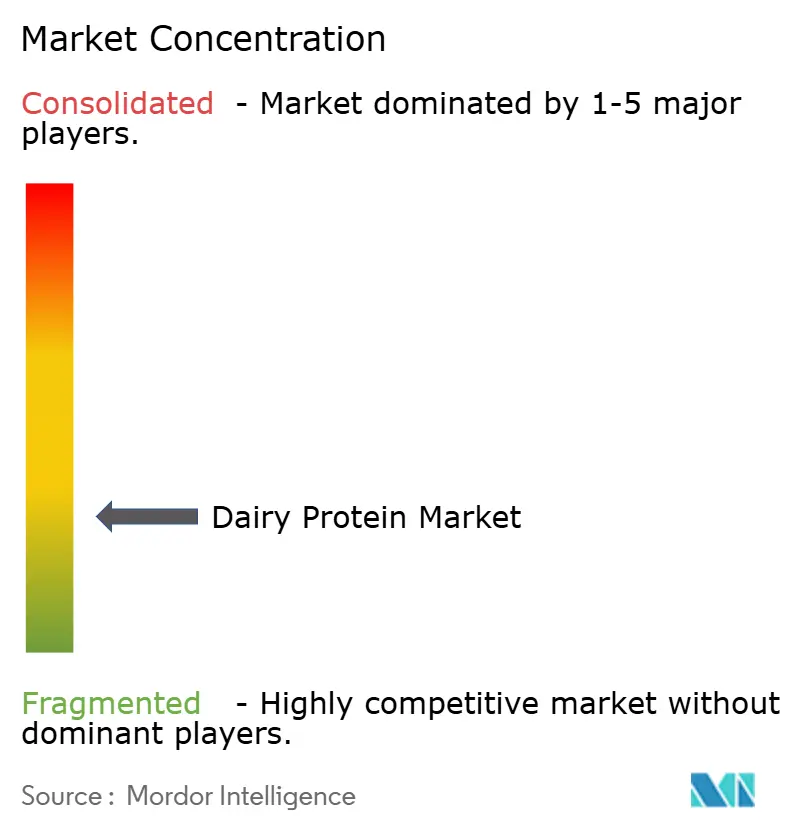
| Market Concentration | Low |
Major Players
*Disclaimer: Major Players sorted in no particular order Image © Mordor Intelligence. Reuse requires attribution under CC BY 4.0. |
|
Dairy Protein Market Analysis by Mordor Intelligence
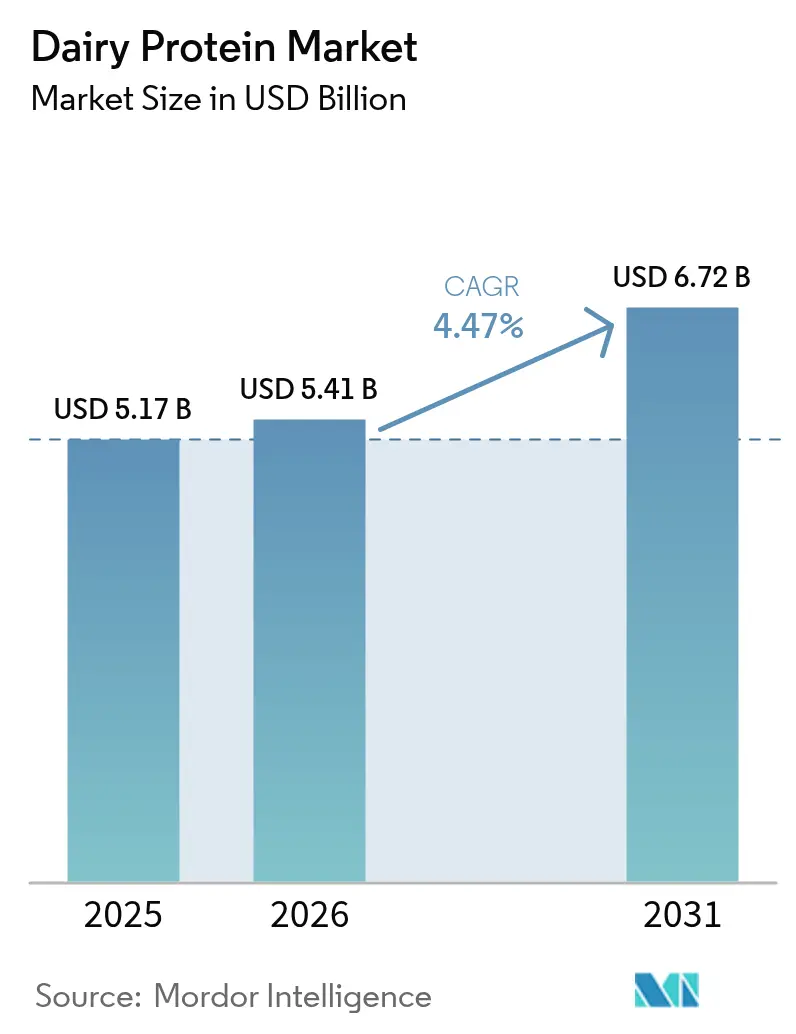
The dairy proteins market size was valued at USD 5.17 billion in 2025 and estimated to grow from USD 5.41 billion in 2026 to reach USD 6.72 billion by 2031, at a CAGR of 4.47% during the forecast period (2026-2031). The market growth is primarily driven by increasing consumer preference for high-protein diets to support weight management and muscle development, rising adoption of functional nutrition for overall health benefits, and expanding applications in ready-to-drink (RTD) beverages across various consumer segments. Advancements in membrane filtration and precision fermentation technologies have improved production yields, enhanced protein quality, and enabled new applications in food and beverage formulations. Consumer demand for clean-label products has increased interest in organic and minimally processed options, particularly among health-conscious consumers and those with dietary preferences. Despite milk price fluctuations and supply chain challenges, manufacturers continue to expand production capacity to meet growing global demand. The market is becoming more competitive as major cooperatives consolidate through mergers to achieve economies of scale, while ingredient manufacturers focus on specialized products like lactoferrin and hydrolyzed whey isolates to capture premium market segments. These developments create new opportunities in sports nutrition for athletes and fitness enthusiasts, early-life nutrition for infant formula manufacturers, and clinical nutrition segments for medical food producers.
Key Report Takeaways
- By ingredient, whey protein held 48.88% of the Dairy proteins market share in 2025; milk protein is set to grow at a 5.41% CAGR through 2031.
- By nature, conventional products commanded 91.90% revenue share in 2025, while organic variants are pacing ahead at an 7.88% CAGR.
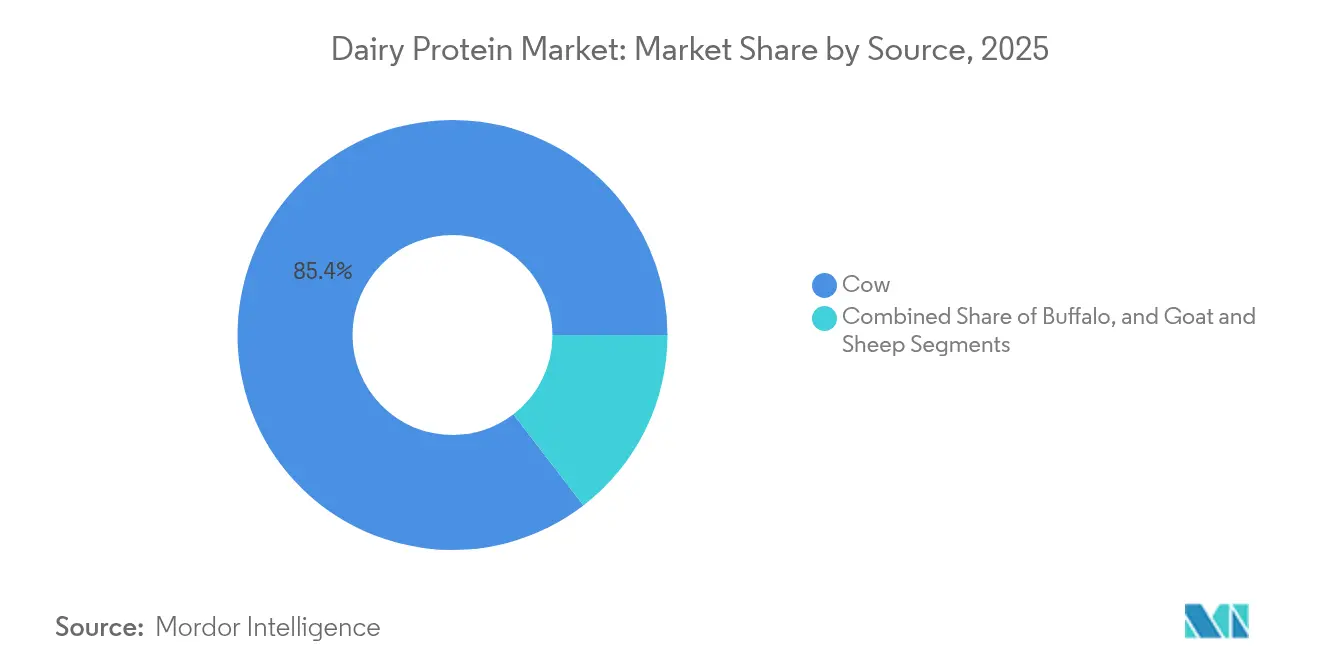
- By source, cow-derived proteins accounted for 85.42% of the Dairy proteins market size in 2025; goat milk proteins are expanding at a 7.58% CAGR.
- By application, food and beverage uses represented 59.10% of the Dairy proteins market size in 2025, whereas supplements are rising at a 6.18% CAGR.
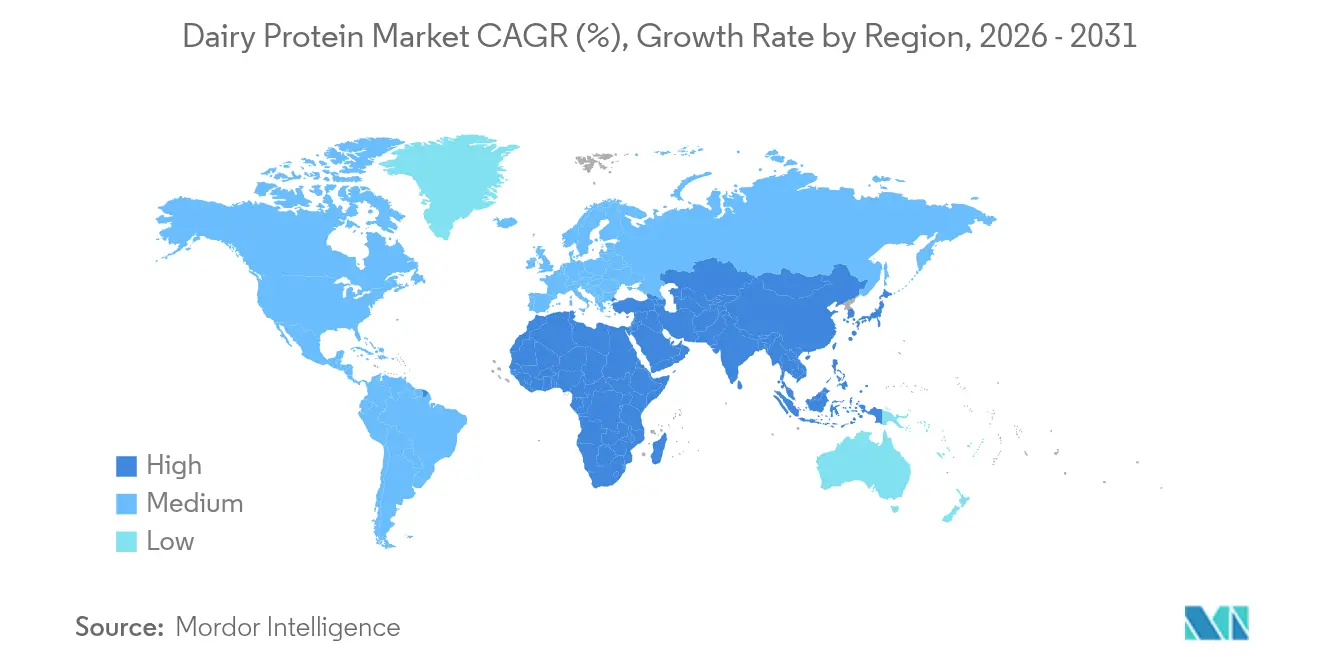
- By geography, North America led with 32.70% market share in 2025, whereas Asia-Pacific is advancing at an 8.34% CAGR through 2031.
Note: Market size and forecast figures in this report are generated using Mordor Intelligence’s proprietary estimation framework, updated with the latest available data and insights as of 2026.
Market Trends and Insights
Drivers Impact Analysis of Dairy Protein Market*
| Driver | (~) % Impact on CAGR Forecast | Geographic Relevance | Impact Timeline |
|---|---|---|---|
| Rising Demand for High-Protein Diets | +1.2% | Global, with strong momentum in North America & APAC | Medium term (2-4 years) |
| Growth in Sports Nutrition and Functional Foods | +0.9% | North America & Europe core, expanding to APAC | Short term (≤ 2 years) |
| Increasing Application in Infant and Early Nutrition | +0.7% | APAC core, spill-over to MEA and Latin America | Long term (≥ 4 years) |
| Increased Popularity in High Protein RTD Beverages | +0.8% | Global, led by North America and urban APAC markets | Short term (≤ 2 years) |
| Technological Innovations in Dairy Processing | +0.5% | Developed markets initially, scaling to emerging economies | Medium term (2-4 years) |
| Increasing Demand for Clean Label and Natural Protein Sources | +0.6% | North America & EU primarily, growing in urban APAC | Medium term (2-4 years) |
| Source: Mordor Intelligence | |||


Rising Demand for High-Protein Diets
According to the IFIC Food and Health Survey 2024, 71% of consumers actively monitor their protein intake, marking an increase from 69% in 2023.[1]Source: International Food Information Council, "IFIC Food and Health Survey" 2024", ific.org Nearly half of consumers are increasing their protein consumption in the evening across all demographic groups, including young adults, middle-aged individuals, and seniors. This trend is particularly strong among health-conscious consumers aged 25-45. Millennials and Generation Z drive the growth in protein-fortified product launches, expanding the market beyond traditional sports nutrition consumers to everyday dietary supplementation. The demand spans across breakfast items, ready-to-drink beverages, and meal replacement options. Dairy proteins maintain premium pricing due to their complete amino acid profile, which includes essential amino acids like leucine, isoleucine, and valine, compared to plant-based alternatives. The increasing availability of protein-enriched snacks, desserts, beverages, and convenience foods indicates broader market acceptance of protein fortification in multiple food categories. This diversification includes protein-fortified yogurt, cheese snacks, milk-based drinks, and ice cream alternatives, supporting the dairy proteins market growth through 2030.
Growth in Sports Nutrition and Functional Foods
Dairy proteins maintain a strong presence in sports nutrition, primarily due to whey's quick absorption and casein's gradual release properties. The consumer base has expanded beyond traditional athletes to include women and young adults seeking cognitive enhancement benefits, which has led to innovations such as citicoline incorporation in protein supplements and functional beverages. The growth in sports participation, including recreational activities, competitive sports, and fitness training, contributes to market expansion. The World Health Organization's 2024 report indicates that 69% of the global population maintains an active lifestyle through regular exercise and physical activities, while 31% remains physically inactive.[2]Source: World Health Organization, "Physical activity", who.int This presents substantial growth opportunities in the active lifestyle segment, where athletes and bodybuilders continue to prefer casein protein for its muscle recovery and maintenance properties. The functional hydration segment shows particular promise, as dairy proteins' natural electrolyte content, including essential minerals like potassium, calcium, and magnesium, offers performance benefits. The trend toward personalized nutrition creates opportunities for specialized dairy protein formulations that target specific performance goals, such as endurance enhancement, muscle building, and recovery optimization, while accommodating various dietary needs and restrictions.
Increasing Application in Infant and Early-Life Nutrition
The demand for lactoferrin is expected to increase due to its immune-enhancing properties in premium infant formula products. The protein's ability to boost immune function, improve iron absorption, and provide antimicrobial benefits drives its incorporation into high-end infant nutrition. Companies such as Triplebar and FrieslandCampina are addressing supply limitations through precision fermentation technology to increase production capacity. This technological advancement enables efficient, scalable production methods that reduce dependency on traditional dairy-derived sources. The Asia-Pacific region dominates consumption, driven by higher birth rates and increasing consumer purchasing power, particularly in China and India. The regulatory acceptance of recombinant lactoferrin reduces production costs and enables expansion into adult nutrition products, including functional foods, dietary supplements, and sports nutrition applications. These factors establish sustained growth potential in the dairy proteins market, with manufacturers focusing on product innovation and capacity expansion to meet growing demand.
Increased Popularity in High-Protein RTD Beverages
The ready-to-drink (RTD) protein beverage market has grown beyond sports nutrition to serve mainstream consumers seeking convenient nutritional products. Consumer preferences have shifted toward on-the-go nutrition solutions and healthier beverage options. The market now offers various product formats beyond traditional protein shakes to meet different lifestyle requirements. Dairy proteins enable manufacturers to produce clear protein waters, fortified juices, and shelf-stable smoothies due to their solubility and neutral flavor characteristics. Manufacturers incorporate prebiotics, vitamins, and cognitive enhancers to justify premium pricing while addressing specific health and wellness objectives. These formulations enhance taste and nutritional value, increasing the appeal to a wider consumer base. The emergence of clear protein waters and fortified juices has increased market volume and value, with dairy proteins providing clean label advantages. This diversification into multiple beverage formats has created opportunities for dairy protein manufacturers and beverage companies to expand their presence across retail channels, including convenience stores, health food outlets, and supermarkets.
Restraints Impact Analysis of Dairy Protein Market*
| Restraint | (~) % Impact on CAGR Forecast | Geographic Relevance | Impact Timeline |
|---|---|---|---|
| Lactose intolerance and dairy allergies | -0.8% | Global, particularly pronounced in Asia-Pacific populations | Long term (≥ 4 years) |
| Rising demand for plant-based proteins | -0.6% | North America & Europe primarily, expanding globally | Medium term (2-4 years) |
| Price volatility of raw milk | -1.2% | Global | Long term (≥ 4 years) |
| Environmental and sustainability concerns | -0.4% | Global, particularly pronounced in North America & Europe | Long term (≥ 4 years) |
| Source: Mordor Intelligence | |||
Lactose Intolerance and Dairy Allergies
Lactose intolerance affects a significant portion of the global population, with prevalence rates exceeding 90% in certain Asian regions, limiting the adoption of conventional dairy proteins. This condition restricts digestive capabilities and nutrient absorption, constraining consumer options in the protein beverage market. However, advancements in lactose-free processing and protein isolation techniques are overcoming these challenges. Modern filtration systems and enzymatic treatments now enable manufacturers to produce lactose-free dairy proteins while retaining their nutritional value. The FDA's guidelines on plant-based labeling establish clear nutritional distinctions, highlighting dairy options that demonstrate high bioavailability. Companies such as Imagindairy are developing fermentation-based dairy proteins that eliminate both lactose and allergenicity issues. These precision fermentation methods produce proteins identical to dairy without lactose, addressing both intolerance and allergic reaction concerns that have historically restricted market expansion. The implementation of these processing technologies has improved product accessibility while preserving dairy proteins' functional and nutritional properties.
Rising Demand for Plant-Based Proteins
The dairy proteins market faces competitive pressure from plant-based proteins, particularly in developed markets where environmental sustainability influences consumer choices. Consumers' growing awareness of environmental impact, animal welfare, and health benefits drives the demand for plant-based alternatives. However, the adoption of plant-based proteins remains limited due to gaps in amino acid profiles, protein digestibility scores, and bioavailability. The industry also faces challenges in matching the taste, texture, and functionality of dairy proteins. Manufacturers are developing hybrid protein formulations that combine dairy and plant proteins. These blends utilize dairy proteins' nutritional and functional advantages while reducing environmental impact. The hybrid approach demonstrates market adaptation by meeting nutritional, sustainability, and sensory requirements. While this strategy helps address competitive pressures in the dairy proteins market, manufacturers continue to work on optimizing dairy-to-plant protein ratios to meet both nutritional standards and environmental goals.
*Our forecasts treat driver/restraint impacts as directional, not additive. The impact forecasts reflect baseline growth, mix effects, and variable interactions.
Dairy Protein Market Segment Analysis
By Ingredient:
Whey’s Scale and Milk Protein’s MomentumWhey protein held a dominant 48.88% share of the dairy proteins market in 2025. This position stems from its extensive use in sports nutrition powders, ready-to-drink protein shakes, and bakery products. The protein's complete amino acid profile, quick absorption rate, and functional properties make it essential across these applications. Casein and caseinates maintain steady demand in sustained-release nutrition products and medical nutrition formulations. Hydrolyzed protein variants are gaining market acceptance due to their improved digestibility and lower allergenicity.
The milk protein segment is expected to grow at a 5.41% CAGR through 2031, supported by processing innovations, particularly in ultrafiltration technology that maintains native micellar structures. These developments enhance protein functionality in ultra-high temperature (UHT) beverages and high-protein yogurt formulations. The commercial production of precision-fermented whey proteins signals a potential market shift while strengthening overall ingredient demand. Technological progress enables market premiumization through specialized ingredients, allowing manufacturers to create targeted solutions for infant formulas, clinical nutrition products, and protein-enriched ice creams. Ingredient manufacturers are prioritizing supply chain traceability and sustainability certifications, creating product differentiation opportunities and supporting market value growth.



By Nature:
Conventional Scale versus Organic AccelerationConventional proteins account for 91.90% of the dairy proteins market in 2025, supported by established supply chains, efficient processing methods, and economies of scale. The growing consumer focus on artificial additives, antibiotic usage, and intensive farming methods drives organic dairy protein demand at an 7.88% CAGR. The clean-label cheese segment demonstrates the market's commercial viability through increased shelf presence and consumer acceptance. While organic production involves higher feed costs, rigorous certification processes, and specialized handling requirements, manufacturers offset these expenses through premium pricing strategies and enhanced consumer trust in product quality.
The organic segment shows significant uptake in infant formula, where parents prioritize stringent quality standards and natural ingredients, and in sports nutrition, where consumers seek products without synthetic additives and preservatives. Clear regulations in key markets and sustained investments in organic dairy farming infrastructure increase the availability of certified milk supplies. Though production capacity remains limited outside developed countries due to certification challenges and infrastructure gaps, organic suppliers establish market positions through targeted brand development, transparent sourcing practices, and expanded e-commerce distribution channels.
By Source:
Cow Dominance and Alternative AppealCow milk constituted 85.42% of the market size in 2025, supported by extensive production capabilities and established logistics networks across major dairy-producing regions. Goat milk proteins are growing at a 7.58% CAGR, primarily due to their digestibility advantages, reduced allergenic properties, and increasing consumer awareness of alternative dairy options. Buffalo milk, with its higher protein and fat content, serves premium confectionery and specialty cheese production segments, particularly in artisanal and gourmet food markets, while sheep milk finds applications in metabolic health products and specialty dairy formulations.
Production challenges affect non-cow milk sources, including restricted herd sizes, elevated feed expenses, and limited breeding programs that constrain market volumes. However, specialized applications generate strong profit margins, including goat milk powders for infant nutrition and sensitive digestive needs, buffalo milk for premium mozzarella production and traditional dairy products, and sheep milk for functional yogurt products targeting health-conscious consumers. The adoption of specialized processing equipment for alternative milk sources has improved protein extraction efficiency and product quality, enabling regional producers to utilize local supply chains, meet stringent quality standards, and expand export operations across international markets.
By Application:
Mainstream Food Leads, Supplements AccelerateFood and beverage products dominate the dairy proteins market with a 59.10% share in 2025, driven by the widespread availability of protein-fortified bakery items, dairy desserts, and flavored milks in retail stores. The segment's leadership stems from increasing consumer demand for protein-enriched foods and continuous product innovation by manufacturers. The supplements segment is projected to grow at 6.18% annually, supported by consumers integrating protein sachets and convenient formats into their daily routines. The sports nutrition segment has expanded globally due to increased awareness of protein's importance in muscle maintenance and recovery, particularly as more people engage in regular physical activities.
Infant nutrition maintains its position as a critical market segment, characterized by stringent quality requirements and high price sensitivity, particularly in China, where regulatory frameworks and consumer preferences shape market dynamics. The elderly and clinical nutrition segments demonstrate significant growth opportunities, driven by the need for protein consumption to prevent muscle loss in aging populations. Ready-to-drink beverages continue to advance through innovations such as clear liquid formulations, fiber additions, and cognitive health benefits. These product developments address specific consumer requirements across age groups and lifestyles, increasing consumption opportunities and strengthening market demand.
Geography Analysis
North America Dairy Protein Market
North America maintains a commanding 32.70% share of the global dairy proteins market in 2025, supported by a well-established sports nutrition ecosystem and comprehensive retail education programs about protein quality. The region's market strength stems from widespread consumer awareness, advanced distribution networks, and continuous product innovation. In August 2024, Kenvue expanded its product portfolio by launching Neutrogena® Collagen Bank™ with micro-peptide technology, entering the pre-aging category to target Gen Z consumers seeking preventive skincare solutions. The FDA's qualified health claim connecting yogurt consumption to reduced type 2 diabetes risk further strengthens the market position and encourages premium dairy product development.
APAC Dairy Protein Market
Asia-Pacific demonstrates remarkable growth potential with an 8.34% CAGR through 2031, driven by increasing urbanization, changing dietary preferences, and growing adoption of high-protein foods and flavored cheeses. The expanding middle class, rising disposable incomes, and proliferation of e-commerce platforms create robust market opportunities. The region's growth is further supported by improving cold chain infrastructure and increasing awareness of protein-rich diets.
Europe Dairy Protein Market
Europe's dairy protein market faces challenges as milk production is projected to reach 149.4 million tons in 2025, influenced by stringent environmental regulations and ongoing disease-related challenges, according to USDA data.The significant EUR 19 billion Arla-DMK merger in April 2025 represents industry consolidation, combining procurement capabilities and research facilities to enhance operational efficiency. European consumers' strong emphasis on sustainability and product quality drives increased demand for precision-fermented and low-carbon dairy proteins, reflecting the region's commitment to environmental responsibility.

Regulatory Landscape
Dairy proteins are governed by a set of compositional standards, novel food pathways, and allergen and hygiene compliance rules that constrain allowable formulations and label claims across regions. In the European Union, Directive (EU) 2015/2203 underpins harmonized requirements for caseins and caseinates (including compositional parameters aligned with Codex references), supporting cross-border trade of standardized ingredients used in mainstream foods and specialized nutrition.
Regulatory activity in 2026 adds compliance anchors for infant and early-life nutrition as well as for emerging processing routes. The European Commission adopted Delegated Regulation (EU) 2026/743 in March 2026, updating protein-related requirements for infant and follow-on formula made from protein hydrolysates, including defined protein minimums such as 0.55 g/100 kJ for permitted hydrolysate-based formulations. In the United States, FDA GRAS notifications referenced for precision fermentation-derived beta-lactoglobulin (including Vivici and Imagindairy) reinforce that products containing milk-derived proteins remain subject to major food allergen labeling under the FD&C Act, while the FDA Human Foods Program 2026 priority deliverables point to continued emphasis on food safety and compliance expectations for ingredient suppliers.
Competitive Landscape
The dairy proteins market is characterized by consolidation, with market leaders benefiting from economies of scale in processing technology and distribution networks. Smaller players are carving niches in specialized applications and alternative production methods. In May 2025, Arla Foods Ingredients expanded its distribution partnership with Brenntag Group to cover Vietnam, Thailand, and Indonesia, representing the three largest food and nutrition markets in Southeast Asia.
Technological advancement is a key differentiator among competitors. Vivici has achieved industrial-scale production of precision-fermented whey, providing animal-free alternatives with dairy-identical functionality. FrieslandCampina's partnership with Triplebar aims to double lactoferrin production, addressing supply constraints in premium formulas. These innovations help companies reduce their dependence on raw milk prices and respond to increasing allergy-related demand changes.
The market presents growth opportunities in elderly nutrition powders, cognitive-function beverages, and hybrid dairy-plant combinations. However, companies face operational challenges from supply disruptions, including avian flu outbreaks and increased feed costs. Companies that make early investments in sustainability, particularly in methane-reducing additives and labeling transparency, may gain competitive advantages as regulatory support increases.
Dairy Protein Industry Leaders
-
Fonterra Co-operative Group Ltd
-
Royal FrieslandCampina N.V.
-
Arla Foods amba
-
Glanbia PLC
-
Kerry Group PLC
- *Disclaimer: Major Players sorted in no particular order
Dairy Protein Market Companies Covered in this Report
- Fonterra Co-operative Group Ltd
- Royal FrieslandCampina N.V.
- Arla Foods amba
- Glanbia PLC
- Kerry Group PLC
- Groupe Lactalis S.A.
- Saputo Inc.
- Agropur Co-operative
- Hilmar Cheese Company, Inc.
- Leprino Foods Company
- DMK Group
- Carbery Group Limited
- Morinaga Milk Industry Co., Ltd
- Prolactal GmbH
- Actus Nutrition
- Ingredia SA
- Tatua Co-operative Dairy Co. Ltd.
- Theo Muller Group
- Hoogwegt International B.V.
- Savencia Fromage & Dairy

Market Opportunities and Future Outlook
Capacity additions and portfolio moves toward higher-value fractions are creating room for new offerings in heat-stable, high-protein beverages, performance nutrition, and premium early-life nutrition. FrieslandCampina Ingredients completed an expansion of its Borculo, Netherlands facility in March 2026 that doubled capacity for whey protein isolate and milk fat globule membrane, followed by a EUR 90 million investment announcement in May 2026 to upgrade and expand whey protein capacity across multiple Dutch sites. In North America, Land O'Lakes announced a strategic investment in July 2026 to expand high-value dairy protein capabilities at its Tulare, California facility (including ultra-filtered milk), strengthening supply-side support for ingredient users targeting more consistent functionality and tighter specifications.
Innovation is increasingly focused on formulation-enabling ingredients rather than bulk proteins, which supports opportunities for suppliers addressing viscosity, clarity, and thermal-process limitations in RTD and shelf-stable foods. Leprino Nutrition introduced new specialty ingredients at IFT FIRST 2026 (July 2026), including a micellar casein isolate and a clear-format whey ingredient designed to address common processing constraints. Manufacturing routes for high-value proteins are also scaling further: Vivici received a 12.5 million Euro European Innovation Council Accelerator grant in June 2026 to scale precision-fermented dairy proteins, and Nestle partnered with Helaina in June 2026 to scale a bioidentical human lactoferrin product, reflecting ongoing commercial pull for lactoferrin and related immune-support proteins in premium nutrition applications.
Recent Industry Developments in Dairy Protein Market
- May 2026: Royal FrieslandCampina N.V. announced a EUR 90 million investment to increase whey protein production capacity and implement energy-efficient technologies across multiple Netherlands facilities. The program aims to expand availability of specialized whey fractions used in RTD beverages and performance nutrition, while balancing protein expansion with cost and energy efficiency targets.
- April 2026: FrieslandCampina Ingredients completed an expansion at its Borculo facility, doubling production capacity for whey protein isolate and milk fat globule membrane. The added capacity is designed to support demand for higher-functionality ingredients used in premium infant nutrition and advanced beverage formulations, where purity and process tolerance are critical.
- July 2024: PT Frisian Flag Indonesia (FrieslandCampina subsidiary) officially opened a new factory in Sukamahi village, Cikarang district, Bekasi regency, with an investment of EUR 257 million. The site expands regional supply and processing scale in Southeast Asia, supporting faster local fulfillment of protein-containing dairy and nutrition products.


Dairy Protein Market Report Scope and Research Methodology
Market Definition and Coverage
This market covers dairy-derived protein ingredients sold into end uses such as food and beverage fortification, sports nutrition, infant formulations, supplements, and animal nutrition. Sizing is tracked in value terms in USD across major consuming regions, based on realized demand and pricing signals across the supply chain.
Scope exclusions: We exclude plant proteins, blended proteins where the dairy share cannot be separated, and in-house captive transfers that are not priced at market terms.
Segments Covered in This Report
-
By Ingredient
-
Milk
- Isolate
- Concentrates
- Hydrolyzed
-
Whey
- Concentrates
- Isolates
- Hydrolyzed
- Casein and Caseinates
-
Milk
-
By Nature
- Conventional
- Organic
-
By Source
- Cow
- Buffalo
- Goat and Sheep
-
By Application
-
Food and Beverage
- Bakery and Confectionery
- Dairy Products and Desserts
- Beverages
- Sports and Performance Nutrition
- Infant and Early-Life Nutrition
- Elderly Nutrition and Medical Nutrition
- Other Applications
-
Food and Beverage
-
Geography
-
North America
- United States
- Canada
- Mexico
- Rest of North America
-
Europe
- Germany
- United Kingdom
- France
- Italy
- Spain
- Netherlands
- Russia
- Rest of Europe
-
Asia-Pacific
- China
- India
- Japan
- South Korea
- Australia and New Zealand
- Rest of Asia-Pacific
-
South America
- Argentina
- Brazil
- Rest of South America
-
Middle East and Africa
- United Arab Emirates
- Saudi Arabia
- South Africa
- Rest of Middle East and Africa
-
North America
Data Sources, Market Sizing, and Validation
Desk Research
Desk research is used to set the frame for demand pools and to anchor assumptions that can be checked against public data. We referenced sources such as USDA, Eurostat, FAO, and UN Comtrade for dairy output, trade flows, and ingredient movement patterns, and then layered in Codex and other food regulation references to understand labeling requirements and permitted use in key applications.
On the industry side, we reviewed company annual reports, investor presentations, and credible press to track capacity additions, product mix direction, and pricing commentary that affects average selling price trends. Patent databases were also screened to understand where processing and filtration advances are likely to change yields and product formats over time. The sources listed here are illustrative only, and we also used other public references to support data collection, validation, and clarification.
Primary Interviews and Surveys
Primary work focused on cross-checking usage by application and the practical split between ingredient types, especially where public statistics do not separate concentrates from isolates. We spoke with stakeholders across ingredient supply, contract manufacturing, and downstream brand or formulation teams. We also kept coverage balanced across APAC, EMEA, and the Americas to reduce regional bias in how usage and form-mix are translated into value.
Distribution of primary research fieldwork respondents
| Company type | Respondent position | Region |
|---|---|---|
| Top tier: 30% | CXOs: 14% | APAC: 44% |
| Mid tier: 56% | Functional/Unit leaders: 40% | EMEA: 34% |
| Smaller Players: 14% | Managers: 46% | Americas: 22% |
Market-Sizing & Forecasting
The core model is built using a top-down approach where dairy ingredient demand is reconstructed from application-level consumption signals, trade and production direction, and the implied penetration of protein fortification in key categories. Totals are then corroborated with selective bottom-up approximations, such as sampled supplier revenue ranges, channel checks for high-velocity end uses, and volume times ASP sanity checks for leading ingredient groups.
Inputs that matter in this market include whey and skim-milk powder production trends (as upstream availability cues), trade balances for whey and casein ingredients, the mix shift between concentrates and isolates, and application indicators such as sports nutrition launches and infant formula demand direction. We also track regional pricing patterns and currency timing so that USD values are comparable year to year. For forecasting, scenario analysis is used with a base case shaped by what interviews indicate about capacity utilization, demand elasticity, and expected pricing progression, and then sensitivity cases are added for faster or slower adoption in nutrition categories. Where bottom-up data is missing for smaller geographies, gaps are handled by using proxy ratios from comparable markets and then re-checking through regional expert feedback.
Data Validation & Update Cycle
Outputs are triangulated against independent signals like upstream dairy solids availability, import-export direction, and application growth rates so the final totals do not rely on a single data series. Variance checks are run at the region and ingredient levels, and unusual jumps are reviewed again before sign-off, which often triggers follow-up questions to industry respondents for clarification.
The report is refreshed annually, and interim updates are made when material events occur, such as major capacity ramps, trade disruptions, or sharp commodity-linked price swings. Before delivery, we complete a final review pass so the numbers and assumptions reflect the most recent public and interview inputs.
Mordor Intelligence's Dairy Protein Market Size Measured Against Other Published Estimates
Published market sizes for dairy protein often do not match because the scope and the price logic are not aligned across studies, even when the titles look similar. Differences typically come from what is counted as dairy protein, how forms and applications are treated, and which year is used as the starting point.
The biggest gap usually comes from category and time-base mixing, where Mordor Intelligence counts only dairy-derived protein ingredients (such as MPC, WPC, WPI, MPI, and caseinates) and reports a 2026 value, while some sources blend in broader dairy ingredient revenue or use earlier base years that inflate the comparable number. Another driver is ASP handling, since some estimates assume uniform price growth across regions, but our model applies region-specific pricing movement and then checks it against trade and capacity signals to avoid overstating value.
Benchmark comparison
| Source | Market Size | Gaps in Research Methodology |
|---|---|---|
| Mordor Intelligence | USD 5.41 B (2026) | |
| Regional Consultancy A | USD 12.20 B (2023) | Uses an earlier time base and a broader framing that appears to blend dairy protein with adjacent dairy ingredient revenue, and it applies form-based splits that can double count protein value already embedded in finished nutrition categories. |
| Trade Publisher B | USD 15.80 B (2031) | Reports a future-year headline without clearly separating ingredient-level value from downstream packaged product value, and the growth path may reflect more aggressive adoption and pricing assumptions that are not cross-checked against dairy solids availability and trade balances. |
The spread in the table is mainly explained by the time period and what is included in the value being counted. By keeping the scope tied to ingredient sales and by using observable production, trade, and application signals to stress-test ASP and volume, we provide a practical number that can be replicated and updated with new evidence.


Key Questions Answered in the Report
What is the current size of the dairy proteins market?
The market stands at USD 5.41 billion in 2026 and is on track to hit USD 6.72 billion by 2031
Which ingredient holds the largest share in the dairy proteins market?
Whey protein leads with 48.88% share in 2025, benefiting from strong sports-nutrition and RTD applications.
Which region is forecast to grow fastest?
Asia-Pacific is projected to expand at an 8.34% CAGR through 2031, propelled by rising protein awareness in China and other urbanizing markets.
Why are organic dairy proteins gaining traction?
Clean-label preferences favor natural ingredients, pushing organic variants to an 7.88% CAGR.
Page last updated on:





