Market Overview
| Study Period | 2021 - 2031 |
|---|---|
| Forecast Data Period | 2026 - 2031 |
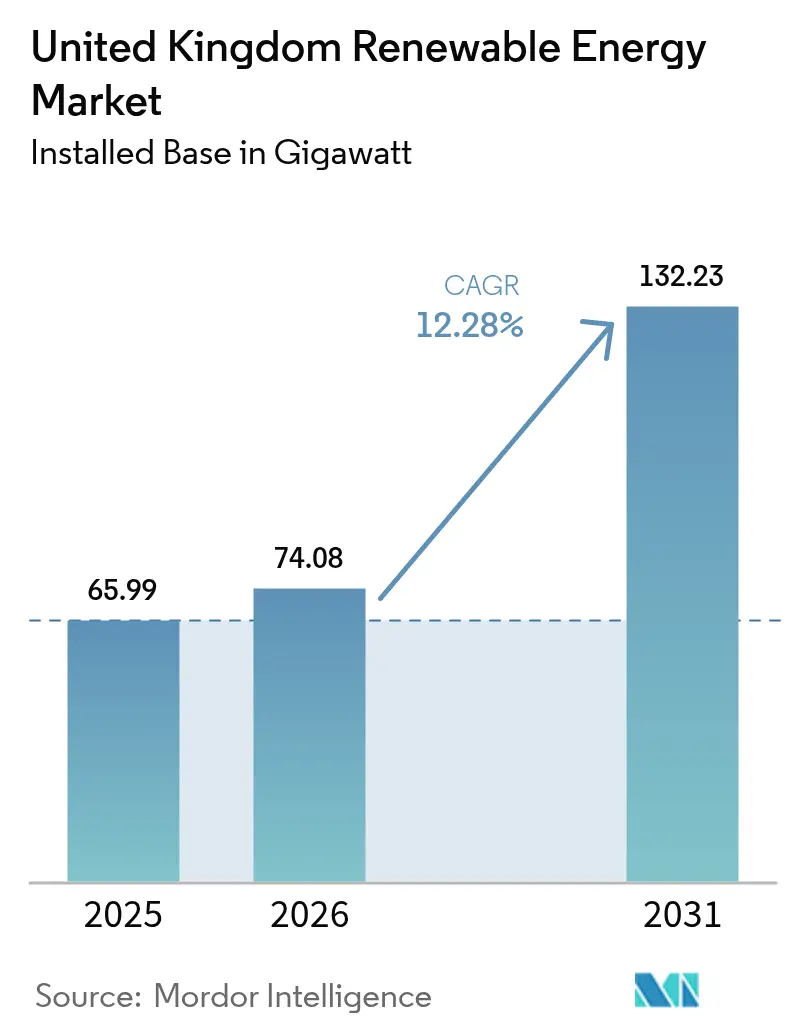
| Base Year Market Size (2025) | 65.99 gigawatt |
| Market Volume (2026) | 74.08 gigawatt |
| Market Volume (2031) | 132.23 gigawatt |
| Growth Rate (2026 - 2031) | 12.28% CAGR |
| Market Concentration | Medium |
Major Players *Disclaimer: Major Players sorted in no particular order Image © Mordor Intelligence. Reuse requires attribution under CC BY 4.0. | |
United Kingdom Renewable Energy Market Analysis by Mordor Intelligence
The United Kingdom Renewable Energy market size is expected to grow from 65.99 gigawatt in 2025 to 74.08 gigawatt in 2026 and is forecast to reach 132.23 gigawatt by 2031 at 12.28% CAGR over 2026-2031.
The acceleration is anchored in the Clean Power 2030 Action Plan, unprecedented private capital inflows exceeding GBP 60 billion per year, and renewables already supplying 46.4% of national electricity in 2024, surpassing gas for the first time.[1]DESNZ, “Digest of UK Energy Statistics 2024 – Electricity Chapter,” assets.publishing.service.gov.uk Consistent Contracts-for-Difference (CfD) auctions, rising corporate power-purchase agreements, and grid modernization funds amplify momentum for the UK renewable energy market, while ongoing cost declines in floating offshore wind and electrolyzer systems widen the addressable resource pools. Even with connection bottlenecks and post-Brexit supply chain pressures, investor confidence remains high as Ofgem prioritizes ready-to-build schemes, and government grants bolster local manufacturing.
Key Report Takeaways
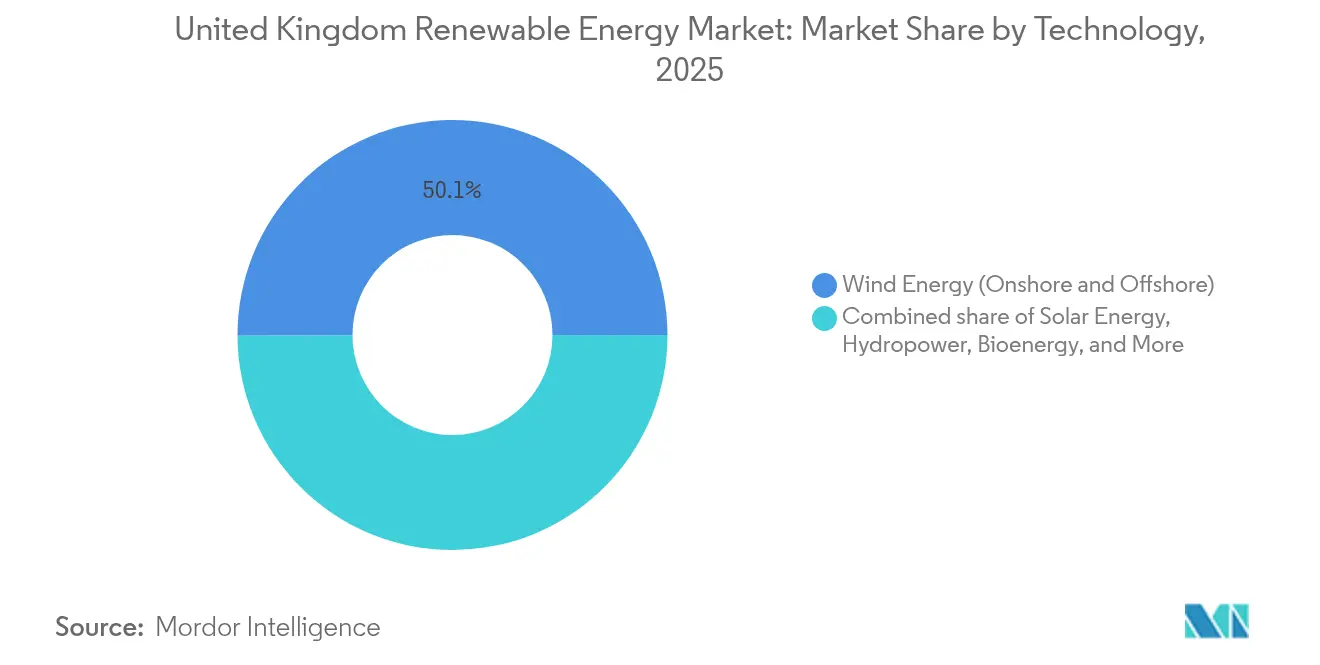
- By technology, wind captured 50.05% of the UK renewable energy market share in 2025; ocean energy is forecast to surge at a 72.9% CAGR through 2031.
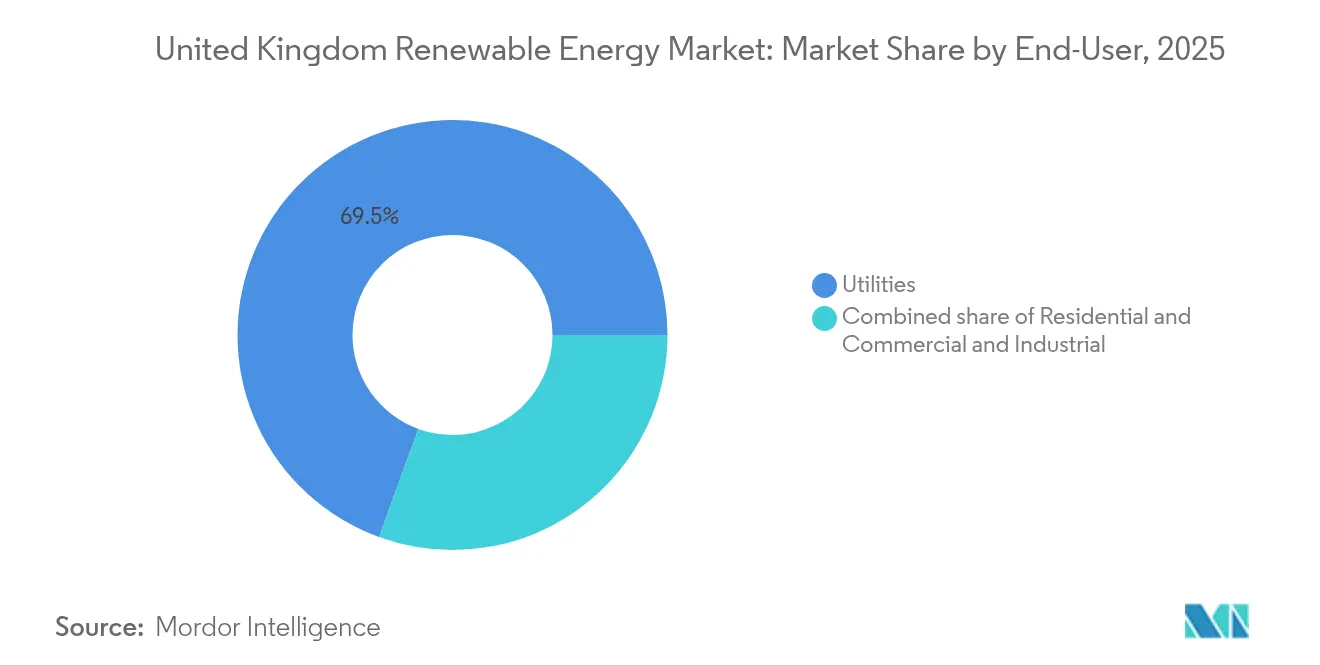
- By end-user, utilities commanded 69.45% of the UK renewable energy market size in 2025, whereas residential installations are projected to advance at an 18.25% CAGR to 2031.
Note: Market size and forecast figures in this report are generated using Mordor Intelligence’s proprietary estimation framework, updated with the latest available data and insights as of 2026.
United Kingdom Renewable Energy Market Trends and Insights
Drivers Impact Analysis*
| Driver | (~) % Impact on CAGR Forecast | Geographic Relevance | Impact Timeline |
|---|---|---|---|
| Offshore-wind CfD Strike-Price Declines Accelerating North-Sea Pipeline | +3.2% | Scotland, North Sea regions, Yorkshire Coast | Medium term (2-4 years) |
| Contracts-for-Difference (CfD) Scheme Providing Revenue Certainty | +2.8% | England, Scotland, Wales | Long term (≥ 4 years) |
| Rise of Corporate PPAs from UK Data-Centre & Heavy-Industry Off-takers | +2.1% | England core, spill-over to Scotland | Medium term (2-4 years) |
| Ofgem RIIO-ED2 Grid-Upgrade Commitments Boosting Distributed Solar | +1.7% | England, Wales distribution networks | Short term (≤ 2 years) |
| Green-Hydrogen Strategy Linking Electrolyser Build-out to Renewables | +1.4% | Scotland, Humber region, Wales | Long term (≥ 4 years) |
| Cost Drop in Floating Offshore Turbines for Deep-water Scottish Sites | +1.1% | Scotland deep waters, North Sea | Long term (≥ 4 years) |
| Source: Mordor Intelligence | |||


Offshore-wind CfD strike-price resets accelerating the North Sea pipeline
The government lifted strike prices to GBP 73/MWh for fixed-bottom and GBP 176/MWh for floating projects after the Allocation Round 5 stalemate, unlocking 5.3 GW in Allocation Round 6 and re-energizing the 40 GW development queue. Predictable 6-8 GW annual CfD rounds, coupled with a Clean Industry Bonus worth up to GBP 200 million, de-risk domestic blade factories and port upgrades, further strengthening the UK renewable energy market.[2]Department for Energy Security and Net Zero, “Clean Power 2030 Action Plan,” gov.uk
CfD scheme providing revenue certainty
More than 25 GW of operational capacity benefits from 15-year indexed contracts that protect both developers and consumers from spot-price fluctuations. Eligibility now spans tidal stream, floating wind, and green hydrogen, signaling a policy toolbox designed to future-proof the UK renewable energy market.
Corporate PPAs from UK data-centre and heavy-industry off-takers
ENGIE’s 473 MW Moray West deal with Amazon and Tesco’s 373 MW Cleve Hill solar agreement exemplify how sustainability mandates supply bankable offtake for new assets. As AI-driven data loads climb, the UK renewable energy market gains a stable demand floor insulated from typical recessions.
Ofgem RIIO-ED2 grid-upgrade commitments boosting distributed solar
GBP 25 billion earmarked for 2023-2028 funds real-time monitoring, automated switches, and battery pilots, cutting average connection lead times for sub-100 kW systems by half and accelerating the residential share of the UK renewable energy market.
Restraints Impact Analysis*
| Restraint | (~) % Impact on CAGR Forecast | Geographic Relevance | Impact Timeline |
|---|---|---|---|
| National-Grid Queue Bottlenecks Causing 5-year Connection Delays | -2.8% | England transmission network, Scotland interconnections | Short term (≤ 2 years) |
| Reduced Smart-Export-Guarantee Tariff Hitting Rooftop Solar ROI | -1.3% | England, Wales residential markets | Medium term (2-4 years) |
| Offshore-Wind Monopile Cost Inflation Post-Brexit Steel Tariffs | -0.9% | North Sea offshore projects | Medium term (2-4 years) |
| Visual-Impact Objections Stalling Onshore Wind Permitting | -0.6% | England rural areas, Wales uplands | Long term (≥ 4 years) |
| Source: Mordor Intelligence | |||
National Grid queue bottlenecks causing five-year connection delays
The queue ballooned to 739 GW, ten times the 2020 levels, forcing some assets to be assigned to 2035 slots. Ofgem’s TMO4+ “first ready, first connected” reform removes speculative placeholders and could free up 500 GW.[3]National Grid ESO, “Two-step offers process update,” nationalgrideso.com Yet, construction of the GBP 4.3 billion Eastern Green Link 2 will not be completed until 2029, keeping pressure on the near-term buildout of the UK renewable energy market.
Reduced Smart-Export-Guarantee tariff hitting rooftop solar ROI
Average SEG payments have slipped below 10 p/kWh, extending paybacks to 12-15 years for systems without batteries, slowing the residential slice of the UK renewable energy market.
*Our forecasts treat driver/restraint impacts as directional, not additive. The impact forecasts reflect baseline growth, mix effects, and variable interactions.
Segment Analysis
By Technology: Wind leadership challenged by an ocean-energy revolution
Wind remains the anchor of the UK renewable energy market, supplying 50.05% of 2025 output and earning the largest UK renewable energy market share through high-capacity-factor offshore arrays, such as the 3.6 GW Dogger Bank complex. Yet, ocean energy promises a 72.9% CAGR between 2026 and 2031, catapulting tidal-stream pioneers from demonstrators to bankable assets as CfD carve-outs guarantee price floors. Government R&D grants and predictable export-credit financing shrink levelized costs, raising the UK renewable energy market size for marine technologies and attracting supply-chain investment in coastal hubs from Aberdeen to Cornwall. Solar continues its steady expansion through mandatory rooftop rules starting in 2025, while bioenergy transitions toward carbon-negative configurations under new BECCS trials. Hydropower’s pumped-storage reservoirs add flexibility that mitigates intermittency, and early-stage geothermal pilots diversify the portfolio without diluting wind’s core position in the UK renewable energy market.
Second-generation wave converters and array-scale tidal turbines utilize modular production, reducing both balance-of-plant and installation risks. These learning-curve benefits, when stacked with hydrogen offtake contracts, make ocean assets a compelling hedge within the broader UK renewable energy market size outlook to 2030 and beyond.


By End-User: Utility dominance with residential acceleration
Utilities owned 69.45% of delivered green electricity in 2025, leveraging CfD portfolios and regulated-asset returns to maintain the largest UK renewable energy market share across buyer categories. Long-dated offtake visibility and balance-sheet strength allowed them to bid aggressively in Allocation Round 7, cementing control of mega-scale offshore arrays and multi-gigawatt solar parks. The commercial and industrial cohort leverages corporate PPAs to lock in power costs at inflation-adjusted price indices, ensuring a growing but measured penetration.
Residential uptake, however, posts an 18.25% CAGR as building-code mandates for solar, GBP 7,500 heat-pump grants, and time-of-use tariffs converge. Vehicle-to-grid programs and peer-to-peer trading further empower households, raising the UK renewable energy market size attributed to prosumers. Utilities respond by aggregating rooftop PV into virtual power plants, retaining their system-balancing roles even as customer meters generate more on-site power. The two-way engagement ultimately broadens the UK renewable energy market without eroding the relevance of incumbent utilities.
Geography Analysis
Scotland dominates generation volumes, with more than 60% of installed offshore capacity, thanks to the 851 MW Seagreen project and the emerging 2 GW MachairWind project, which are credited with displacing upward of 2 million tCO₂ each year. Floating-wind readiness, abundant tidal flows, and a pro-renewables planning ethos consolidate Scotland’s leadership. The GBP 4.3 billion Eastern Green Link 2 direct-current cable enhances export capability to English load centers, further integrating regional surpluses into the UK renewable energy market.
England spearheads solar deployment and corporate PPA activity; the 2.9 GW East Anglia Hub alone represents GBP 10 billion of capital and 7.5% of the 40 GW national offshore goal. Onshore wind obstacles keep greenfield momentum modest, yet battery co-location and hydrogen pilots maintain investment vitality across coastal industrial clusters.
Wales leverages its mountainous topography for onshore wind and pumped-storage retrofits, with tidal pilots off Anglesey broadening its renewable energy palette. Northern Ireland participates via the Integrated Single Electricity Market, exporting wind surpluses to the Republic and carving a niche in small-scale solar aggregation. Collectively, these regional vectors ensure the UK renewable energy market remains both geographically diverse and nationally coordinated.
Competitive Landscape
Market concentration is moderate: SSE Renewables, Ørsted, and ScottishPower hold sizeable offshore pipelines, but foreign majors like Equinor and TotalEnergies accelerate entries through targeted deals. SSE’s GBP 17.5 billion Net Zero Acceleration Programme finances hybrid wind-battery clusters, reinforcing its prime seat within the UK renewable energy market. Ørsted’s pivot from Hornsea 4 underscores cost-inflation realities, yet the firm still commands more than 10 GW globally and is adding a 600 MWh storage unit to Hornsea 3.[5]Ørsted A/S, “Global offshore portfolio,” orsted.com
TotalEnergies bought 435 MW of solar-plus-battery assets from Low Carbon in June 2025, signaling multi-technology ambition. Iberdrola’s EUR 5 billion purchase of Electricity North West couples renewable output with grid ownership, creating synergies others may emulate. Equinor channels North Sea engineering heritage into floating foundations, while Octopus Energy scales retail capital into operational offshore stakes, exemplified by its East Anglia One entry.
Technology differentiation shapes advantage: floating-wind patents, hydrogen partnerships, and digital-twin O&M drive scoring opportunities beyond raw megawatts. The public launch of Great British Energy, armed with £8.3 billion, adds mission-driven capital to underserved community schemes, providing a counterbalance to established developer oligopolies in the UK renewable energy market.
United Kingdom Renewable Energy Industry Leaders
SSE Renewables
Ørsted A/S
ScottishPower Renewables
RWE Renewables
Vattenfall AB
- *Disclaimer: Major Players sorted in no particular order

Recent Industry Developments
- June 2025: TotalEnergies bought 435 MW of UK solar and storage projects from Low Carbon, deepening its domestic footprint.
- May 2025: SSE began building the Strathy South onshore wind farm as part of its Net Zero Acceleration Programme.
- April 2025: The government shortlisted 27 hydrogen projects totaling 875 MW under Hydrogen Allocation Round 2.
- April 2025: Octopus Energy acquired a stake in East Anglia One offshore wind farm, broadening its renewable portfolio.


United Kingdom Renewable Energy Market Report Scope
Renewable energy is energy collected from renewable resources naturally replenished on a human timescale. It includes sunlight, wind, water movement, and geothermal heat.
The United Kingdom's renewable energy sector is segmented by source. The market is segmented by source into wind, solar, hydro, bioenergy, and other sources (Geothermal, Tidal). For each segment, the installed capacity and forecasts have been done based on gigawatts (GW).
By Technology
| Solar Energy (PV and CSP) |
| Wind Energy (Onshore and Offshore) |
| Hydropower (Small, Large, PSH) |
| Bioenergy |
| Geothermal |
| Ocean Energy (Tidal and Wave) |
By End-User
| Utilities |
| Commercial and Industrial |
| Residential |
| By Technology | Solar Energy (PV and CSP) |
| Wind Energy (Onshore and Offshore) | |
| Hydropower (Small, Large, PSH) | |
| Bioenergy | |
| Geothermal | |
| Ocean Energy (Tidal and Wave) | |
| By End-User | Utilities |
| Commercial and Industrial | |
| Residential |


Key Questions Answered in the Report
How large is the UK renewable energy market in 2026?
Installed capacity stands at 74.08 GW, with a roadmap to 132.23 GW by 2031.
Which technology currently dominates UK renewables?
Wind contributes 50.05% of national green generation, led by offshore projects.
Why are grid queues delaying projects?
A 739 GW application backlog strains legacy transmission corridors, though Ofgem’s TMO4+ reform is reprioritizing shovel-ready assets.
How fast is residential solar expanding?
Home installations are growing at an 18.25% CAGR as rooftop mandates and heat-pump incentives align.
What role do corporate PPAs play?
Long-term contracts with data-centre and retail giants guarantee revenue streams, often rivaling CfD prices.
Who are the leading market players?
SSE Renewables, Ørsted, and ScottishPower dominate, while Equinor and TotalEnergies increase stakes through acquisitions and floating-wind expertise.
Page last updated on:


