Market Overview
| Study Period | 2021 - 2031 |
|---|---|
| Forecast Data Period | 2026 - 2031 |
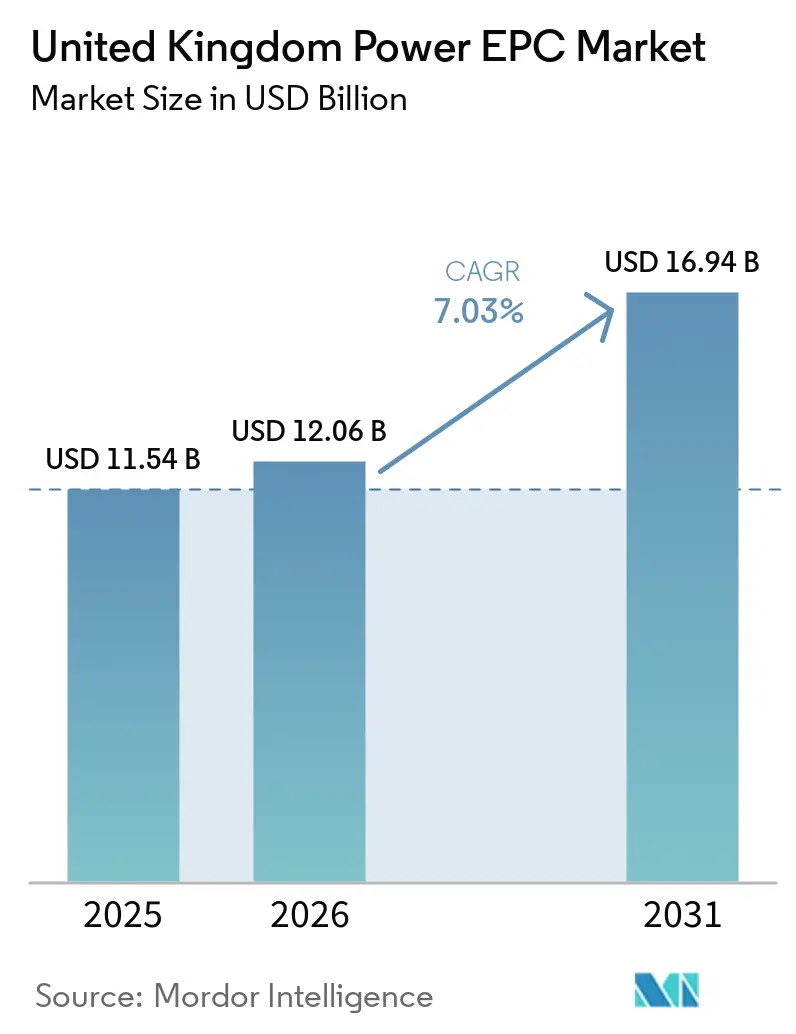
| Base Year Market Size (2025) | USD 11.54 Billion |
| Market Size (2026) | USD 12.06 Billion |
| Market Size (2031) | USD 16.94 Billion |
| Growth Rate (2026 - 2031) | 7.03% CAGR |
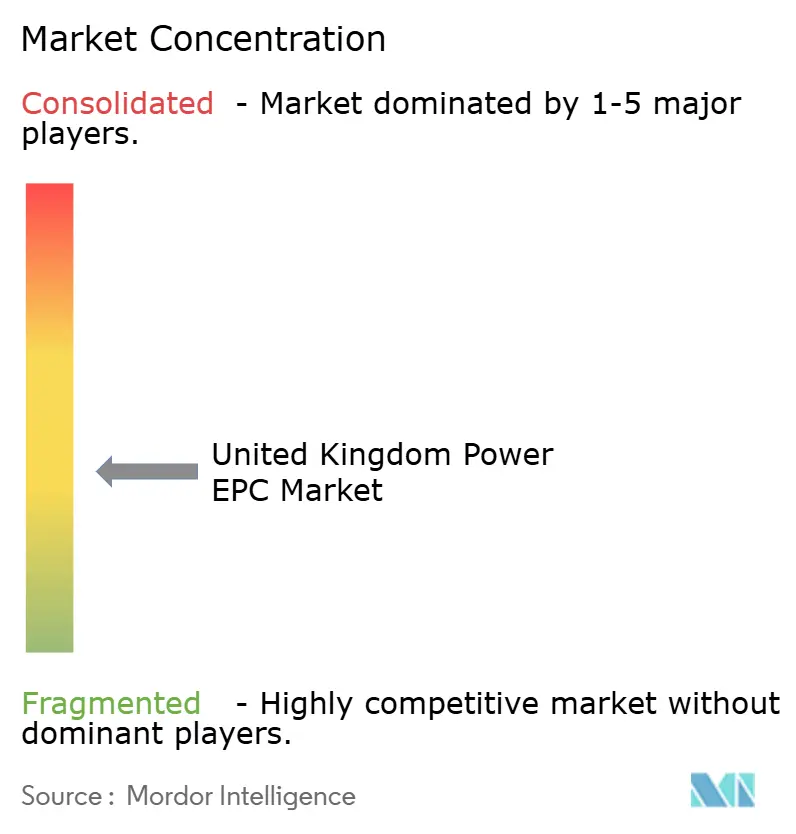
| Market Concentration | Medium |
Major Players *Disclaimer: Major Players sorted in no particular order Image © Mordor Intelligence. Reuse requires attribution under CC BY 4.0. | |
United Kingdom Power EPC Market Analysis by Mordor Intelligence
The United Kingdom Power EPC Market size is estimated at USD 12.06 billion in 2026, and is expected to reach USD 16.94 billion by 2031, at a CAGR of 7.03% during the forecast period (2026-2031).
The trajectory reflects three parallel shifts: accelerated offshore-wind build-out under ScotWind and Celtic Sea leases, renewed nuclear investment led by the July 2025 final investment decision (FID) at Sizewell C, and front-loaded grid reinforcement under the GBP 28.1 billion (USD 35.7 billion) RIIO-T3 framework that supports 50 gigawatts of offshore wind by 2030.[1]Ofgem, “RIIO-T3 Final Determinations,” ofgem.gov.uk Offshore wind alone accounts for more than half of planned generation capacity additions, while nuclear provides long-cycle earnings visibility for civil and mechanical contractors. Transmission spending has risen 70% over the prior regulatory period, pulling forward converter-station, subsea-cable, and transformer orders. Meanwhile, corporate power-purchase agreements (PPAs) from buyers such as Vodafone and BT Group diversify end-user demand away from regulated utilities and anchor merchant renewable projects.[2]Vodafone, “Vodafone Signs UK’s Largest Corporate Renewable Energy Deal,” vodafone.com
Key Report Takeaways
- The United Kingdom power EPC market is segmented into power generation EPC and power transmission and distribution (T&D) EPC. Power generation EPC accounted for 66.8% of the market in 2025 and is projected to grow at a 7.34% CAGR through 2031.
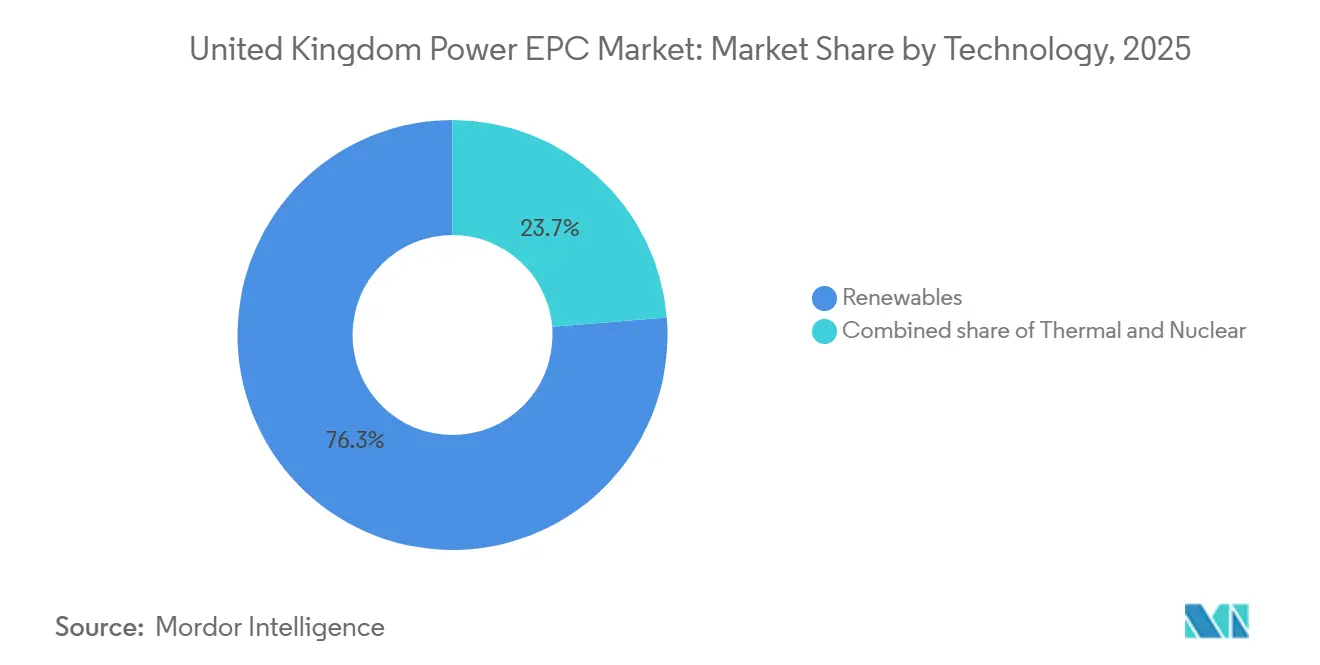
- By technology, renewables held 76.3% of the United Kingdom power EPC market share in 2025 and are forecast to grow at a 12.8% CAGR through 2031.
- By capacity band, projects above 500 megawatts accounted for 63.6% share of the United Kingdom power EPC market size in 2025, yet the up-to-100-megawatt segment is predicted to post the fastest 9.1% CAGR between 2026 and 2031.
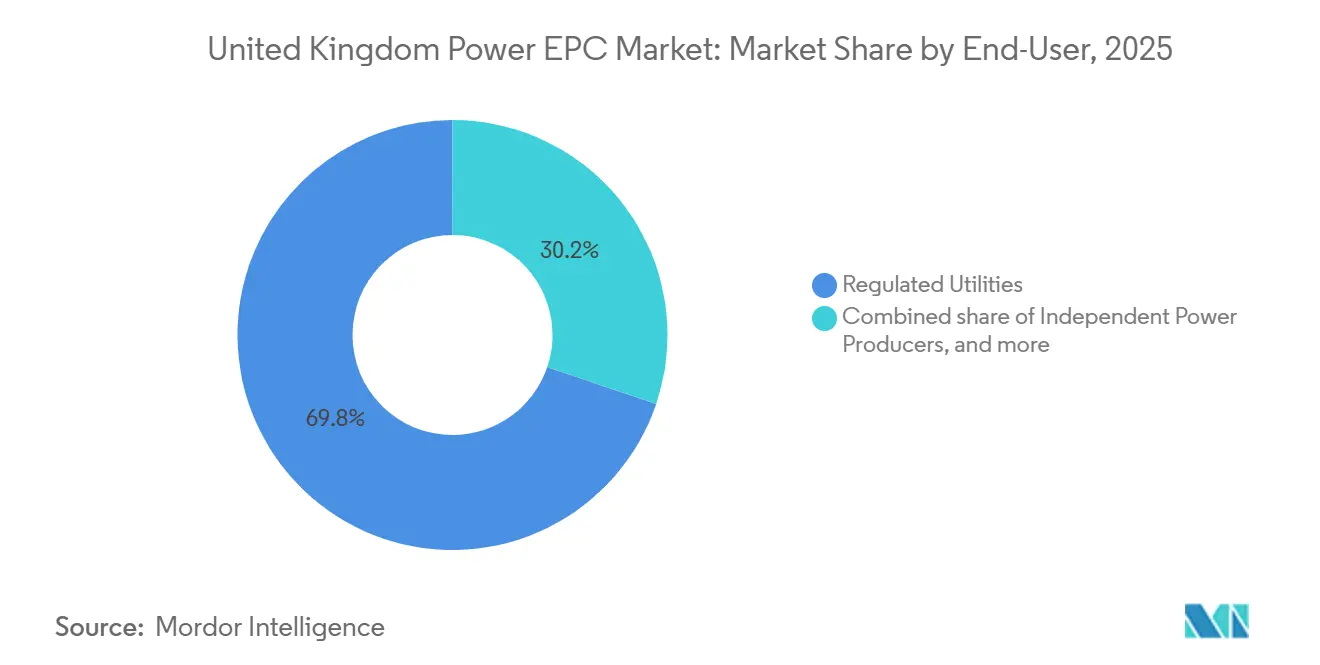
- By end-user, regulated utilities led with 69.8% share in 2025, whereas independent power producers are set to record the highest 8.7% CAGR over the same horizon.
Note: Market size and forecast figures in this report are generated using Mordor Intelligence’s proprietary estimation framework, updated with the latest available data and insights as of January 2026.
United Kingdom Power EPC Market Trends and Insights
Drivers Impact Analysis*
| Driver | (~) % Impact on CAGR Forecast | Geographic Relevance | Impact Timeline |
|---|---|---|---|
| UK offshore-wind megaproject pipeline | 2.1% | Scotland (ScotWind), Celtic Sea (Wales), North Sea (England) | Medium term (2-4 years) |
| Nuclear new-build revival post-Sizewell C FID | 1.5% | England (East Anglia, South West) | Long term (≥4 years) |
| Ageing thermal fleet repowering mandates | 0.9% | England (Midlands, Yorkshire), Wales | Medium term (2-4 years) |
| Fast-track grid-reinforcement funding (RIIO-T3) | 1.8% | National, with concentration in Scotland-England interconnectors | Medium term (2-4 years) |
| PPAs tied to corporate net-zero pledges | 1.2% | National, with early adoption in South East England | Short term (≤2 years) |
| Modular "energy-park" concepts adopted by UK ports | 0.7% | North East England (Teesside), Yorkshire and Humber, Scotland (Aberdeen) | Long term (≥4 years) |
| Source: Mordor Intelligence | |||
UK Offshore-Wind Megaproject Pipeline
Seabed rights awarded under ScotWind cover 17 projects totaling about 30 gigawatts, while Crown Estate Round 5 adds up to 4.5 gigawatts of floating capacity in the Celtic Sea.[3]Crown Estate Scotland, “ScotWind Offshore Wind Leasing,” crownestatescotland.com These allocations dwarf the 14 gigawatts already operating, compressing fabrication schedules and boosting demand for turbine foundations and export cables. Projects such as Ørsted’s 2.9-gigawatt Hornsea 3 require more than 200 turbines and over 100 kilometers of subsea cable, illustrating the scale shift.[4]Ørsted, “Hornsea 3 Offshore Wind Farm,” orsted.com Floating-wind prototypes introduce dynamic-cable and mooring challenges that favor contractors with deepwater oil-and-gas experience. Grid reforms under the Clean Power 2030 Action Plan halve queue times to under 2.5 years, accelerating EPC contract awards. Together, these forces underpin the 12.8% CAGR forecast for renewables EPC.
Nuclear New-Build Revival Post-Sizewell C FID
July 2025 marked the USD 38.1 billion commitment to Sizewell C, the first large-scale nuclear FID since 2016. The Regulated Asset Base model transfers construction risk to consumers, cutting the cost of capital and unlocking EPC scopes covering civil works, reactor-island fabrication, and turbine-hall integration. Doosan Babcock and Ansaldo Nuclear are shortlisted for major packages. The government’s 24-gigawatt nuclear target implies six to eight additional reactors or an SMR fleet, sustaining multidecade EPC workloads. Extended construction cycles of 10–12 years mean revenue recognition will carry well into the 2030s, rewarding contractors that navigate Office for Nuclear Regulation oversight.
Fast-Track Grid-Reinforcement Funding (RIIO-T3)
Ofgem’s RIIO-T3 regime allocates GBP 28.1 billion (USD 35.7 billion) from 2026 to 2031, up 70% from RIIO-T2, to connect 50 gigawatts of offshore wind. Flagship projects include the 2-gigawatt Eastern Green Link HVDC subsea cable and 400-kilovolt backbone upgrades in the Midlands. Sixty percent of spending is front-loaded into the first three years, creating a predictable demand curve for HVDC converters, gas-insulated switchgear, and subsea-cable lay vessels.
PPAs Tied to Corporate Net-Zero Pledges
Corporate buyers signed more than 1.5 gigawatts of renewable PPAs in 2024-2025. Vodafone alone secured 216 gigawatt-hours annually, while the BT Group contracted roughly 600 gigawatt-hours. Transport for London and National Highways have floated tenders to decarbonize rail and road networks. Because sleeved PPAs reduce financing complexity, independent power producers are forecast to show an 8.7% CAGR in EPC spending.
Restraints Impact Analysis*
| Restraint | (~) % Impact on CAGR Forecast | Geographic Relevance | Impact Timeline |
|---|---|---|---|
| Inflation-driven EPC cost overruns | -0.8% | National, with acute pressure in offshore wind and nuclear | Short term (≤2 years) |
| Supply-chain bottlenecks in HV equipment imports | -0.6% | National, with delays concentrated in Scotland-England HVDC links | Medium term (2-4 years) |
| Public opposition to on-shore transmission corridors | -0.5% | East Anglia (Norwich-Tilbury), South East England, East Midlands | Medium term (2-4 years) |
| Source: Mordor Intelligence | |||
Inflation-Driven EPC Cost Overruns
Construction input prices rose 5.6% year-over-year in 2024, while skilled labor costs climbed 6.2%. Fixed-price offshore-wind contracts signed in 2022-2023 now face margin compression as steel and marine-vessel rates exceed indexed clauses. Hinkley Point C’s budget climbed from USD 33 billion at FID to USD 44.5 billion by 2025. Contractors are shifting toward cost-reimbursable models, easing execution risk but eroding bid competitiveness.
Supply-Chain Bottlenecks in High-Voltage Equipment Imports
Transformer lead times have lengthened to 18 months amid surging global grid demand. The United Kingdom imports roughly 70% of transformers and gas-insulated switchgear, mainly from Germany, Switzerland, and India. Eastern Green Link commissioning slipped from 2028 to 2029, and planning resistance around the Norwich-to-Tilbury Sea Link could add USD 1.27 billion to capex. These hurdles push developers toward subsea HVDC routing, which sidesteps land-use disputes but extends timelines by 12–18 months.
*Our forecasts treat driver/restraint impacts as directional, not additive. The impact forecasts reflect baseline growth, mix effects, and variable interactions.
Segment Analysis
By Technology: Renewables Dominate, Nuclear Resurges
Renewables captured 76.3% of 2025 generation EPC value and are projected to grow at a 12.8% CAGR through 2031, driven chiefly by offshore wind. ScotWind and Celtic Sea concessions require EPC outlays above GBP 40 billion (USD 50.8 billion). The sixth Contracts for Difference (CfD) round awarded 9.6 gigawatts at record-low strike prices, reinforcing cost competitiveness. Nuclear EPC revenue, dormant since 2016, resurged with the Sizewell C FID, which alone adds 3.2 gigawatts of capacity. Thermal EPC shrinks as coal retires and gas projects face capacity-market de-rating, though carbon-capture retrofits preserve a narrow niche funded by the GBP 20 billion CCUS program.


By Capacity Band: Megaprojects Lead, Microgrids Accelerate
Projects exceeding 500 megawatts held 63.6% of the 2025 EPC value, dominated by Hornsea 3, Hornsea 4, and the Dogger Bank complex. Gigawatt-scale offshore arrays leverage turbine-procurement scale and optimized marine logistics yet endure 8-10-year development cycles that heighten regulatory risk. The 100-to-499-megawatt band grows moderately as land constraints cap onshore wind and solar acreage.
Installations up to 100 megawatts will post the fastest 9.1% CAGR as corporates deploy behind-the-meter solar-plus-storage and port-based microgrids. Teesside Freeport’s Net Zero cluster demonstrates a modular energy-park model integrating hydrogen, carbon capture, and combined-heat-and-power within a sub-100-megawatt footprint. Ofgem’s local flexibility markets compensate distributed resources, improving project economics for community-energy schemes backed by the GBP 10 million Community Energy Fund.
By End-User: Utilities Anchor, IPPs Surge
Regulated utilities commanded 69.8% of 2025 EPC spending as National Grid Electricity Transmission and Scottish and Southern Electricity Networks executed statutory RIIO-T3 obligations. National Grid’s GBP 27.5 billion (USD 34.9 billion) capex plan secures multi-year civil, electrical, and marine contracts. Distribution network operators pursue smart-grid upgrades worth more than USD 12.7 billion through 2031.
Independent power producers show the quickest 8.7% CAGR, buoyed by corporate PPAs and merchant wind. Ørsted already operates 5.9 gigawatts in U.K. waters and controls a 10-gigawatt pipeline. The Crown Estate and U.K. Infrastructure Bank de-risk early-stage projects, yet their direct EPC procurement remains limited.
Power Transmission and Distribution EPC: Grid Modernization Accelerates
The United Kingdom power EPC market size for T&D stood at USD 3.97 billion in 2026 and should climb to USD 5.41 billion by 2031, reflecting a 6.39% CAGR. Transmission upgrades dominate: more than 1,000 kilometers of new overhead lines, 500 kilometers of subsea HVDC cables, and 50 converter stations are planned. Public resistance to onshore corridors is steering investment toward subsea routing, adding cost but avoiding multi-year planning delays.
Distribution spending centers on cable replacement, 2,000 new substations, and digital monitoring to accommodate electric-vehicle charging. Prysmian has won over USD 2.2 billion in subsea-export contracts, while Siemens Energy and Hitachi Energy supply HVDC converters and gas-insulated switchgear. Battery storage co-located at substations is emerging as a key balancing asset, with National Grid ESO procuring 2 gigawatts through competitive tenders.
Geography Analysis
Scotland leads new-build activity as ScotWind’s 17 projects add almost 30 gigawatts of offshore capacity across the North Sea and Atlantic waters. Floating wind dominates deeper Scottish sites where fixed-bottom foundations become uneconomic beyond 60 meters, so contractors with deepwater oil-and-gas skills win work on dynamic cables and mooring systems. The 2-gigawatt Eastern Green Link HVDC cable illustrates the transmission bottleneck because Scotland produces surplus renewable electricity yet lacks interconnection headroom, a mismatch that forced 1.2 terawatt-hours of curtailment in 2024. Aberdeen has grown into a pre-assembly and logistics hub, but delays to the Beauly-to-Denny 400-kilovolt upgrade push some connection dates beyond 2029 and squeeze contractor margins.
England shows the most diversified order book, spanning nuclear builds at Sizewell C and Hinkley Point C, North Sea wind farms such as Hornsea 3, Hornsea 4, and Dogger Bank, plus the densest RIIO-T3 transmission program. East Anglia alone must connect more than 10 gigawatts of offshore wind by 2030, driving the Norwich-to-Tilbury Sea Link and East Anglia GREEN schemes, each topping GBP 3 billion, yet facing local opposition that pushes some routes offshore and adds cost. Industrial ports at Teesside and Humber pioneer energy parks that cluster hydrogen, carbon capture, and combined-heat-and-power within existing quaysides; Net Zero Teesside will sequester 10 million tonnes of CO₂ a year alongside a 1.5-gigawatt gas plant with post-combustion capture. The South East benefits from interconnectors such as the 1.4-gigawatt Viking Link to Denmark and 1 gigawatt IFA2 to France, prompting co-located battery storage at grid substations to balance cross-border flows.
Wales secures a strategic role through the Celtic Sea Round 5 award of up to 4.5 gigawatts of floating wind, the United Kingdom’s first commercial-scale deployment of the technology. Early engineering shows floating structures cost 30%–40% more than fixed-bottom units, so projects lean on Contract for Difference support until scale drives savings. Grid limits cap further expansion until the North Wales Connection, a GBP 1 billion 400-kilovolt reinforcement, in 2027. Northern Ireland remains a smaller player, focused on the 500-megawatt Moyle interconnector and localized battery projects that ease congestion at Ballylumford.
Competitive Landscape
The United Kingdom power EPC industry remains moderately concentrated. Ørsted, SSE Renewables, and RWE Renewables control more than 60% of offshore-wind development capacity, internalizing EPC margins through in-house construction teams. Multisector contractors Fluor, Wood, and Bechtel compete chiefly in nuclear and thermal projects, where stringent regulatory oversight raises barriers to entry. Balfour Beatty’s GBP 400 million Hinkley Point C contract highlights the company’s niche in nuclear civil engineering.
Equipment suppliers Siemens Energy, ABB, and Hitachi Energy command a strategic chokepoint in HVDC converters, transformers, and gas-insulated switchgear, often locking in three-to-five-year revenue streams under framework agreements. Prysmian dominates subsea-cable supply, with contracts exceeding EUR 2 billion for North Sea export systems.
White-space opportunities revolve around modular port-based energy parks and battery-storage integration with transmission assets. Ofgem’s RIIO-T3 penalty regime for delivery delays encourages consolidation, as smaller EPC firms struggle to post >USD 127 million performance bonds.
United Kingdom Power EPC Industry Leaders
Fluor Ltd
Doosan Babcock Ltd
Bechtel Corporation
Laing O’Rourke
Wood plc
- *Disclaimer: Major Players sorted in no particular order

Recent Industry Developments
- May 2026: The United Kingdom government-supported EDF Energy-led Sizewell C nuclear EPC project in Suffolk faced scrutiny after the National Audit Office highlighted significant financial and execution risks associated with the USD 51 billion project. Despite these concerns, the project continues to progress, involving major UK suppliers and aligning with long-term low-carbon energy generation goals.
- April 2026: Rolls-Royce SMR received nearly USD 809 million in UK government funding to expedite the deployment of small modular reactor (SMR) EPC projects, particularly at the Wylfa site in Wales. This initiative aims to bolster domestic nuclear EPC activities, promote factory-based reactor construction, and enhance the UK's energy security objectives.
- February 2026: The Hinkley Point C nuclear power EPC project announced another delay, with commercial operations now anticipated in 2030. The total construction costs have risen to approximately USD 47 billion. EDF attributed the revised timeline to more realistic execution planning for one of Europe’s largest energy EPC projects.
- January 2026: RWE’s Awel y Môr Offshore Wind Farm in North Wales secured its Contract for Difference (CfD) support during the UK government's seventh allocation round (AR7).


United Kingdom Power EPC Market Report Scope
The power EPC market encompasses the global industry of companies that provide comprehensive execution of power generation, transmission, and distribution projects on a turnkey basis. EPC contractors handle engineering design, equipment procurement, construction, installation, testing, and commissioning of power infrastructure, ensuring project delivery aligns with agreed cost, time, and performance requirements.
The United Kingdom power EPC market is segmented into power generation EPC and power transmission & distribution EPC. By power generation EPC, the market is segmented into technology, capacity band, and end-user. These segments are further divided as technology- thermal, nuclear, and renewables; capacity band- Up to 100 MW, 100-499 MW, Above 500 MW; end-user- regulated utilities, IPPs, industrial captive power, and public sector/SOE. For each segment, the market sizing and forecasts have been done based on revenue (USD Billion) for all the above segments.
Power Generation EPC
| By Technology | Thermal |
| Nuclear | |
| Renewables | |
| By Capacity Band | Up to 100 MW (DER, micro-grid) |
| 100 to 499 MW | |
| Above 500 MW | |
| By End-User | Regulated Utilities |
| Independent Power Producers | |
| Industrial Captive Power | |
| Public Sector and SOE |
| Power Generation EPC | By Technology | Thermal |
| Nuclear | ||
| Renewables | ||
| By Capacity Band | Up to 100 MW (DER, micro-grid) | |
| 100 to 499 MW | ||
| Above 500 MW | ||
| By End-User | Regulated Utilities | |
| Independent Power Producers | ||
| Industrial Captive Power | ||
| Public Sector and SOE | ||


Key Questions Answered in the Report
How large is the United Kingdom power EPC market in 2026?
The market stands at USD 12.06 billion in 2026, tracking toward a 7.03% CAGR through 2031.
Which technology attracts the most EPC spending?
Renewables, chiefly offshore wind, account for more than three-quarters of 2025 value and show a 12.8% CAGR outlook.
What is driving transmission investment?
Ofgem's RIIO-T3 framework front-loads GBP 28.1 billion into 2026-2028 to connect 50 gigawatts of offshore wind.
Why are independent power producers gaining share?
Corporate PPAs from firms such as Vodafone and BT Group underpin project finance, giving IPPs the fastest 8.7% CAGR.
What is the main cost headwind facing EPC contractors?
Inflation has lifted construction input prices 5.6% year-over-year and extended transformer lead times to 18 months.
Page last updated on:


